
Abstract
Theoretical concepts of graphs are highly utilized by computer science applications. Especially in research areas of computer science such as data mining, image segmentation, clustering, image capturing and networking. The cubic graphs are more flexible and compatible than fuzzy graphs due to the fact that they have many applications in networks. In this paper, we define the direct product, strong product, and degree of a vertex in cubic graphs and investigate some of their properties. Likewise, we introduce the notion of complete cubic graphs and present some properties of self complementary cubic graphs. Finally, We present fuzzy cubic organizational model as an example of cubic digraph in decision support system.
Introduction
Zadeh introduced the concept of fuzzy set in his definitive paper [38] of 1965. A fuzzy set of a universe X is a function from X into the unit closed interval [0, 1] of real number. In [39] Zadeh made an extension of the concept of a fuzzy set by an interval-valued fuzzy set, i.e., a fuzzy set with an interval-valued membership function. Interval-valued fuzzy sets have been actively used in real-life applications. For example, Sambuc [26] in medical diagnosis in thyroidian pathology, Kohout [10] also in medicine, Turksen in preferences modelling [37], etc. These works and others show the importance of these sets. Jun et al. [6] introduced cubic sets. Later on, Muhiuddin et al. applied the notion cubic sets on different aspects (see for e.g., [7–9]). The fuzzy graph theory as a generalization of Euler’s graph theory was first introduced by Rosenfeld [25] in 1975.
After Rosenfeld [25] the fuzzy graph theory increases for several years with its different branches, such as - fuzzy threshold graph [28], fuzzy tolerance graph [29], bipolar fuzzy graphs [21, 22], isometry on interval-valued fuzzy graphs [24], highly irregular interval valued fuzzy graphs [19], balanced interval-valued fuzzy graphs [17, 23], fuzzy planar graphs [27], etc. In 2015, Samanta et al. have introduced fuzzy colouring of fuzzy graph [30]. Colouring of fuzzy graphs have studied in [18]. Novel concept of bipolar fuzzy competition graphs is introduced by Sarwar and Akram [32]. Akram et al. [2] defined strong intuitionistic fuzzy graphs, also they discuss intuitionistic fuzzy hypergraphs with applications [3]. Balanced intuitionistic fuzzy graphs is discuss by Karunambigai et al. [11]. The novel concepts of intuitionistic fuzzy competition graph are given by Sahoo et al. [34]. They also discussed intuitionistic fuzzy tolerance graph with application [35], various types of products on intuitionistic fuzzy graphs [33] and product of intuitionistic fuzzy graphs and their degree [36]. Later, Bhattacharya [4] gave some remarks on fuzzy graphs and some operations on fuzzy graphs were introduced by Mordeson and Peng [14]. The complement of a fuzzy graph was defined by Mordeson [15] and further studied by Sunitha and Vijayakumar [31]. Hongmei and Lianhua gave the definition of interval-valued fuzzy graphs [5]. Akram and Dudek defined some operations on interval-valued fuzzy graphs [1]. Neutrosophic graph have been studied in [16]. Recently a lot of work related to fuzzy graph have done [12, 41].
Rashmanlou et al. [20–22] introduced some properties of highly irregular interval-valued fuzzy graphs, and new concepts of bipolar fuzzy graphs. In this paper, we define the the direct product, semi-strong product, strong product, union, and join on cubic graphs and investigate some of their properties. Likewise, we introduce the notion of complete cubic graphs and present some properties of self complementary cubic graphs.
Preliminaries
We introduce below necessary notions and present a few auxiliary results that will be used throughout the paper.
A map λ : X → [0, 1] is called a fuzzy subset of X. For any two fuzzy subsets λ and μ of X, λ ≤ μ means that, for all x ∈ X, λ (x) ≤ μ (x). The symbols λ ∧ μ, and λ ∨ μ will mean the following fuzzy subsets of X
Let X be a non-empty set. A function A : X → [I] is called an interval-valued fuzzy set (shortly, an IVF set) in X. Let, [I] X stands for the set of all IVF sets in X. For every A ∈ [I] X and x ∈ X, A (x) = [A- (x) , A+ (x)] is called the degree of membership of an element x to A, where A- : X → I and A+ : X → I are fuzzy sets in X which are called a lower fuzzy set and an upper fuzzy set in X, respectively. For simplicity, we denote A = [A-, A+]. For every A, B ∈ [I] X , we define A ⊆ B if and only if A (x) ≤ B (x), for all x ∈ X.
Cubic graphs
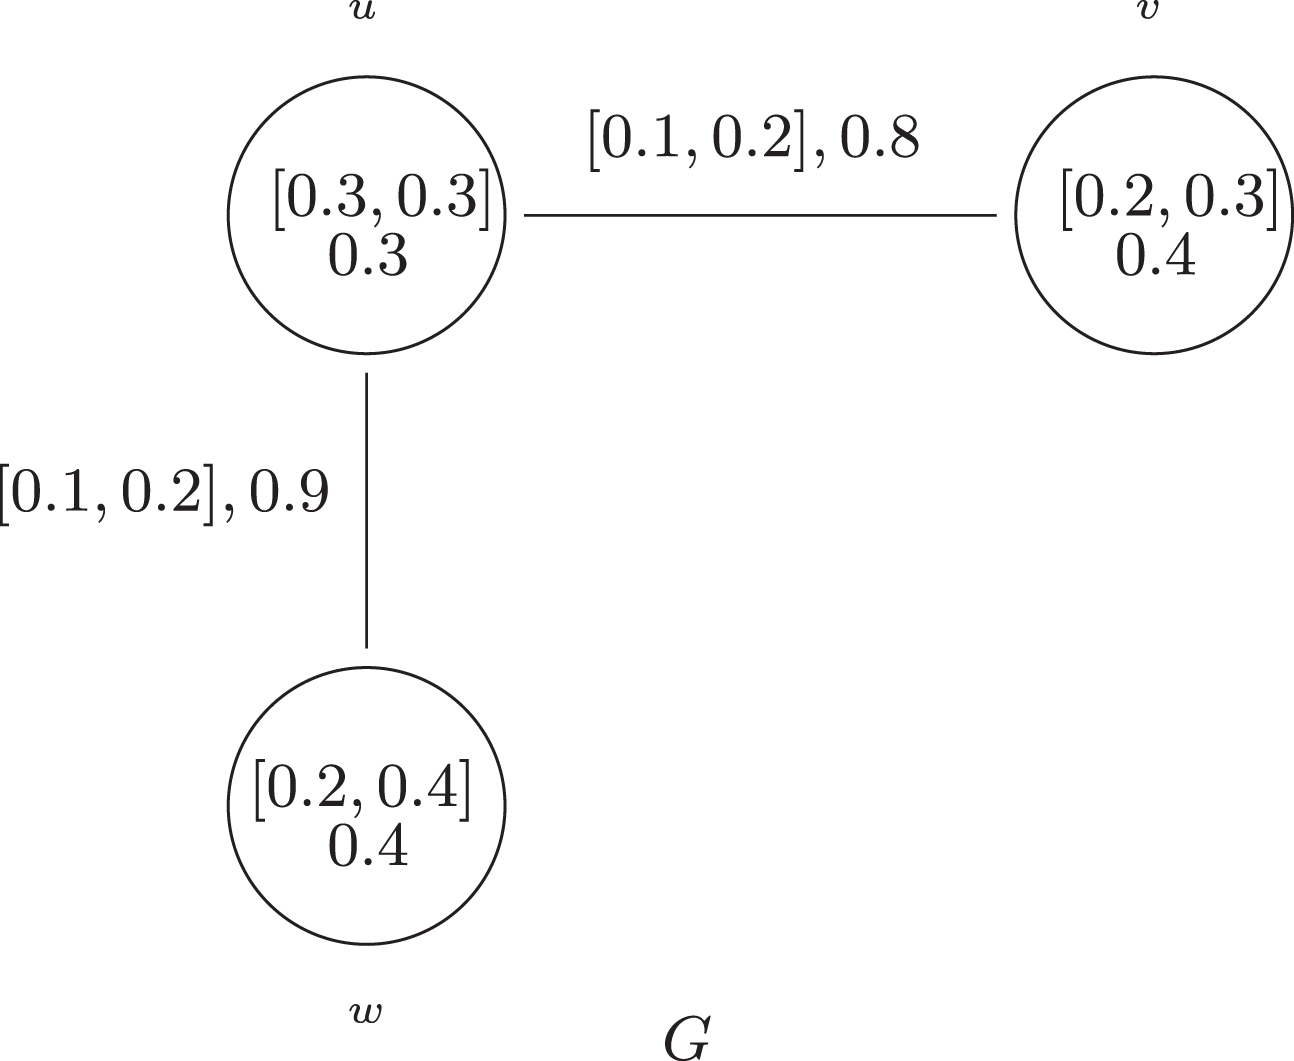
Weight of vertices and edges, first row represents name of vertices, second row represents the degree of acceptance of the vertices and third row represents the degree of confidence of the ’degree of acceptance’ and other rows are similar for vertices”
Weight of vertices and edges, first row represents name of vertices, second row represents the degree of acceptance of the vertices and third row represents the degree of confidence of the ’degree of acceptance’ and other rows are similar for vertices”
Then, simple calculation show that G = (G*, P, Q) is a cubic graph of G*.
Weight of vertices and edges
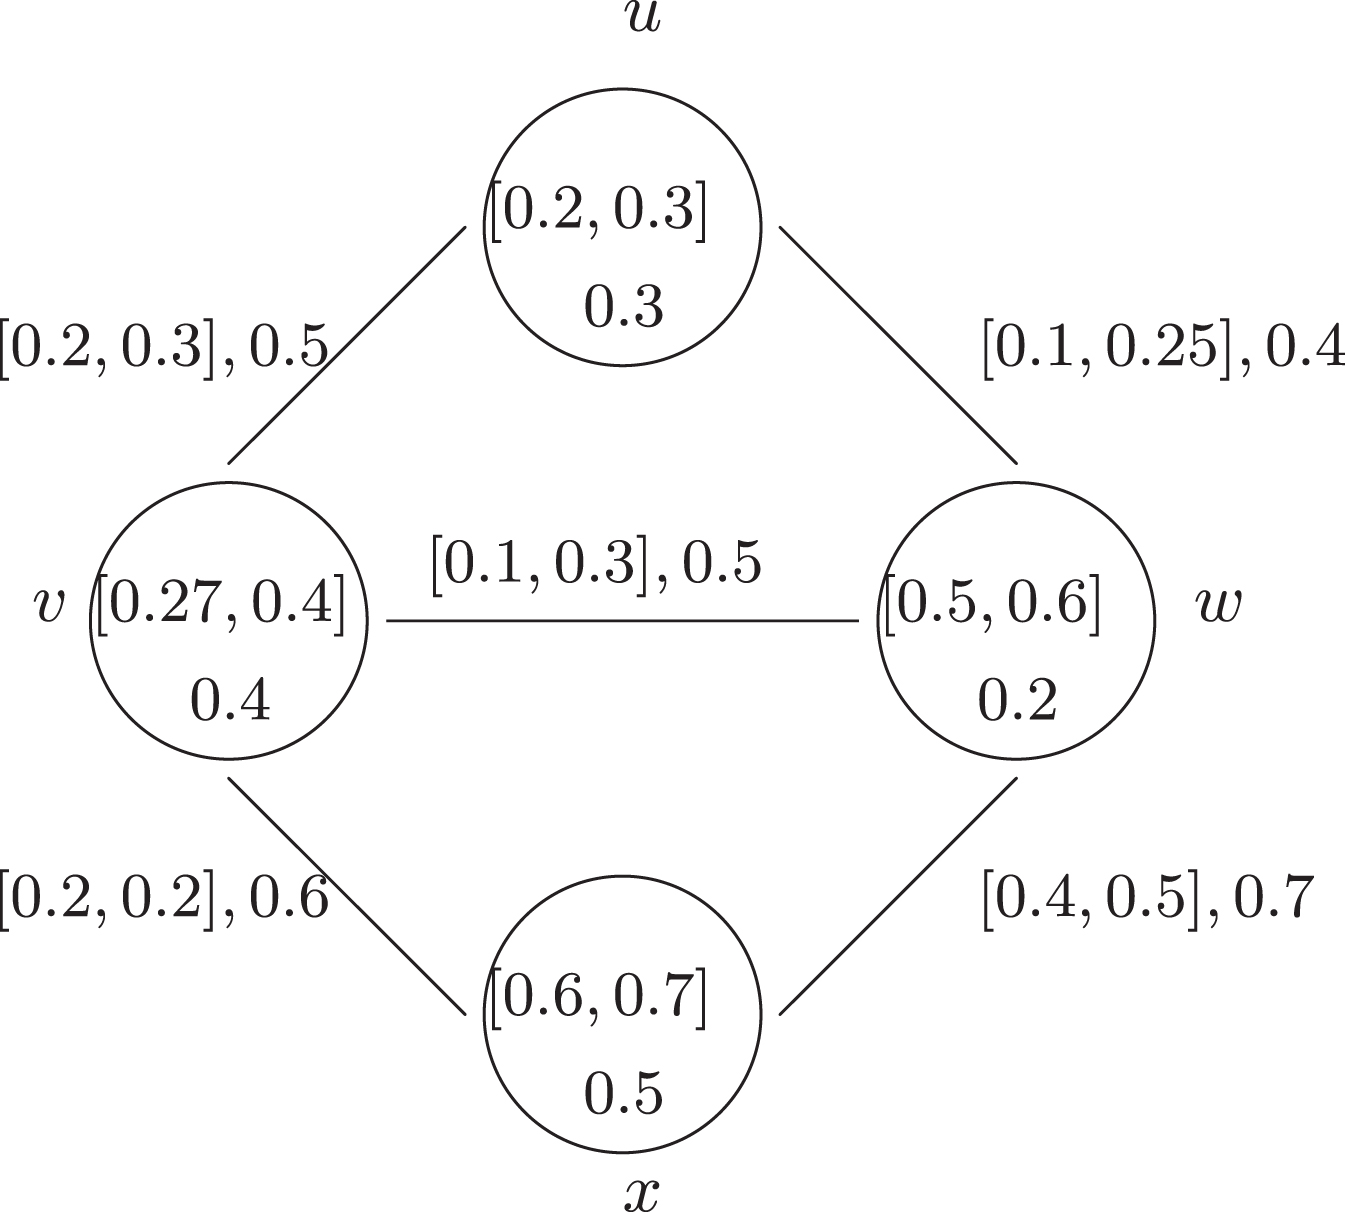
Cubic graph G.

Complete cubic graph G.
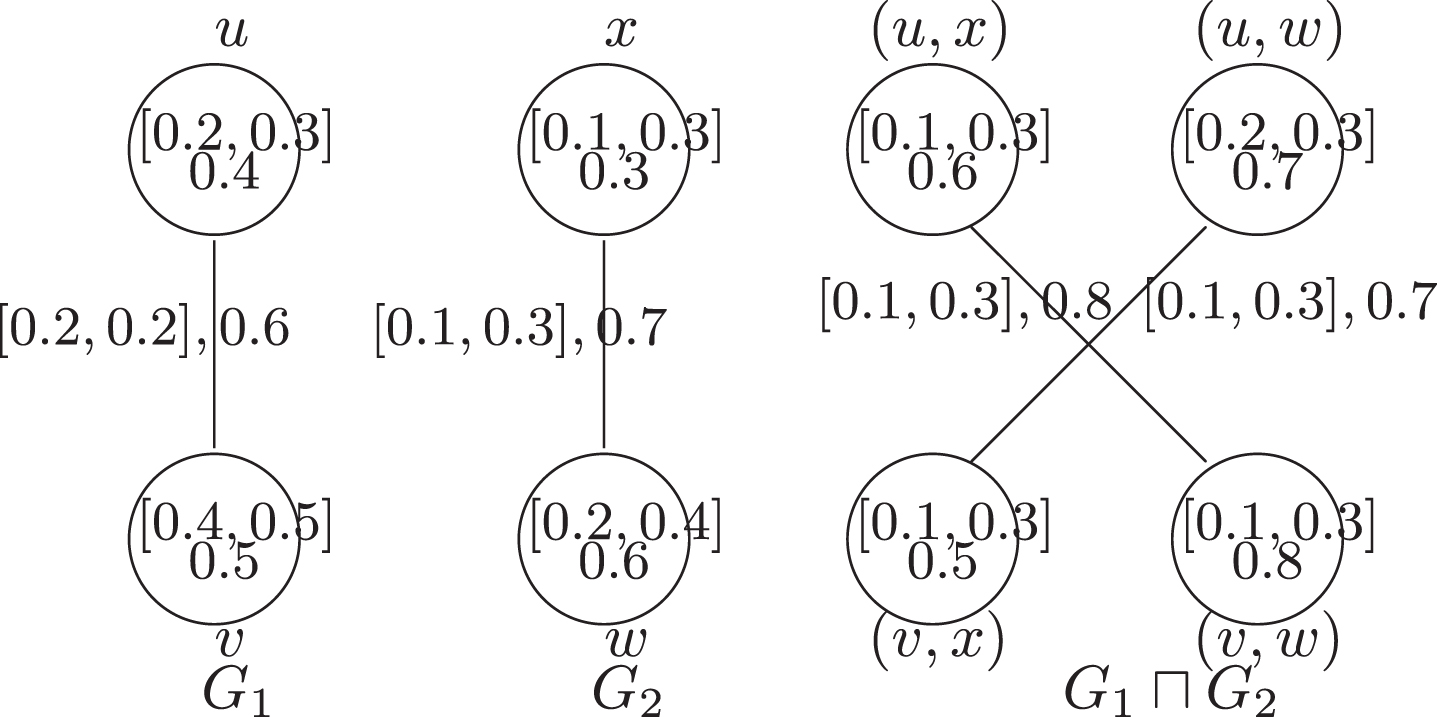
G1, G2 and G1 ⊓ G2.
It is easy to show that G1 ⊓ G2 is a cubic graph.
The strong product between cubic graph is an important construction of cubic graph as it contains an edge between every pair of vertices.
The following example illustrates that strong product of cubic graphs is another cubic graph where between every pair of vertices, there exist an edge.

G1, G2 and G1 ⊗ G2.
By a routine computation, it is easy to see that G1 ⊗ G2 is a cubic graph.
Now, if (u1, w) (u2, w) ∈ E, then
Similarly, we can show that
Herein, we derive the degree of a vertex in direct product.
By definition of direct product for any (u1, u2) ∈ V1 × V2 we have:
Now we derive the degree of a vertex in strong product.
By the definition of strong product for any (u1, u2) ∈ V1 × V2 we have:
In this section, we define homomorphism, isomorphism, weak isomorphism, and co-weak isomorphism between two cubic graphs and show that isomorphism between cubic graphs is an equivalence relation.
(1) A homomorphism f : G1 → G2 is a mapping f : V1 → V2 which satisfies the following conditions:
(2) An isomorphism f : G1 → G2 is a bijective mapping f : V1 → V2 which satisfies the following conditions:
If f : G1 → G2 is an isomorphism, then we say that G1 and G2 are isomorphic and we write G1 ≅ G2.
(3) A weak isomorphism f : G1 → G2 is a bijective mapping f : V1 → V2 which satisfies the following conditions:
(e) f is homomorphism.
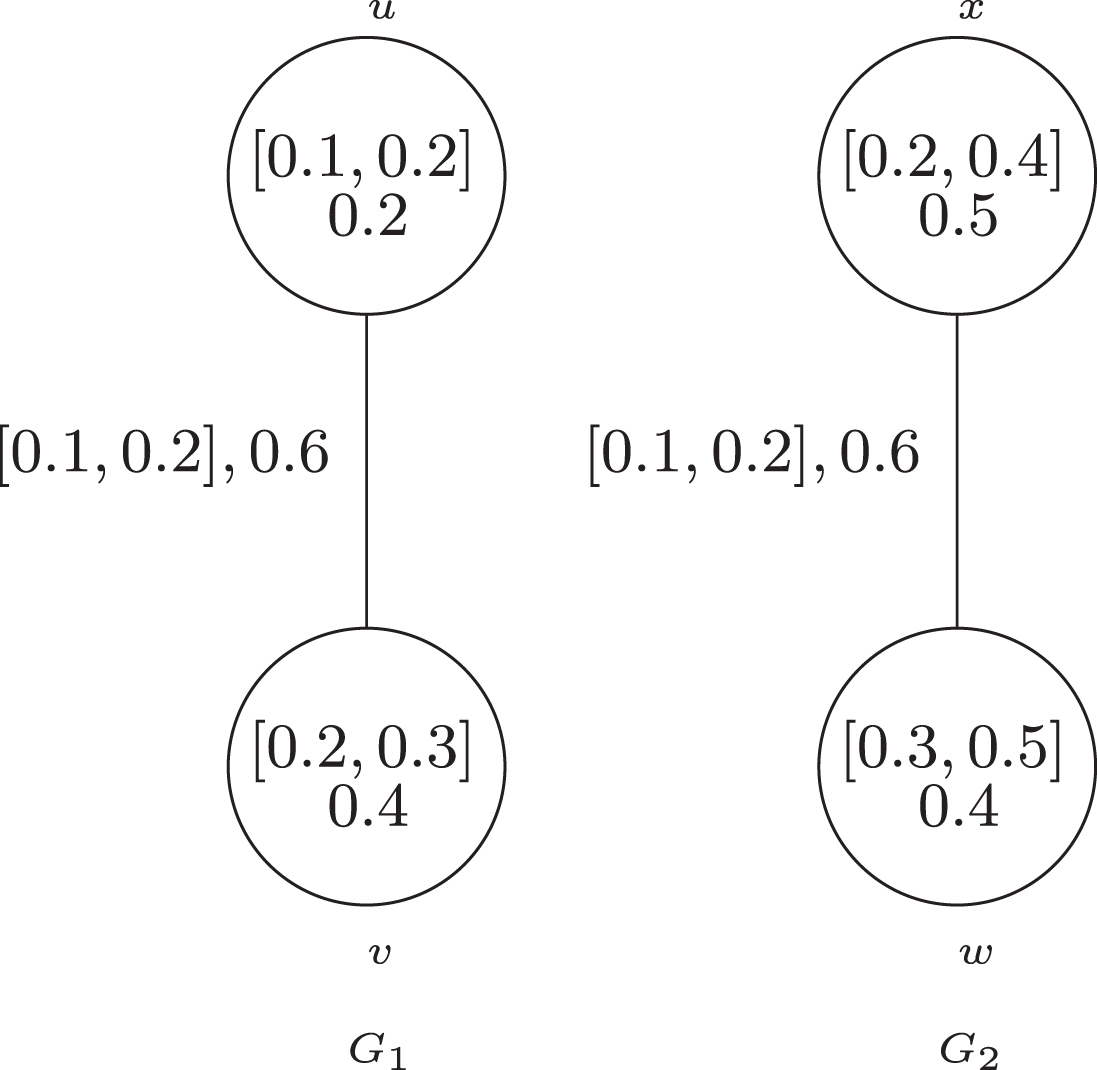
Let f : V1 → V2 is defined by f (u) = w and f (v) = x. Then we see that:
(g) f is homomorphism,
Let f : V1 → V2 is defined by f (u) = x, and f (v) = w. By routine computations, we can show that the map f is a co-weak isomorphism but it is not an isomorphism. Since
Now, a cubic graph G is said to be self complementary if
Here G is self complementary, since bijective mapping
and
Also,
Fuzzy cubic organizational model
Graphs can be used to model many types of relations and processes in physical, biological, social and information systems. In studies of behaviour of group persons, it is noticed that certain persons have influence thinking of others. An influence graph is a directed graph which can be used to model this behaviour. In fuzzy influence graph, if vertices represent the persons and its membership degree the authority of persons and edges represent the influence of a person on another person in the social group/industry. Then we can find the most influential person within the group/industry. Now we discuss a cubic model to find out the most influential person in the department of industry with respect to different attributes of employees including conflict, cooperative, industrious, performance, etc. We consider a bank having employees and their designations as shown in Table 3. Here, we consider only the parameter cooperation and the degree of cooperation is taken as an interval valued fuzzy membership value and its degree of acceptance.
Names of employees in a bank and their designations
Names of employees in a bank and their designations
A survey conducted on bank producted the following results. Jafar is such a person of a bank who is active in every crucial decision and responds calmly in stressful situations. Jafar and Reza have a good relationship and have worked together. Reza values Jafar. Jafar is a right hand of the Bank president. Saleem has a great influence in the development team. Bashir’s ability to communicate effectively and politely enables him to perform his job effectively. Also, he has good-natured and pleasant to others.
Consider the directed graph G* with vertex set {Ali, Jafar, Reza, Bashir, Mohammad, Saleem, Hassan, Imran} as shown in Fig. 8. The vertices represent employees and directed edges represent any cooperation/relationship between them.
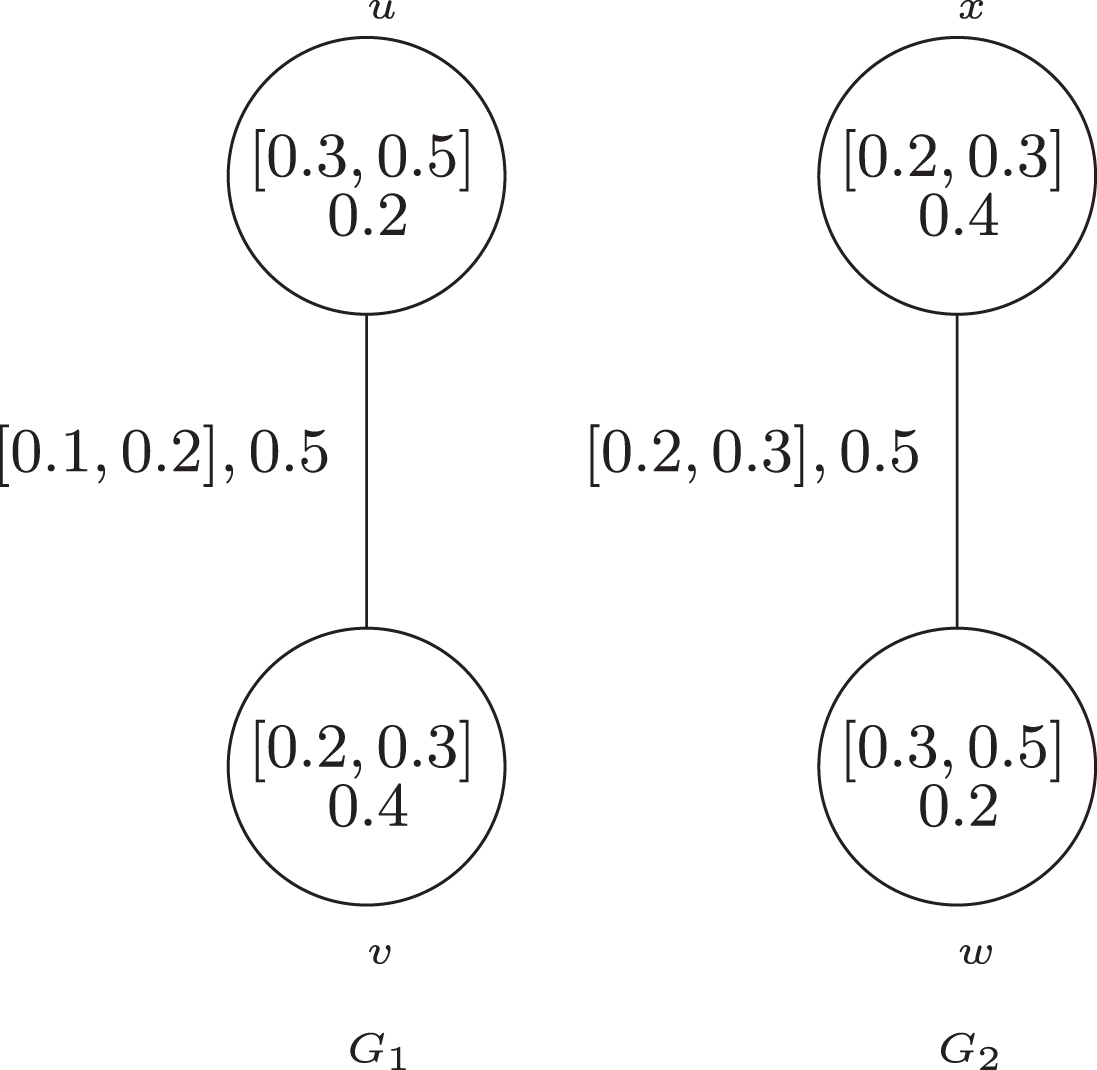
Cubic graphs G1 and G2.
Cubic graphs G1 and G2.
Self complementary cubic graph G.
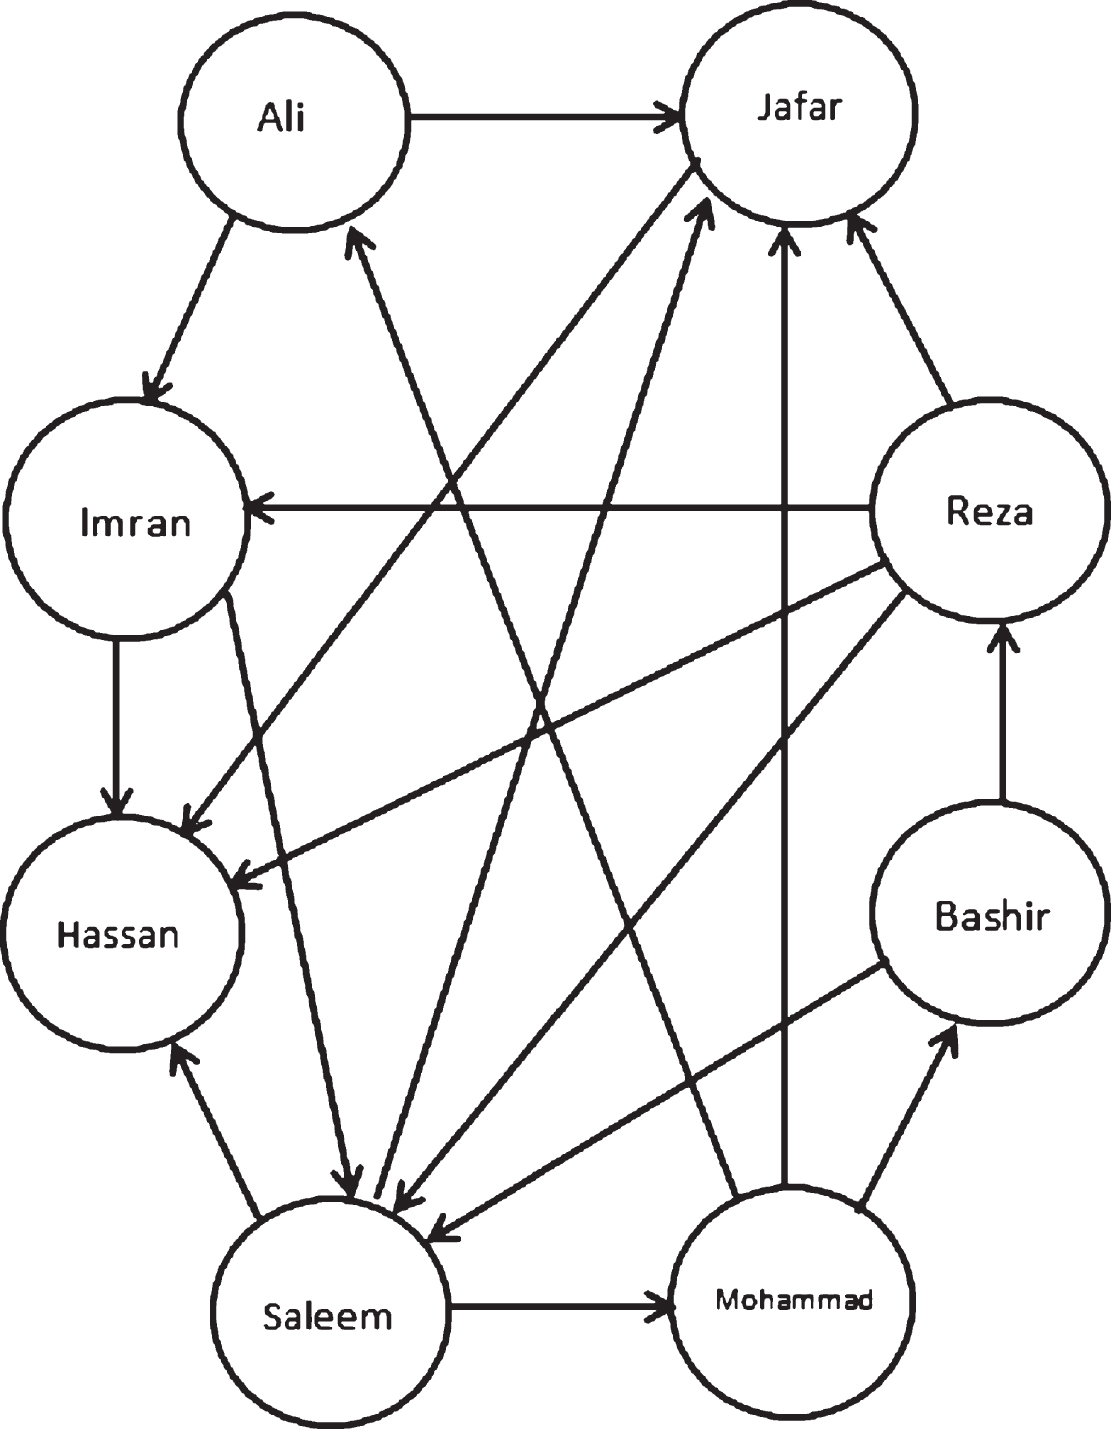
Directed graph.
Now using the results conducted by the bank we can draw fuzzy influence digraph of G* corresponding to attributes cooperation and conflict.
Fuzzy influence digraph is shown in Fig. 9 and tabular representation of this graph is given in Table 4. The vertices represent the employees and the membership degrees of the vertices represent the power of cooperation of employees in the bank. The edges represent dependence in their cooperation on one another. If there is no edge between any two employees, it does mean the corresponding employees are cooperative. The degree of membership can be interpreted as a percentage of dependence. We can easily seen in Fig. 9, that cooperation power of Ali, Jafar, and Saleem are more than all other employees. If we talk about Saleem, he depends on Jafar and Hassan. The degree of power of cooperation of Mahammad is [0.1, 0.3] , 0.5 i.e., 10% to 30% with guarantee 50%. It is vivid that Jafar is the more important and cooperative person in the bank because many people depend on him.
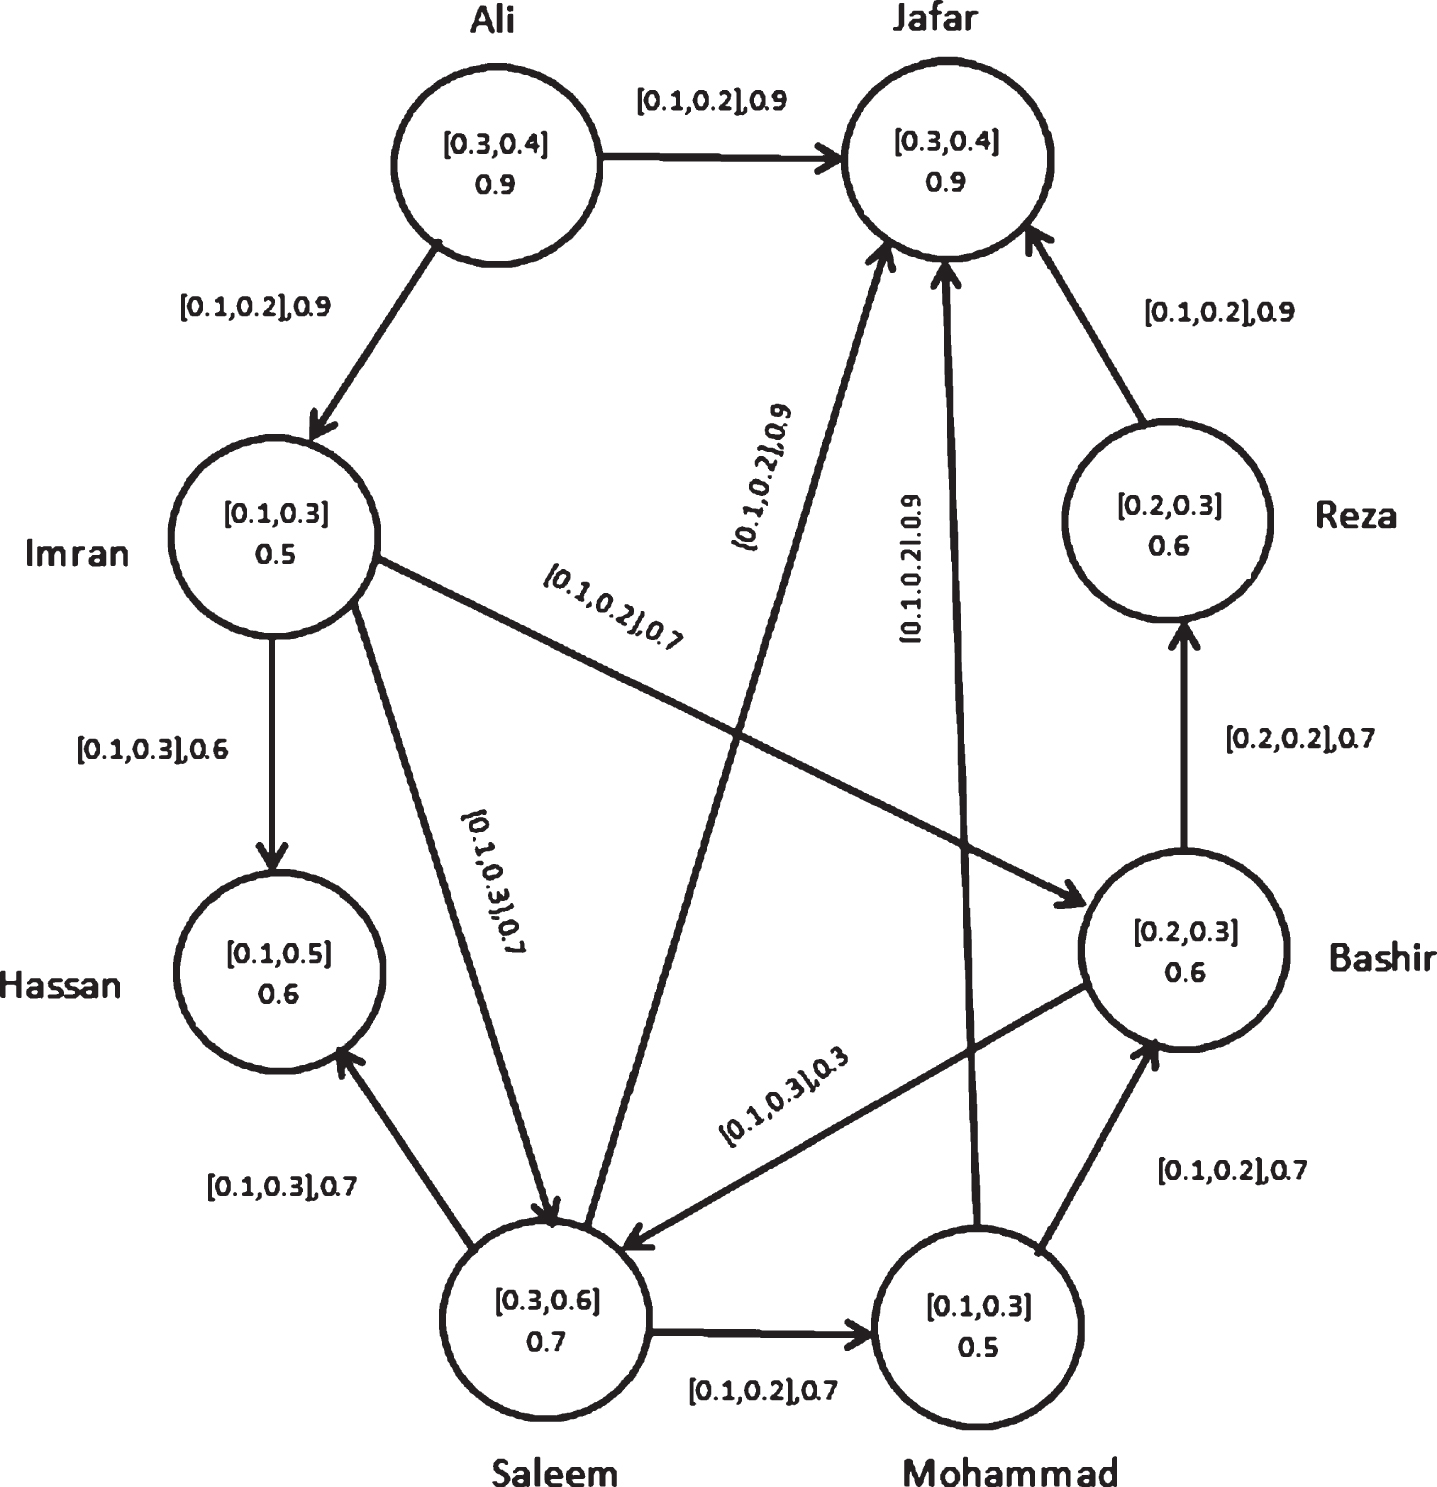
Fuzzy influence graph w.r.t employees cooperation.
Vertices and their membership values
Fuzzy influence digraph is shown in Fig. 10 and tabular representation of this digraph is given in the Tables 4 and 5. Table 4 indicates the vertices and their membership values and Table 5 represents the edges and their membership values. The vertices represent the employees and membership degree of vertices (Table 4) represent their goodness (behaviour). The edges represent cooperation between two employees. If there is no edge between any two employees, it means that the employees have no cooperation. We can seen in Fig. 10 that, the membership degree of Ali and Imran is [0.2, 0.3] , 0.8 i.e., the degree of cooperation between the employees is 20% to 30% with guarantee 80%. Figure 10 shows that, Ali and Imran have more membership degree of their goodness than all other employees.
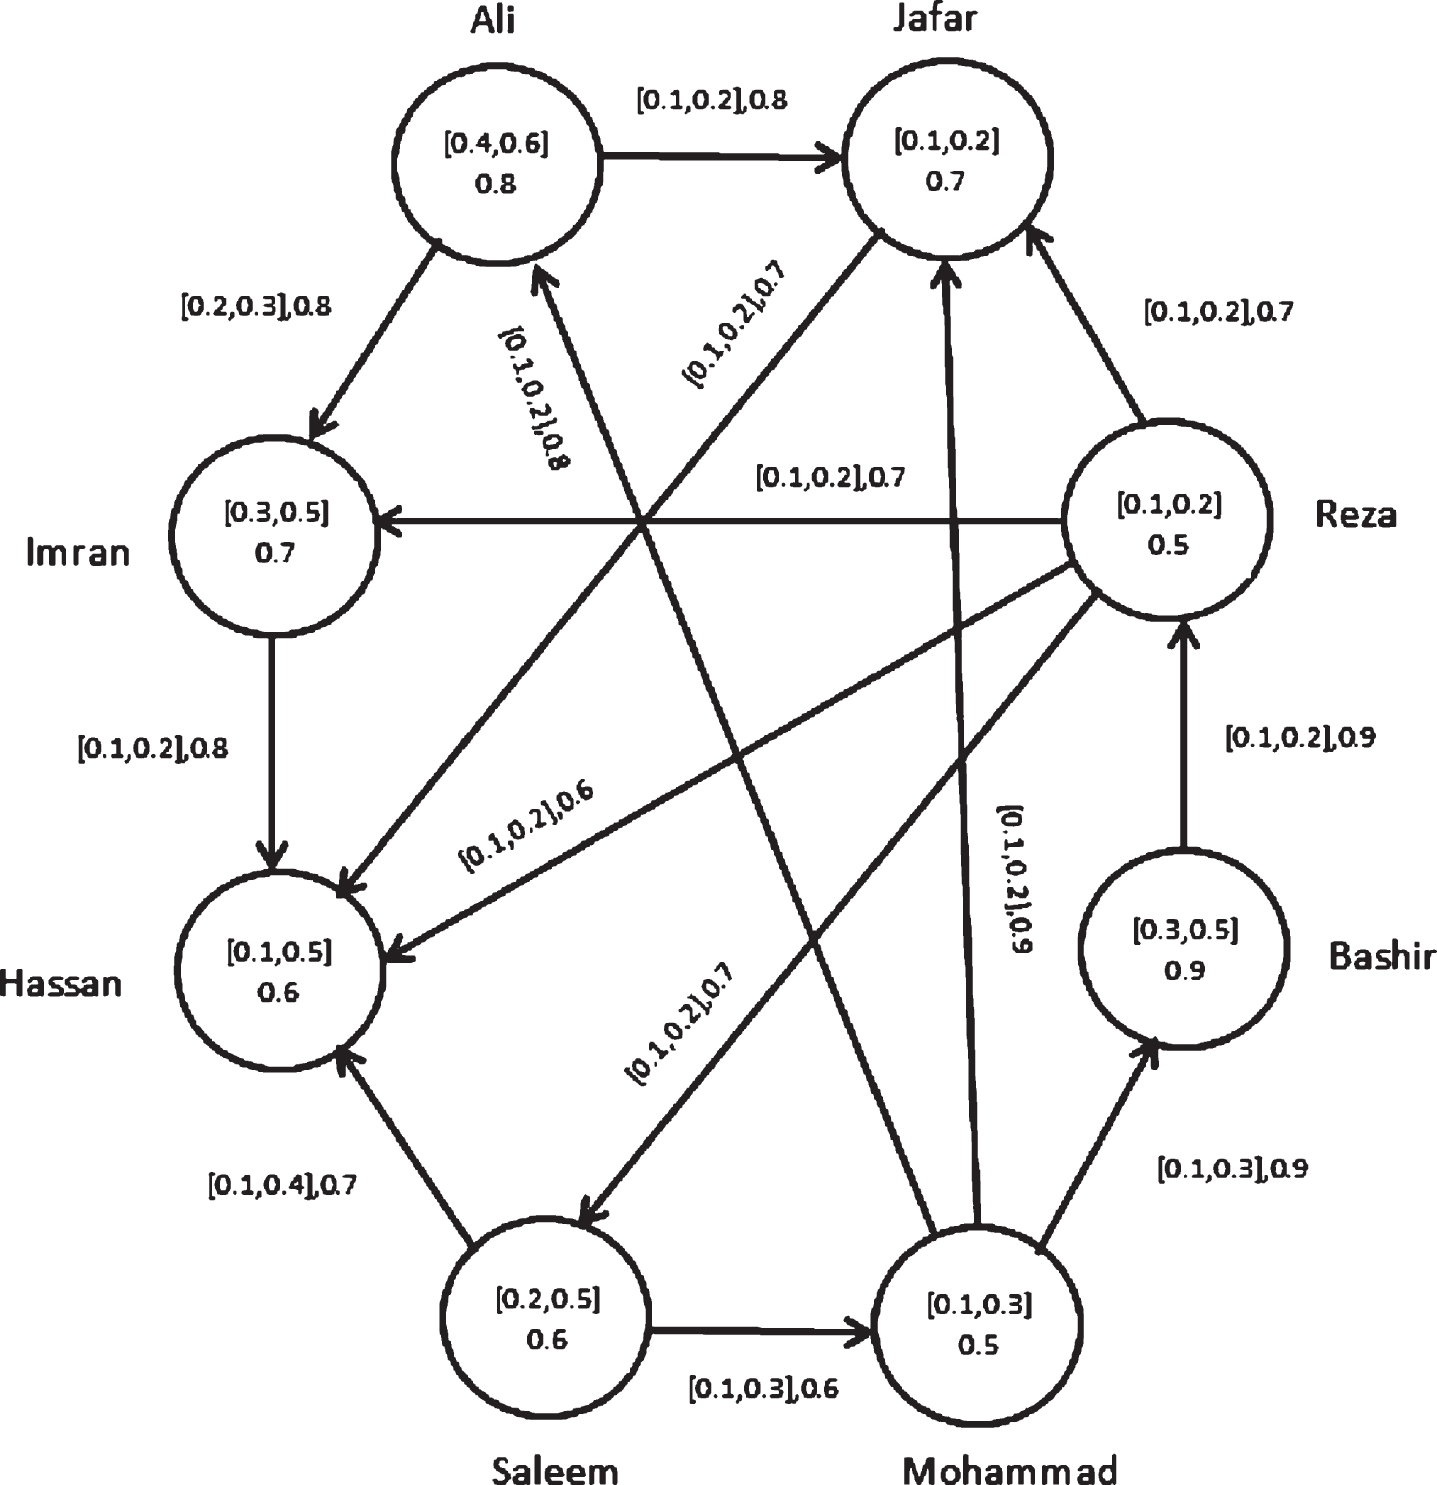
Fuzzy influence graph wrt attributes: conflict.
Edges and their membership values
Graph theory is an extremely useful tool in solving the combinatorial problems in different areas including geometry, algebra, topology, optimization, and computer sciences. So, we have introduced cubic graphs and have presented several properties in this paper. The future study of cubic graphs may also be extended with an application of cubic graph in expert system, neural networks, and geographical information system. This new extension provides a significant addition to existing theories for handling uncertainties and leads to potential areas of further field research. The proposed concepts can be used in system analysis, circuit clustering and pattern recognition, etc.
Footnotes
Acknowledgments
The second author was supported by the research grant S-0198-1440, Deanship of Scientific Research, University of Tabuk, Tabuk-71491, Saudi Arabia.