
Abstract
Cancer is a prevalent disease which comes in several forms. The need of the hour in cancer research is to be able to diagnose cancer in its early stages. The furthermost common forms of cancer among women us breast cancer. In recent times, there has been a drastic increase in the number of breast cancer cases among women. As a wide range of medical data is available in electronic form and with easy access to Machine Learning(ML) techniques disease progression risk evaluation has been made easier. These ML tools can aid in giving us complex insights from the massive amounts of available data. Some of the techniques used for developing predictive models for perfect decision making in cancer research are Artificial Neural Networks (ANNs), Bayesian Networks (BNs), Support Vector Machines (SVMs), and Decision Trees (DTs). Although it is acceptable that ML is used to predict cancer progression, we need some level of validation. In this paper, we have come up with a review of several ML methods in modelling cancer progression. We discuss several predictive models based on supervised ML techniques and the inputs given by users, along with the data available. The results that were obtained from Logistic Regression show us that this method gave a significantly higher accuracy than most other classifiers. The best accuracy is 98.2%, however, the best precision and recall is 100 and 98.60% correspondingly.
Keywords
Introduction
A lot of research has sprung up in the field of cancer in the past decade [1–3]. Different methods, including screening in early stages were taken up by medical physicians to find cancer in its early stage. Also, new strategies have been devised for the initial level prediction of cancer medication results. Through the growth of technology in the medical field, a large amount of cancer data is collected and available for research. But the most difficult task faced by the physicians is the precise prediction of disease consequence. ML approaches are a popular tool used by medical scholars [4, 5]. These techniques are capable of finding patterns and relationships between the data available in complex datasets. Innovations in Information Technology (IT) have provided the latest hardware and software that facilitates acquiring mass expressive tutor features in data and information on cancer research. The breast cancer can be diagnosed from the mammography by radiologists and physicians.
Though the mammograms had proven values, the differences in the doctor’s interpretations let to low prediction accuracy. And as we keep employing new technology to gather the data, it gets tougher for the physician to diagnose the patient based on a large number of cancer cases. Thus, data reasoning methods have been used for creating very important cancer diagnosis conclusions. This includes summarizing of circulating miRNAs serve as an increasing grade for cancer detection and identification [6, 7].
But it can be seen that such methodologies suffer from low sensitivity concerning the minute difference in malignant tumors. This lists the potentials drawbacks of cancer prediction outcome. Gene signatures can be used for early diagnosis, but the gene expression profiling can be used in hospitals. In this paper, ML methods for modelling cancer diagnosis and prediction are shown.
A number of algorithms are used for classification and prediction of breast cancer by comparing the performance of 6 algorithms: K-Nearest Neighbors Algorithm (KNN), Decision Tree Classification (DTC), Gaussian Naive Bayes (GNB), SVM, Random Forest (RF) and Logistic Regression (LR) on the Wisconsin Breast Cancer (original) datasets. These are some of the most important mining algorithms and the top 10. We aim to achieve efficiency and effectiveness in terms of accurateness and precision.
The paper is orchestrated as: The essential research works which are closely associated with the proposed work is given section 2. After that, define the dataset that is used for assessment and information preprocessing followed by details of Logistic Regression, Random Forest Algorithm, kNN Classification, Decision tree classifier, Naïve Bayes classifiers including implementation and some related issues given in section 3. The experimental outcomes are given in section 4. At last, the important insights along with the future enhancements are concluded in section 5.
Related works
Classification is a noteworthy and vital task in machine learning. A lot of studies have been carried out on machine learning methods by applying various medical datasets to classify Breast Cancer. Most of them depict virtuous classification precision. In this paper, a literature survey has been done in the area prediction of a breast cancer diagnosis. The primary focus is numerous features of these studies and their challenges. Some of these features included, the dataset used, their experimental arrangements, based on classifier selection, windowing, a feature selection method, etc.
In [8] for detecting breast cancer, Simple Logistic, RBF Network and RepTree were proposed. The comparison between SVM classifiers like neural networks, Naïve Bayes, etc. is utilised to locate the classifier that is most accurate in breast cancer datasets. The SVM-RBF kernel classifiers are most precise with a rate of 96.84%. The accuracy and efficiency of CART with and without feature selection was proposed in (9). In terms of accuracy, a model was built using the size of the tree on various Breast Cancer Datasets. Experimental results prove that Feature Selection – which is a preprocessing technique increases the accuracy of classification. It is clear from the results that even though we have considered only the datasets pertaining to breast cancer, one particular feature selection may not provide the best accuracy for all Breast Cancer Datasets. The count and type of attributes along with their instances together determine the best feature selection framework for a specific dataset.
A method for selecting required data and identifying breast cancer using a hybrid of SVM and the k-means algorithm was proposed in (10). K-means is used to locate the concealed information on the tumor, following which the tumor’s membership is calculated and then utilised as a new feature for the training system. Effective features are identified, and then SVM is used for the sake of efficient training for the identification of the tumors. The proposed method is known to improve the detection accuracy to 97.38%.
In (11), an accurate breast cancer detection diagnostic framework using HFS was presented. This framework uses WLSTSVM as a classification strategy and CFS to perceive the significance of all the features. The HFS method showed a precision of 97.55% by efficiently dealing with the reported data imbalance problem. In (12), an efficient hybrid data mining framework was proposed. This technique comprises of two levels. In the first level, a data mining approach called the statistical method to increase the efficiency of the data mining procedure and reduce the computational complexity. In the second level, a discrete PSO was used. In this PSO method, the particles were assigned with a positive number with a feasible structure of the system. Thus, the proposed work got 96.71% compared to existing frameworks.
The contribution towards the proposed ADOBE works as follows
Dataset and methodologies
The motive is to accurate detection of Breast Cancer using Wisconsin dataset [13–15]. This dataset has about 699 patterns and 9 attributes like the cell shape with uniformity, clump size, marginal adhesion, single epithelial cell size, normal nucleoli, bare nuclei, bland chromatin, and mitoses. The benign and malignant are 2 two output classes.
Background of ML methods for breast cancer prediction
Machine learning is a very interesting area of research and innovation in computer science as well as in engineering. Since it involves extracting meaningful patterns from data, it can be subcategorized as artificial intelligence, the best part of using machines is that we can be assured that the job will be carried out consistently and effortlessly without any human intervention. To understand how machine learning works, we first need to understand the following terminology such as Classification Model Algorithm, labelled data, Training, Validation Set and Testing.
Furthermore, we can classify machine learning into 3 important groups based on attributes, learning approach, and how the dataset is utilized [16–18]. We need to classify and identify the usage of the algorithms, part of input data, and learning methods need to be employed. In this paper, CfsSubset Eval, PCA ranker, correlation attribute evaluation for feature selection and feature evaluation as well as Logistic regression, Decision Tree, Naive Bayes classifiers are being used.
Classification
Classification is that data mining task which involves conveying the objects to predefined categories based on object characteristics. The input training set is a set of objects each associated to an attribute. These attributes can be continuous values, when they are ordered, or categorical values when they are unordered. The main objective behind this is to build a machine learning model which will be able to classify new data which is not in the training dataset into a class. For this, several classification methods can be used.
Logistic regression
Logistic regression, which is a statistical solution is a supervised technique available in machine learning. It is a popular statistical framework for binary dependent variables which applies a logistic function. In regression analysis, Logistic regression can be defined as estimating the parameters of the logistic model. The binary classification problems depend on logistic regression. Logistic regression is employed in several fields, including risk prediction in the development of a disease based on the observed characteristics of the patient.
Random forest algorithm
It is also a supervised classification algorithm that makes forests with some Decision trees. More the number of trees, better the efficiency. Every time we have new child nodes, the new Gini Indices are calculated for them and then compared with the existing ones to find the best one.
kNN classification
This classifier gives us an amazing performance with a large data set, approaching infinity. In such cases, the error rate almost reaches Bayes optimization under very mild conditions. Selection of k value and the distance measures affects the performance of the classifier. But research has led to many solutions that can overcome such issues. Missing data can lead to inaccurate results, thus drastically lessening the learning performance of the machine learning and data mining. One of the important solutions to dealing with missing data is missing value imputation.
Decision tree classifier
Decision trees are a very popular pattern classification approach. A top-down recursive and greedy are used to construct the tree. These trees consist of decision, a root node and internal nodes. The classification guidelines can then be derived from the decision tree as if-then-else rules which organize the records with unidentified class label values.
Naive Bayes classifier
It is a probabilistic classifier which is constructed on the Bayes’ theorem, which works on the assumption of strong independence between features. This classifier accepts the occurrence of a feature in a class is inappropriate to the existence of another important feature in the same class. We apply this in our daily lives in filtering spam, sentiment prediction etc. The Gaussian Naive Bayes classifier can classify in 2 steps, namely the construction of the model and classification. A frequency table is then made with the probability of each attribute. During classification, the highest posterior probability is computed to find the class label of the input data.
Feature Selection (FS) is a preprocessing technique in data mining. FS can be used applied in the field of, stats, healthcare statistics and pattern matching. FS intends reducing the amount of attributes by eliminating irrelevant and redundant attributes, thus improving the overall performance of the classifier. The complete dataset has 32 attributes, and the accuracy is evaluated based on several classifiers. However, in case of a reduced dataset, the attributes are selected based on Principal Component Analysis (PCA). Here, only 12 best features are picked and furthermore, applying Best First method on Subset Evaluation reduces it to 11.
Proposed breast cancer diagnosis framework-ADOBE
This section gives us a representation of the proposed Logistic Regression. This technique is used to model definite results as a function of constant and definite variables. This can then predict the probability of occurrence of an event based on predictor variables. Given function in the form Y = f(X) or f: X ->Y or P(Y|X) in the case where Y is a discrete vale and X=(X) is any vector containing discrete or continuous random variables. It can reflect the case only where Y is a Boolean variable. In general, Y can be any finite number of discrete values. Fig. 1: Workflow for classification of breast cancer.
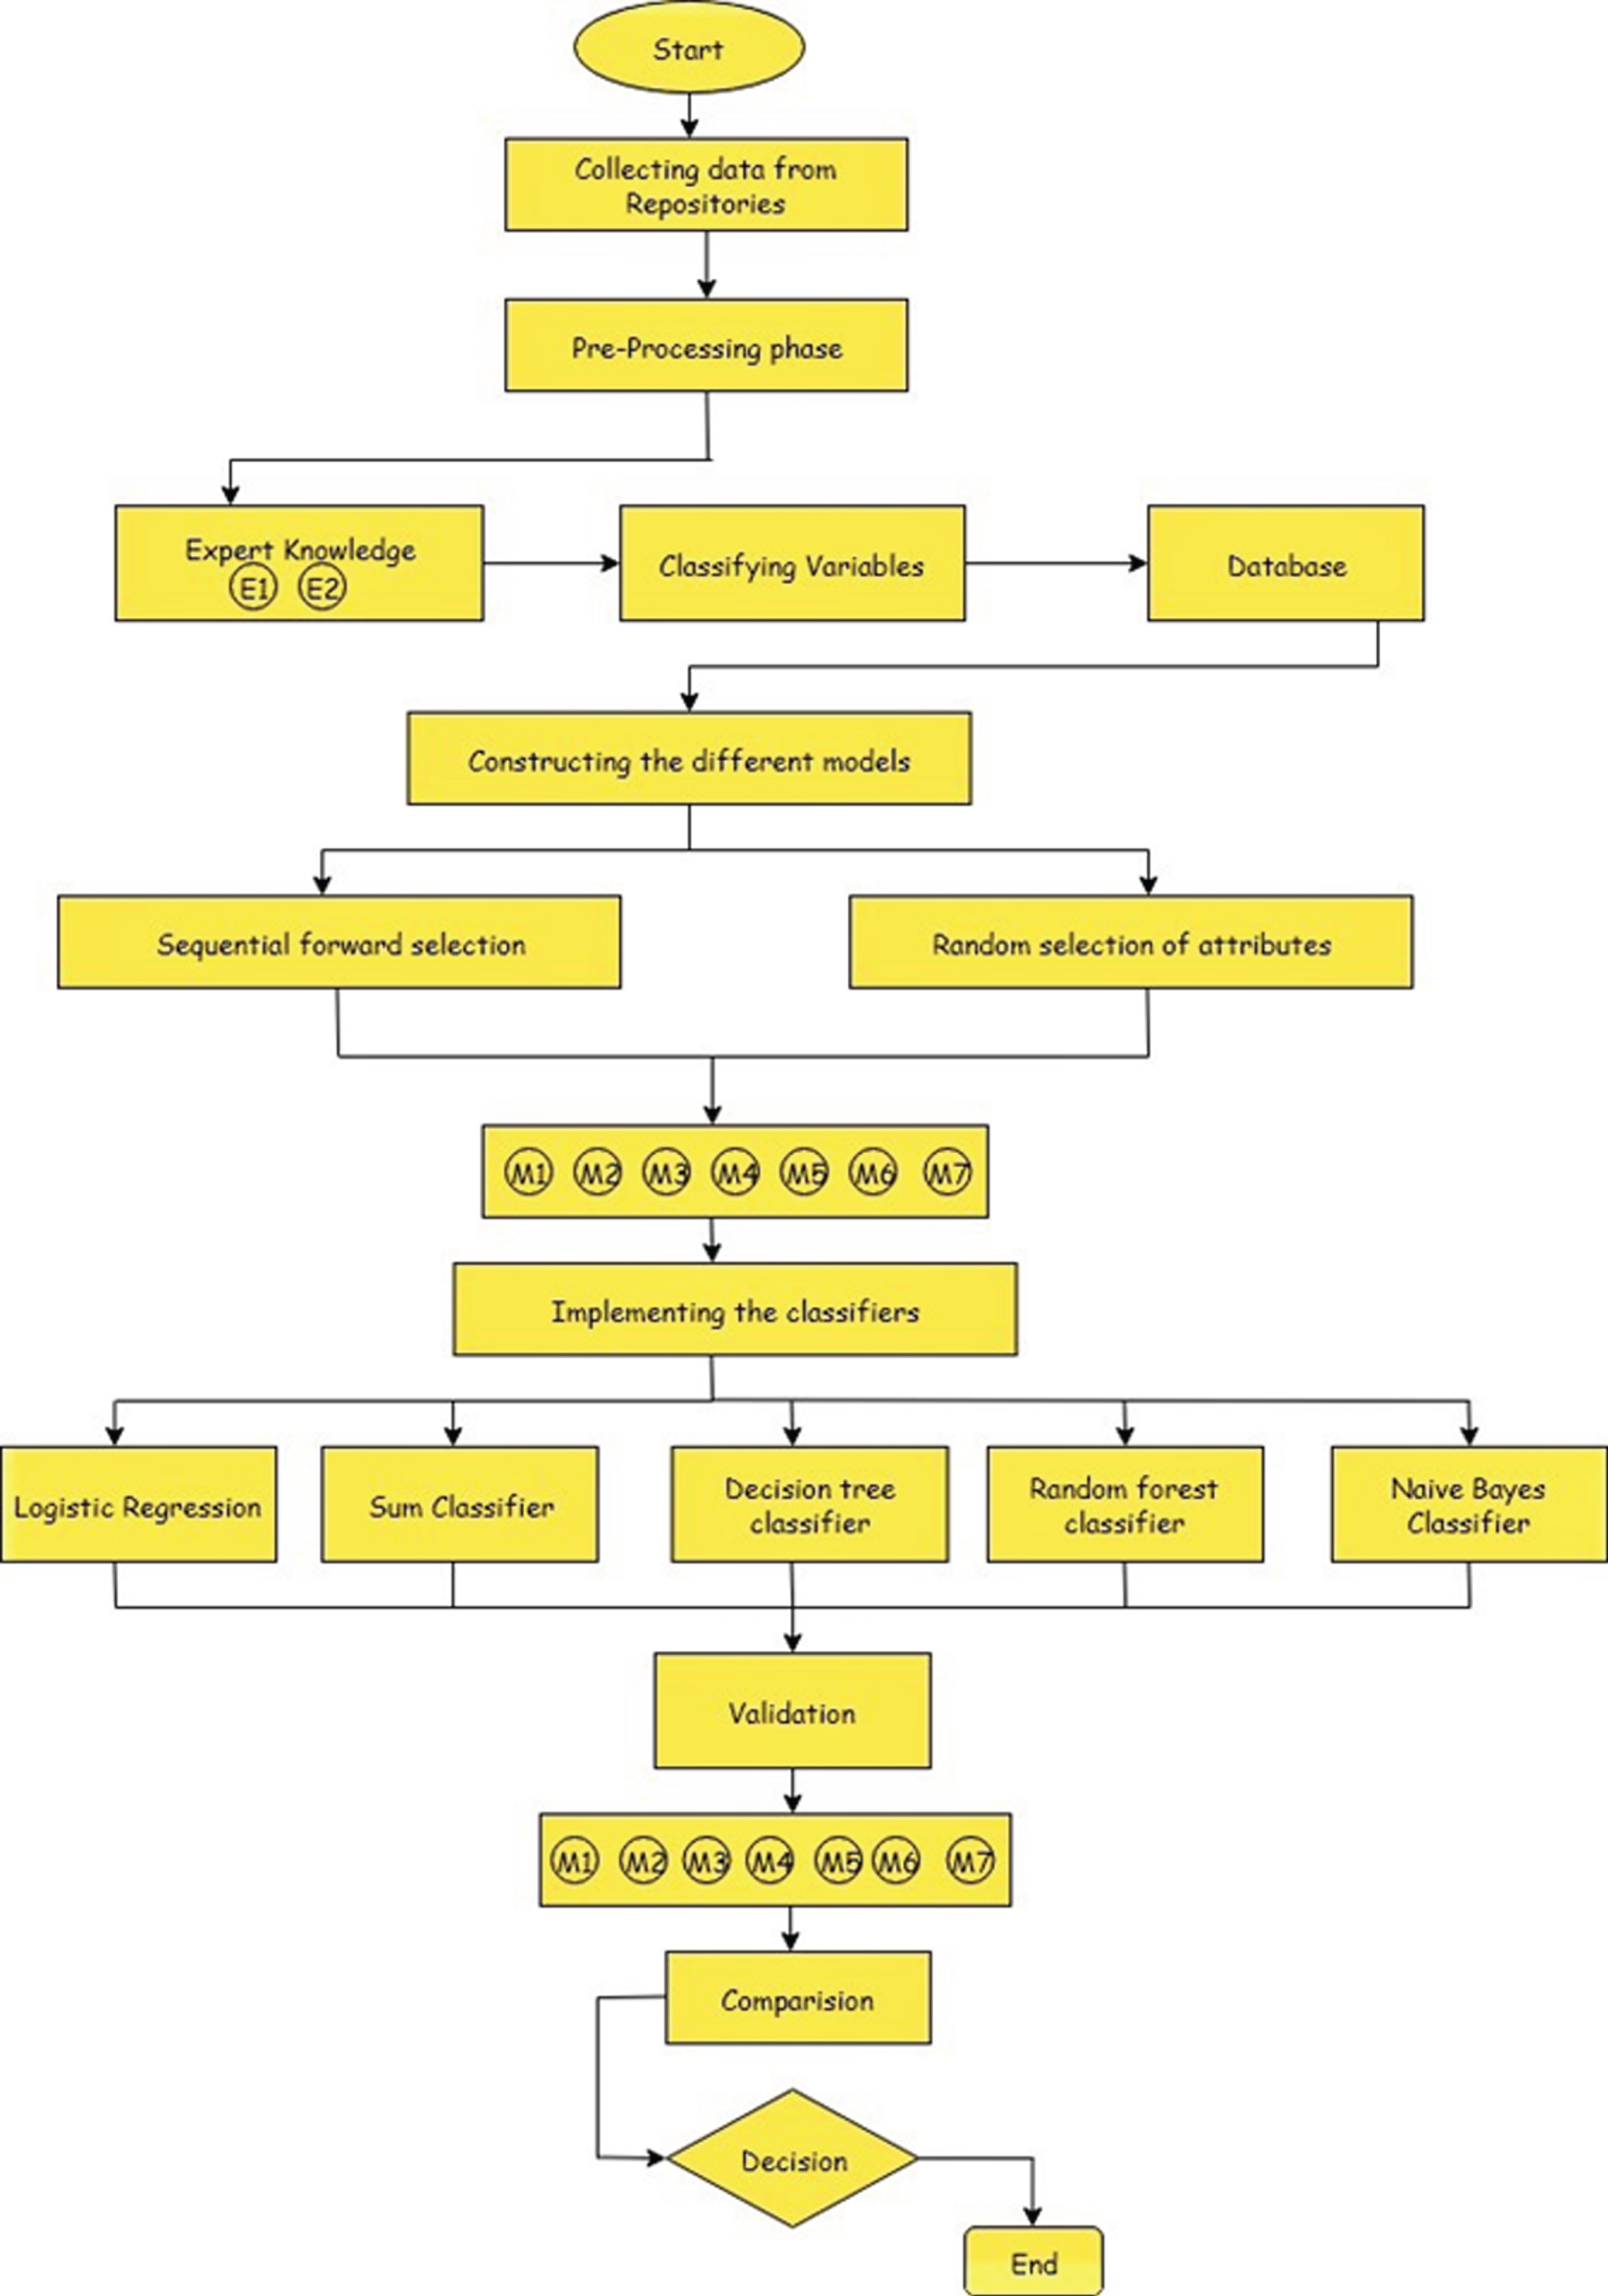
Workflow for classification of breast cancer using several methods
Added reasonable method would be to pick parameter measures that take full advantage of conditional data probability. It is nothing but the probability of the observed Y values trained on corresponding X values from the training data. Algorithm 1 is used to estimate parameters of logistic regression with gradient ascent technique with two convergent criteria. The first being a fixed iteration and the other a Prospective Parameter Change (PPC). PPC can find the determined comparative variation in the parameters involved by parameter modification. A classifying algorithm is described in Algorithm 2. But to have an easy algorithm for implementation, we can estimate the coefficients of c + 1, one against the other instead of finding the coefficients of c regressions. The weights wij associated with the jth class is modified by finding the probabilities. Nevertheless, a simplest and conventional algorithm for execution, in its place of approximating the coefficients for c regressions, we estimate the coefficients for c + 1 regressions where one result is regressed compared to the other results. The weights wji associate with the jth class is modified by computing the probabilities (as in Algorithm 1).
Results and discussion based on the proposed method -ADOBE
In this paper, we have chosen medical data based on breast cancer because it is a lethal disease in women. The experiments are carried out using Phyton. In this work, Logistic Regression is Chosen to understand the breast cancer data sets using Decision tree classifier, kNN classifier, Random Forest Algorithms, Naive Bayes. We can calculate the execution of the classifier in terms of accuracy and time taken to execute the model.
We use the 10-fold approach for cross-validation test which divides the original sets into 10 parts, one for validation and rest for training the model. The classifiers are classified based on the time taken to create a model and correctly classified accuracy. The results are given in Fig. 2 and Table 1. Figure 2 has the results measured by different classifiers. PCA method is found to give the best results outperforming all other methods. But some cases like the Naive Bayes, KNN and Subset evaluation using Best First have done better than PCA. Logistic Regression with PCA has an accuracy of 98%. When compared to the other two methods, the Correlation Attribute Evaluation method is not as good when compared with the others.

Accuracy (in %) results using different feature selection technique
Performance Comparison of Machine Learning Algorithms
The results in Table 2 and Fig. 3a&b calculate the effectiveness of classifiers concerning time, correctly and incorrectly classified instances. Figure 3c&d give accuracy and time.
Training and simulation error of machine learning algorithms

(a) correctly classified instances. (b)Incorrectly classified instances. (c) accuracy of several methods. (d) time to create models.
If fair and better efficiency is to be achieved, the simulation error is also chosen into consideration. After the model is built, its efficiency is measured based on precision. We can compare the accuracy measures based on precision, recall, TP rate and FP rate for Logical Regression, KNN, DTC, as shown in Table 3.
Performance evaluation of machine learning algorithms based on TPR, FTR, Precision, and F-Score
Finally, the results of the identified instances are studied here. Figure 4 shows us the accuracy of different classifiers with a complete and reduced dataset. When the complete dataset is used Logistic Regression, the accuracy was found to be 98% whereas the Naive Bayes returned just 92%.

Accuracy for different classifiers using complete and reduced dataset
Several data mining and machine learning methods are available to analyse medical data. Machine learning algorithms are found to be efficient in predicting early detection of breast cancer, thereby saving lives. One of the drawbacks of these methods is the inability to aptly classify the data with no errors and using comparatively less expensive classifiers for medical imaging. This paper has employed six algorithms: KNN, DTC, GNB, SVM, RFC and Logistic regression on the Wisconsin Breast Cancer datasets to categorize breast cancer into two – benign and malignant using deep feature extractors and supervised classifiers. The efficiency and effectiveness of these algorithms can be analysed concerning accuracy, speed, sensitivity and precision. Logistic regression provides an accuracy of 98% and hence provides a low error rate proving to be the best classifier available. The future directions will be implemented through real time analysis.