



Abstract
Classroom student behavior recognition has important guiding significance for the development of distance education strategies. At present, the accuracy of students’ classroom behavior recognition algorithms has problems. In order to improve the effect of distance education student status analysis, this study combines the traditional clustering analysis algorithm and the random forest algorithm to improve the traditional algorithm and combines the human skeleton model to identify students’ classroom behavior in real time. Moreover, this research combines with the needs of students’ classroom behavior recognition to build a network topology model. The error rate of feature reconstruction using spatio-temporal features is lower than that of a single feature. Through experiments, this study verifies the effectiveness of the extracted spatial angle features based on the human skeleton model. The results of algorithm performance test show that the proposed algorithm network structure is superior to the network structure of single feature extraction algorithm.
Introduction
Traditional behavior recognition methods often focus on the selection of features and hope to solve the behavior recognition problem through the similarity between features and the state transition relationship between features, so many methods based on template matching and state transition models have been produced. The method based on template matching mainly relies on robust manual feature templates and suitable distance measurement methods, such as typical motion energy templates and motion history templates [1]. The methods based on state transition models mainly rely on robust static posture states and appropriate state transition probability calculation methods, such as typical hidden Markov models and conditional random fields [2]. However, these hand-designed features only consider the one-sidedness of behavior. Therefore, slight interference will have a great impact on the behavior recognition effect, and the algorithm has obvious limitations, low robustness and poor generalization ability, and it is difficult to meet the actual use requirements. Compared with traditional machine learning methods, deep learning methods with convolutional neural networks [3] as the main framework can learn image features autonomously, thus effectively avoiding the limitations of hand-designed features. In recent years, deep learning methods have been widely used in many fields such as speech recognition, image recognition, natural language processing, and have made breakthroughs in various fields, which makes it possible for computers to quickly and accurately analyze and understand the behavior of objects. The deep learning method regards the behavior recognition problem as a data information classification problem, and it mainly conducts behavior classification by extracting space-time features and spatial local features.
The classroom is the most direct place for teachers to teach and students to learn, and most of the activities of teachers and students take place here. Therefore, the classroom is the best place to mine the data of teacher teaching and student learning and the most suitable place to study teaching and learning. By observing and recording all behaviors in the classroom, the entire learning process can be completely presented. Then, by analyzing these behaviors with descriptive text, students’ classroom learning behaviors can be effectively evaluated [3]. However, in the previous classroom observations, the teachers who observed entered the classroom and recorded the activities in the classroom through paper and pen. Although this method is intuitive and can penetrate into the classroom, it is time-consuming and labor-intensive, and cannot reproduce the classroom, and it is easy to miss important information. The emergence of video technology has helped teachers to record the activities of the whole class, which not only can reproduce the vivid teacher-student behavior in the classroom, but also provide a lot of convenience. First of all, in the past, in order to record the behaviors of teachers and students in the classroom, teachers tended to ignore the teachers’ education methods and the emotions they invested because they were busy with recording, and only focused on the process. Video technology allows teachers to record while watching videos and teachers can pause and replay videos, which allows teachers to perform more comprehensive analysis. Secondly, previous classroom observations require teachers to enter the classroom and listen to lectures on the ground, which often puts pressure on teachers and students in class, and causes teachers to be nervous to make the collected data untrue. However, recording the classroom through video can be carried out invisibly, so teachers and students can perform normally and achieve a high degree of authenticity. Finally, because the previous classroom observations have to enter the classrooms of other teachers, teachers can only observe and discuss the teaching of other teachers and learn from their experiences, but cannot view their own teachings and reflect on their own teaching methods However, after the emergence of video technology, more teachers can view their teaching situation and student learning situation through video, which helps teachers improve their professional development and improve student learning.
Related work
The literature [4] used discrete wavelet transform to select spatiotemporal salient points through low-pass and high-pass filter responses, and color and motion information. The method based on state transition model regards the behavior recognition problem as the state traversal problem. This method recognizes the target behavior by constructing a classifier based on a graph model, traversing all the different static posture states, and calculating the transition probability between each state and the joint probability of the entire motion sequence. Typical state transition model methods include hidden Markov model and its improved model, dynamic Bayesian network, conditional random field and its improved model. The literature [5] introduced Hidden Markov Model to solve the problem of behavior recognition, and the algorithm recognized specific behavior through human contour features. The literature [6] proposed an improved hierarchical hidden Markov model to effectively identify object motion trajectories and object behaviors. The literature [7] modeled shape movement and deformation, and the algorithm used a continuous hidden Markov model to capture abnormal activities in shapes and interactive objects.
The literature [8] used scale-invariant features to characterize the contour information of objects, and used random forest algorithm to search useful local regions from human contour information for behavior recognition. The literature [9] extracted the features of various parts of the human body to obtain better accuracy of behavior recognition. The literature [10] built a graph model based on the key point information of the human body, and used the graph model to express the interdependence between behaviors, scenes, and objects, and recognizes the behavior of objects through template matching. The literature [11] used a circular orientation histogram to represent human posture features and used linear discriminant analysis and support vector machines to perform behavior classification. The literature [12] extracted candidate frames of objects and objects, used the bag-of-words method to calculate features, and applied multi-instance learning methods to perform behavior recognition. The literature [13] used Canny edge detector to extract the rough contour of the human body, obtained the feature center of the behavior through the spectral clustering algorithm, and used the k-nearest neighbor method to identify the behavior category in the testing stage. The literature [14] proposed three advanced features: full-image features, human pose features, and human interaction features, and linearly combined the three advanced features through feature fusion, and conducted behavior classification through support vector machines. The behavior recognition methods based on high-level features / low-level features are effective in recognizing specific behaviors. However, in real life, the behavior of the object is rich and diverse, and there are subtle changes between the same behavior, so the single feature expression ability is limited and not enough to cover all behaviors. Therefore, it has certain limitations in practical application, and the effect is not ideal.
The literature [15] proposed a motion energy map and a motion history map based on a time-series template, which respectively represent spatial location information and temporal succession information where behavior occurs. The algorithm uses Mahalanobis Distance to measure the similarity between the sequence to be tested and the template, with translation and scale invariance. Reference [16] proposes the Mean Motion Shape (MMS) based on the contour of the human body and an Average Motion Energy (AME) based on the motion foreground based on the region of interest (ROI). The template can effectively encode the structural characteristics of the behavior, save storage space and have lower computational complexity. Furthermore, the algorithm uses procrustes distance and Mahalanobis distance to measure the similarity between the sequence to be tested and the template. The literature [17] used orthogonal basis functions to model time-series motion trajectories, and proposed a Markov classifier to detect abnormal trajectories and then distinguish abnormal activities. The literature [18] used the three-dimensional space-time contour volume and the properties of the Poisson equation solution to construct the space-time features of behavior recognition. The literature [19] regarded the problem of behavior recognition as the problem of space-time volume matching and extracted space-time features automatically in a data-driven way under unsupervised conditions. The literature [20] proposed the spatio-temporal features of local interest regions, extended the Harris corner detection algorithm to the space domain, and obtained the movement trajectory of the interest regions for behavior recognition. The literature [21] proposed a hidden Markov model based on dynamic Bayesian network to simulate object group activities and identify the behavior of specific groups in noisy outdoor scenes. The literature [22] proposed a feature extraction method based on kernel principal component analysis and a motion modeling method based on factor-conditional random fields to improve joint accuracy through information sharing. Moreover, the algorithm is robust. The literature [23–25] proposed a feature extraction method based on the context information of the human silhouette morphology and conducted behavior classification through complementary discriminant condition random field and maximum entropy Markov model.
Whether it is based on the template matching method or the state transition model method, the features used are mostly manually designed features. The method based on manual features can identify the behavior in a specific scene. However, in real life, the scene is changeable, and the difference in environment leads to a low accuracy of the algorithm, and the algorithm is not robust to scene diversity. At the same time, the methods based on template matching and based on the state transition model are too complex and have poor adaptability. When the object is in an environment with a complex background and partial occlusion, the performance of the algorithm is greatly reduced, the algorithm is easily affected by noise, and the generalization ability is poor. Therefore, the method based on template matching / state transition model needs to be strengthened.
Spatio-temporal feature design
This topic uses two methods of dividing bone points, as shown in Fig. 1:

Two ways to divide bones.
In Fig. 1 (a), the bone points in each ellipse frame are used as a group to calculate the time series characteristics. In Fig. 1 (b), the bone points are divided into three layers from the outside to the inside, and the time series characteristics are calculated by taking 5 bone points in each layer as a group. The advantage of Fig. 1 (a) is that it is easy to distinguish the changes of a certain part of the body, but its disadvantage is that it ignores the changes between the internal bone points. The advantage of Fig. 1(b) is that it fully considers the interaction between parts of the body, but it is not easy to find the specific parts of changes (left arm, right arm, left leg, right leg, etc.). Based on the above analysis, it can be seen that although it is not easy to find the specific part of the change in Fig. 1 (b), it makes full use of the location information of each bone point and takes into account the interaction between the various parts of the body. Therefore, in the following experiments, the time series features are calculated based on the grouping shown in Fig. 1 (b).
This paper designs and uses the combination of time series features and spatial relative position features to complete the description of motion.
First, in the time series feature, it is proposed to use the displacement x, velocity v and acceleration feature a of the bone point to complete the description of the time series feature. The calculation formula is as follows:
Among them, p represents the position information (x, y, z) of the three-dimensional space of the skeleton point, f represents the current frame in the skeleton sequence, c represents the total number of frames in an action sequence, i represents a bone point in the human body, and Δt represents the difference in frame numbers between f - 1 and f + 1.
In this paper, T1, T2 and T3 are used to concatenate three time series features, which are expressed using the following formula:
In the feature of relative position in space, the method of dividing body parts is the method of dividing 15 bones of the human body to the body parts, and the 15 bone points of the human body are:
The calculation method of the relative position between the bone point and the reference point is as follows:
Among them,
For a single feature, similar actions may appear the same in feature performance, that is, the distance between different types of actions is small, which is not conducive to distinguishing actions. For example, in the two movements of walking and running, the displacement characteristics of the joint points of the knee and ankle may be similar, and it is easy to confuse the two movements in the process of motion recognition. Combining multiple features, increasing the distance between different types of actions, and reducing the intra-class distance of similar actions are beneficial to improve the accuracy of action recognition.
The VLAD algorithm, proposed by Jégou H, Douze M, Schmid C and others in 2016, is used for image retrieval and feature encoding. In this paper, VLAD is used to unify the length of the feature sequence. Due to the different lengths of 3D skeletal motion sequences, the lengths of the extracted spatiotemporal feature sequences are different. In order to build a unified network model to complete the action recognition, it is necessary to encode the feature data and unify the feature sequence length. Compared with traditional feature coding methods such as BOF (Bag of Feature) and Fisher, VLAD (Vector of Locally Aggregated Descriptors) algorithm takes all samples in the same class into consideration, uses the sum of the residuals from all samples to the center of the class to complete the feature coding, and makes full use of the information of each sample to describe the feature more carefully
For any time series feature and spatial relative position feature, there are the following expressions:
Among them, n ={ 1, 2, 3 }, m ={ 1, 2, 3, 4 },
The specific steps are as follows:
(1) For each feature sequence, the sequence is converted into frames, and for all frames in the database, U times k-means algorithm is used, and 24 cluster centers are obtained each time;
(2) For each type of feature data, the Euclidean distance from the frame to 24 cluster centers is calculated and divided into the categories corresponding to the cluster center with the smallest Euclidean distance to form 24 clusters. According to formulas (9) and (10), the time cluster and space cluster are calculated;
(3) In each cluster, according to formulas (11) and (12), the residual between the features contained in each frame of the cluster and the cluster center is calculated, and the sum of all residuals in the cluster is calculated;
(4) The sum of the residuals of all features is cascaded into feature vectors representing actions. The use of the residual sum fully considers the impact of each frame on motion recognition and unifies the sequence length;
At this time, for each action, it is represented by U × 23 vectors of the same dimension, and each vector contains 3 time series features and 4 spatial relative position features. However, there is a large amount of redundant data in the feature data, which affects the action recognition effect. Therefore, it is necessary to reduce the dimension of the feature data. In this paper, the method of contrast divergence is used for data dimensionality reduction, which will be introduced in detail in the next section.
In order to reduce redundant feature data, improve the accuracy of motion recognition, and reduce the amount of calculation, this paper uses the contrast divergence algorithm to complete the dimensionality reduction of bone feature data while training STTS-DBNs. The network topology model is shown in Fig. 3.
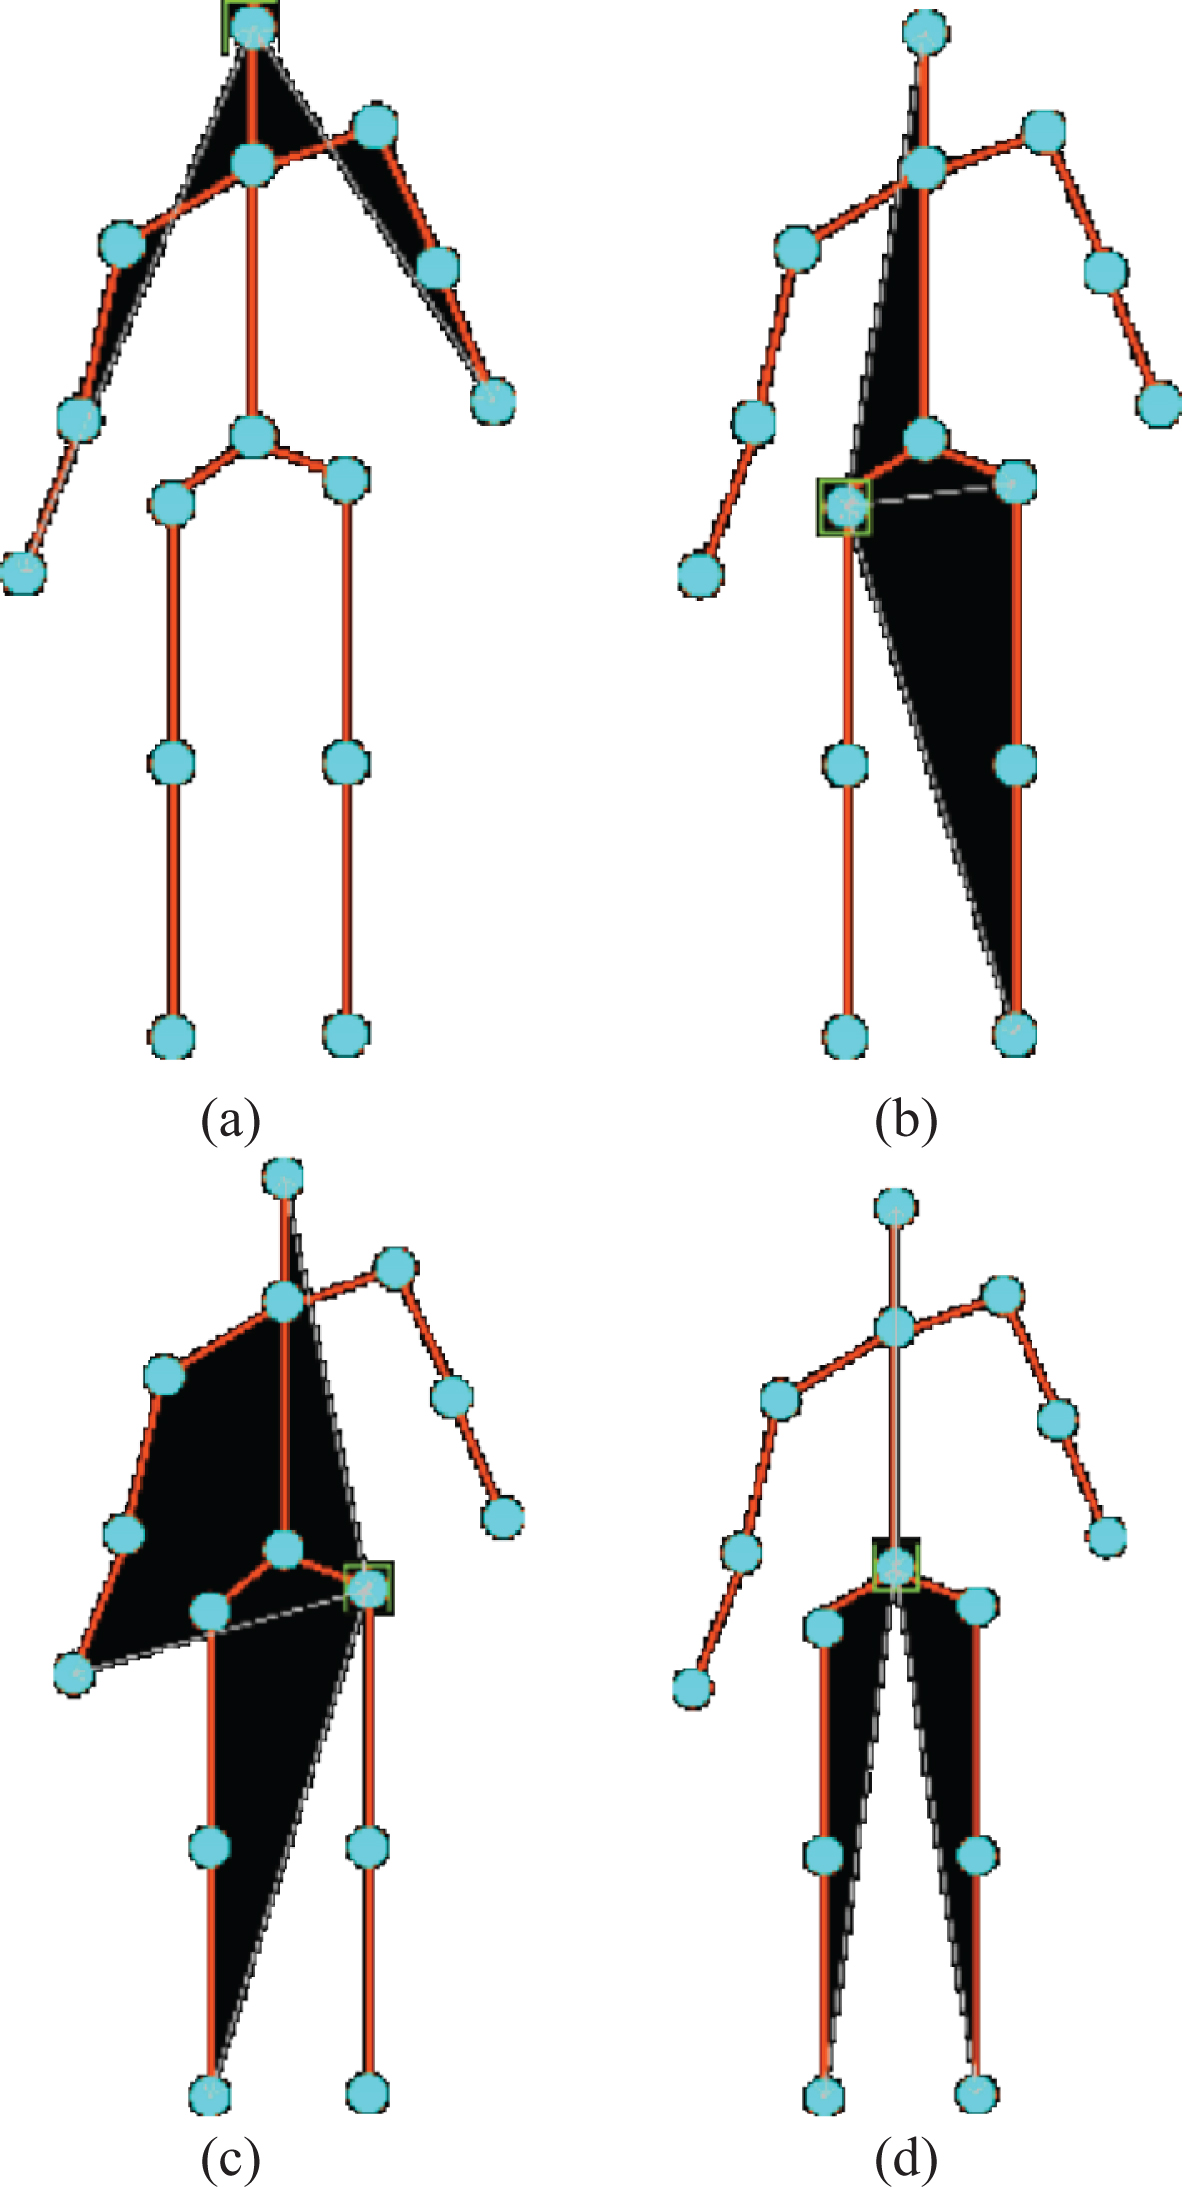
The spatial relative position features of 4 kinds of bone points and reference points In (a), Head is used as the reference point, and the bone point has: Right Hand, Left Hand; In (b), Left Hip is used as the reference point, and the bone point has: Head, Right Hand, Right Foot; In (c), Right Hip is used as the reference point, and the bone point has: Head Left Hand, Left Foot; In (c), Spine is used as the reference point, and the bone point has: Head, Left Hand, Right Hand.
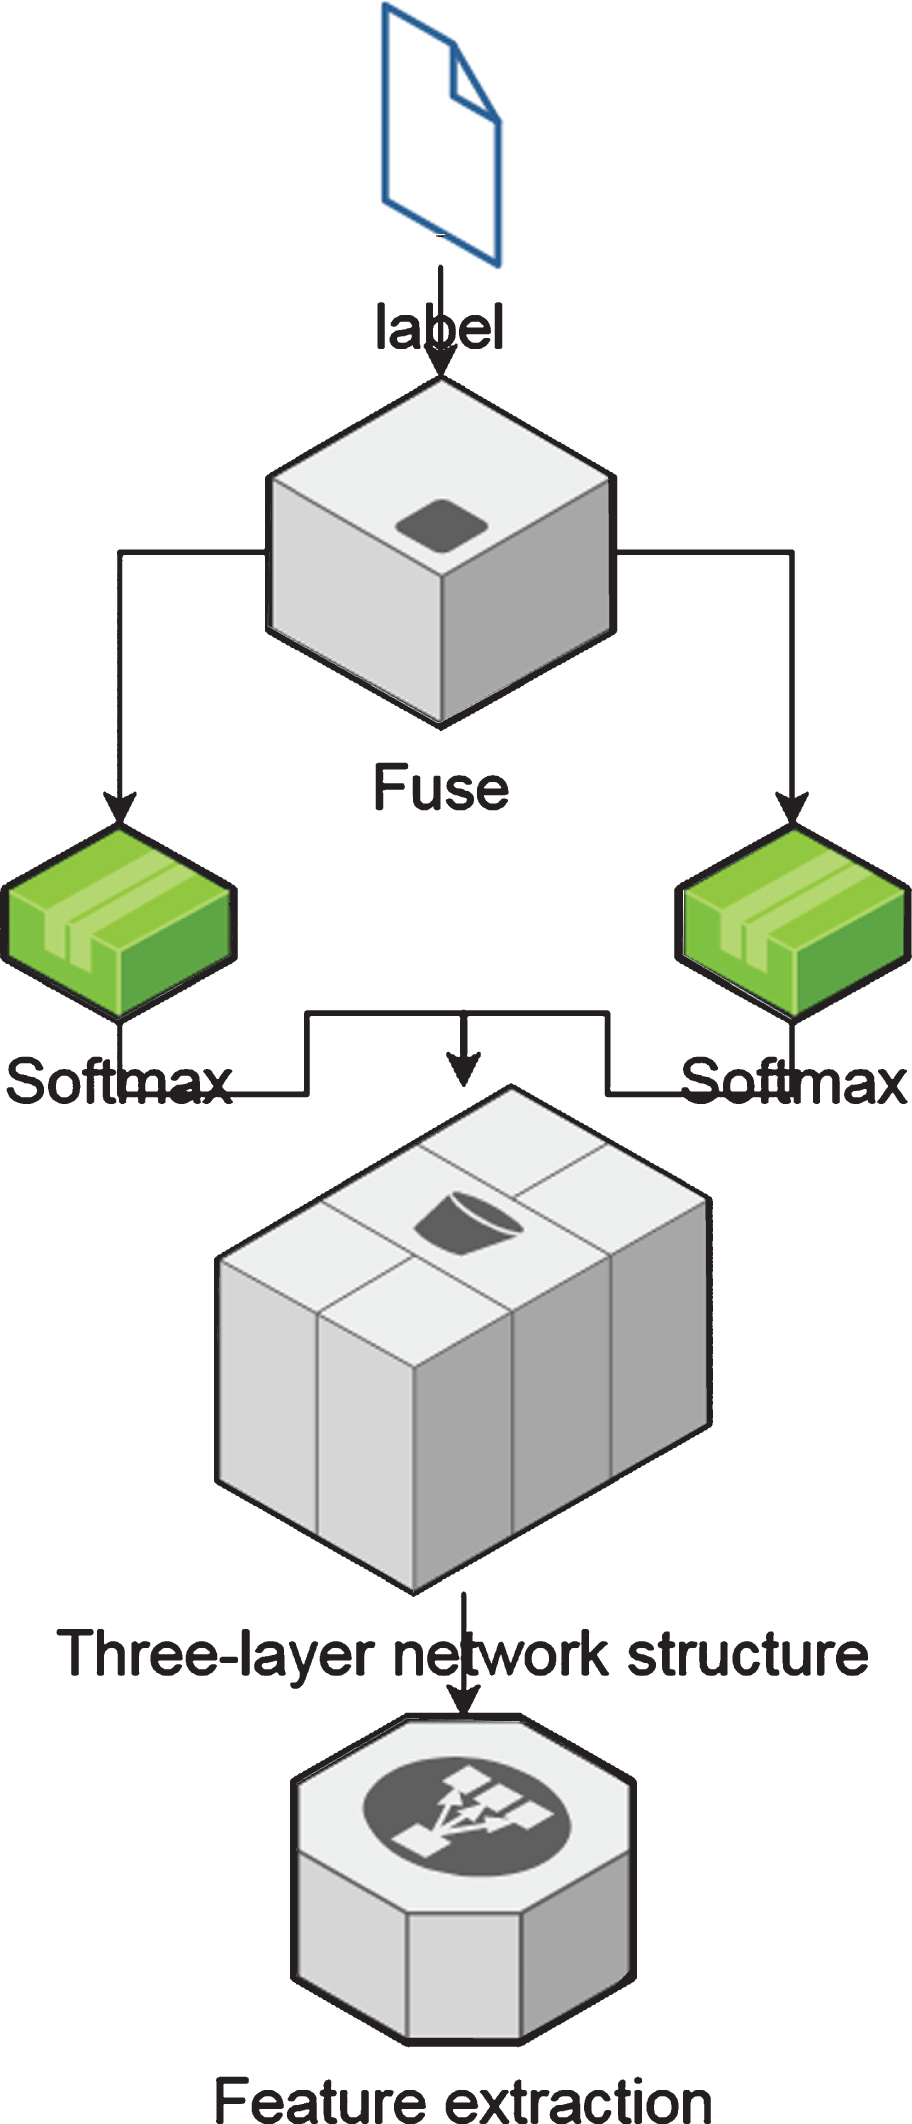
Spatial dual-stream deep belief network model.
The bone sequence data is input into the network model, and the time series feature and spatial relative position feature are extracted respectively. The role of each layer is as follows:
VLAD layer: It is used to unify the length of feature data and facilitate action recognition;
Fully connected layer: In time series features, it cascades displacement, velocity and acceleration features; in space relative position features, it cascades four relative position features.
RBM: It completes the simulation of the original feature distribution through the contrast divergence algorithm, reduces redundant features, and extracts high-level feature representations.
Softmax: It calculates the classification of different features for the same action, and outputs the result to the Fuse layer.
Fuse layer: It calculates the weight of actions in each feature in each stream according to the results passed by Softmax.
When multi-stream information fusion is performed, the mutual exchange of information streams should be limited, that is, the fusion of final features or predictions during training should be avoided. To achieve this, each shunt should have its own Softmax and loss layers. In the Fuse layer, the output value of Softmax is regarded as a neuron in the network model, and the Softmax function is still used as the loss function of the Fuse layer to obtain the weight of each feature for this type of action. The specific training process of the network is as follows.
First, the weight matrix W connecting the visible layer and the hidden layer in the initialized network model, and the sample data is given to the first layer of the visible layer. After that, the probability of activation of each hidden layer unit is calculated by formula (13), the hidden layer probability distribution is calculated by formula (14), and the second layer visible layer probability distribution is calculated by formula (15).
Using the contrast divergence method to reduce the dimensionality of spatio-temporal feature data is a simulation of the distribution of the original feature data. In order to ensure that the data after dimensionality reduction maintains the distribution of sample data, the following formula is used to calculate the loss between the explicit layer and the hidden layer, and the initialization weights are updated.
The gradient update formula is as follows:
In the above formula, W is the weight initialization matrix, λ is the learning rate, and
This study first completed the design of spatiotemporal features based on 3D bone sequences, and designed spatiotemporal features based on bone sequences. Then, in response to the problem of inconsistent lengths of action sequences, this study proposes to use the VLAD algorithm to encode feature data uniformly. Finally, this study proposes to use the contrast divergence algorithm to complete the dimensionality reduction of feature data and introduces the topology and network details of the spatiotemporal dual-stream deep belief network. After obtaining the dimension reduction matrix W, it is still necessary to use a supervised algorithm to fine-tune W according to the sample label through the random gradient descent method to further improve the accuracy of action recognition.
To further describe the distribution of bone points in the same frame, this study designs a spatial angle feature based on quaternions and uses quaternions 1 real part and 3 imaginary parts to describe the spatial bone point rotation. Based on the obtained bone point position information, a coordinate system with the hip node as the origin is established, as shown in Fig. 4. After that, this study uses vectors to represent each bone of the human body, calculates the angle between the specified bones in each frame through the vector, and uses quaternion to represent the angle between the two vectors.
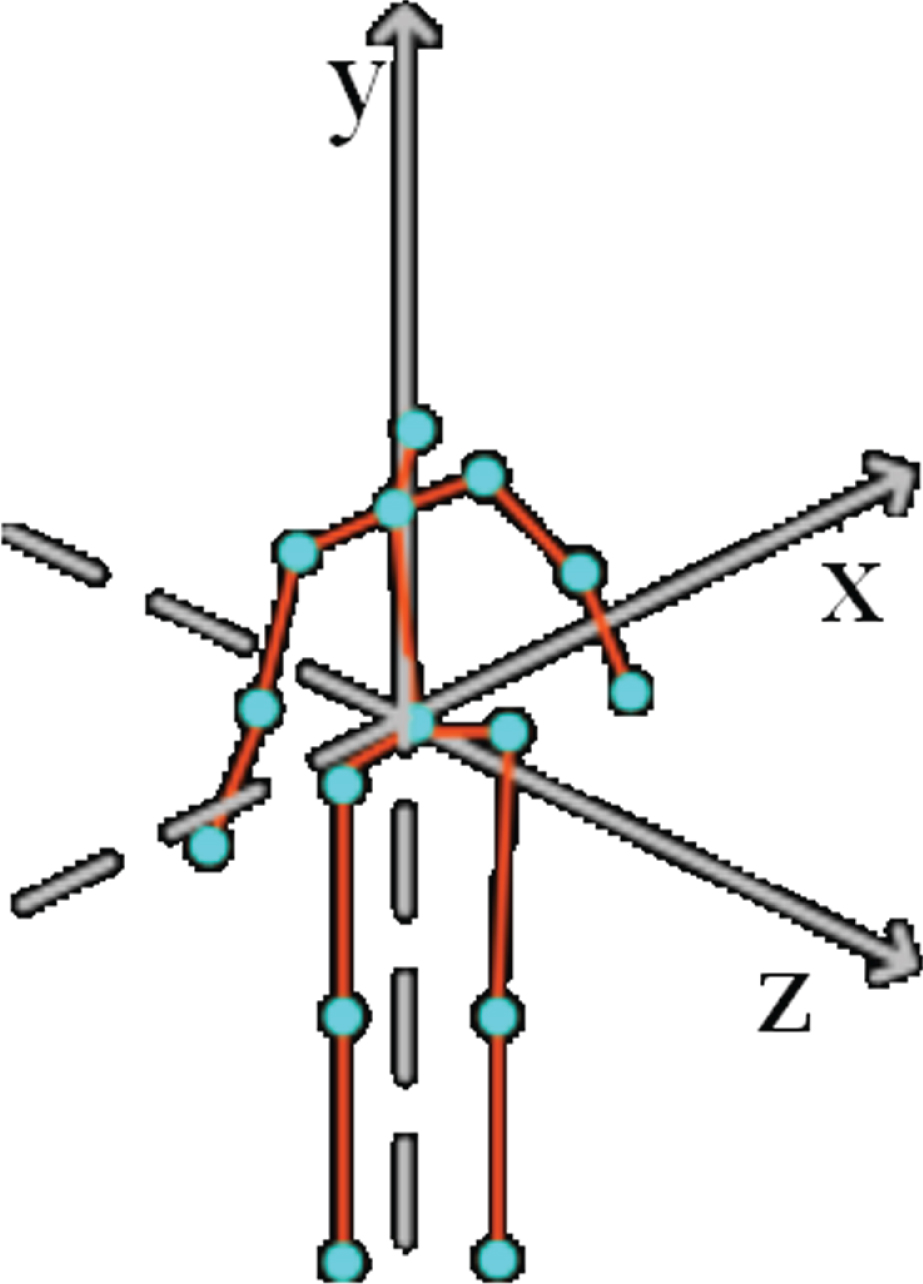
Coordinate system with hip node as origin.
The steps to calculate the spatial angle characteristics are as follows:
(1) The bone data is collected and two vectors v1, v2 are obtained. Furthermore, each vector contains (x, y, z) position information;
(2) The normal vector of the plane formed by the two vectors is calculated as follows:
(3) The rotation angle between the two vectors is calculated as follows:
(4) According to u, θ, the corresponding coefficient of quaternion is calculated as follows (q0 is the real part of quaternion):
Observation in class can be said to be the “highlight” of classroom observation. When classroom observation wants to research, analyze, evaluate, and diagnose the observed teaching behavior, learning behavior, and other objects, it must be based on “evidence”. Moreover, the “evidence” cannot be obtained without relying on modern equipment such as video recorders, video cameras, and tablet computers that can record the entire event.
This research experiment data set is a recorded video of daily teaching in a distance education system. In this experiment, in order to measure the effectiveness of the algorithm in the classroom student behavior recognition task, in the testing phase, for each video, this study predicts the category of all its subsequences and compares it with the tag value to count the correct number of categories as the recognition rate of the video. Finally, the accuracy of all videos is averaged as the final recognition accuracy.
In this paper, we train the original image feature extraction network and the morphological embedded feature extraction network. For the original image feature extraction network, the VGGNet-16 network model pre-trained on the ImageNet database is used to fine-tune the daily behavior construction database in classroom teaching. The input image size of the model is 224 * 224 pixels. For the morphological embedded feature extraction network, Xavier is used to initialize the weights of all layers, and the input image size of the model is 112 * 112 pixels. Both networks are trained using the mini-batch training method, and batch_size = 32 is set, and the network weights are updated using the Stochastic Gradient Descent (SGD) method. The initial learning rate of the network is set to 0.0001. After 5K iterations, the learning rate is attenuated by 0.1 times, and then the learning rate will remain unchanged until the model converges after 20K iterations. Based on the training of the original image feature extraction network and the morphological embedded feature extraction network, the feature fusion network model is trained, which is an end-to-end model. Moreover, the parameters of the two feature extraction networks are loaded as pre-trained models. The network also uses mini-batch training for training, set batch_size = 32, and use SGD to update the network weights. First, the pre-trained model is loaded, and the unpre-trained part is initialized at the same time, the initial learning rate is set to 0.000001, and the model obtained after 90K iterations is used as the pre-trained model of the fusion model. Subsequently, the initial learning rate of the network is set to 0.0001, and the learning rate is attenuated by 0.1 times after 5K iterations, and then the learning rate will remain unchanged until the model converges after 20K iterations.
In the experimental verification of human skeleton extraction and target region extraction algorithms, four models are compared: VGGNet-16, the experimental results of existing deep learning methods on the behavior recognition database; VGGNet-16 (crop), the experimental results obtained by using the cropped image based on the VGGNet-16 model; the algorithm of this paper, the experimental results obtained by using the concatenation feature fusion method to stitch the original image features and the morphological embedded features; the algorithm (crop) of this paper; experimental results obtained by training the network using the cropped target area image and human skeleton image based on the algorithm in this paper. The experimental results are shown in Table 1 and Fig. 5. The experimental results show that by cropping the image, the existing deep learning model VGGNet-16 and the algorithm in this paper have been improved. It is proved that effective context information can slightly improve the performance of the algorithm, and image cropping can exclude as much background information as possible and retain certain context information. At the same time, the accuracy of the algorithm in this paper is higher than that of the existing VGGNet-16 deep learning model. It is proved that the idea of fusing human skeleton information is effective, and the fusion model can obtain richer and more representative features, which can improve the performance of the algorithm.
The effect of image cropping on the performance of this algorithm
The effect of image cropping on the performance of this algorithm
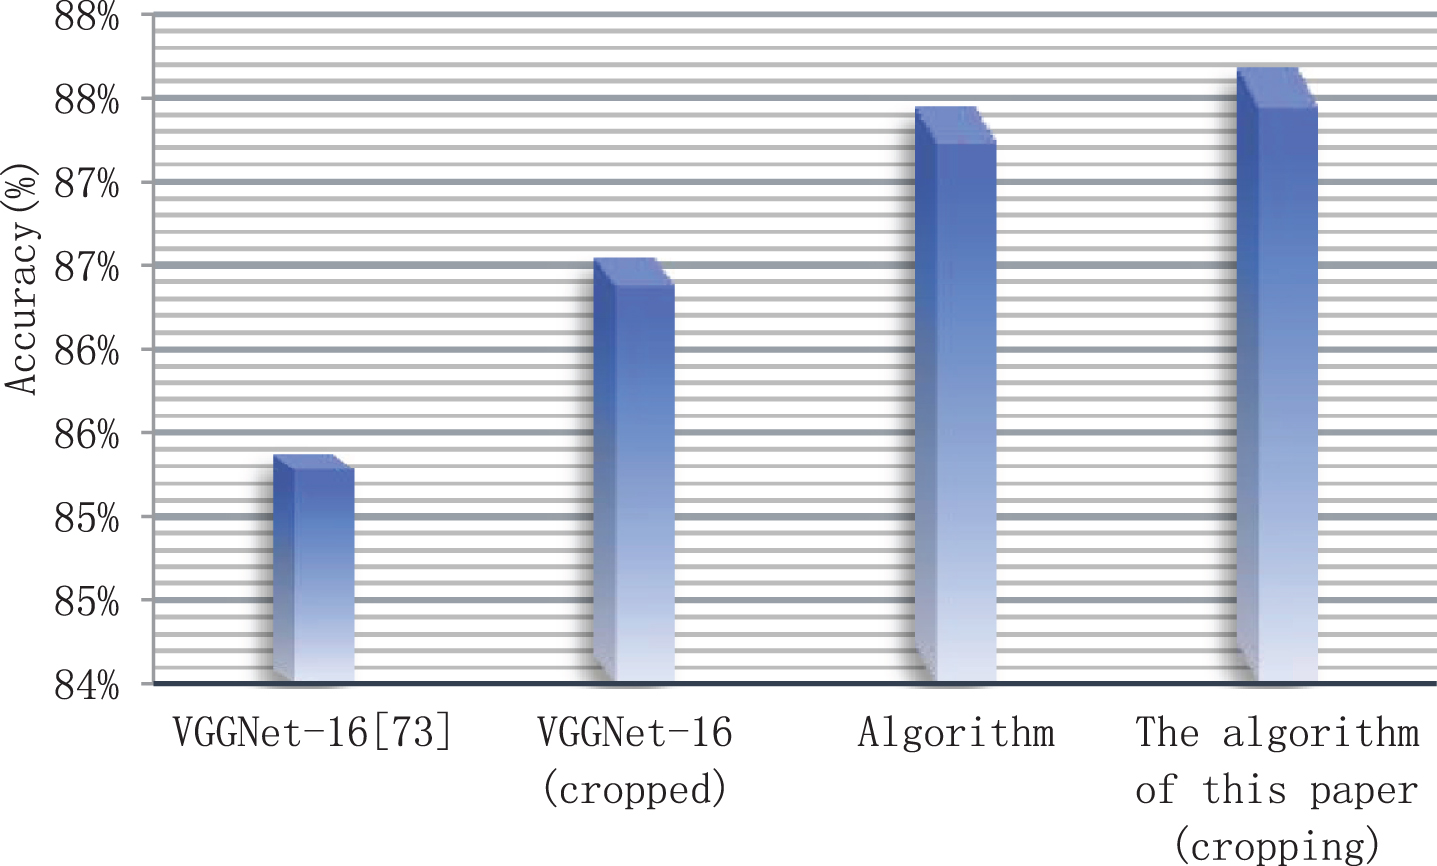
Statistical diagram of the effect of image cropping on the performance of the algorithm in this paper.
In the experimental verification of the morphological embedded feature extraction network, three models are compared: VGGNet-16 (skeleton), that is, the model obtained by training the human skeleton image data of the existing deep learning network; morphological embedded feature extraction network; morphological embedded feature extraction network (SE) further uses SEBlock to re-weight features. The experimental results are shown in Table 2 and Fig. 6.
Statistical table of performance of morphological embedded feature extraction network algorithm
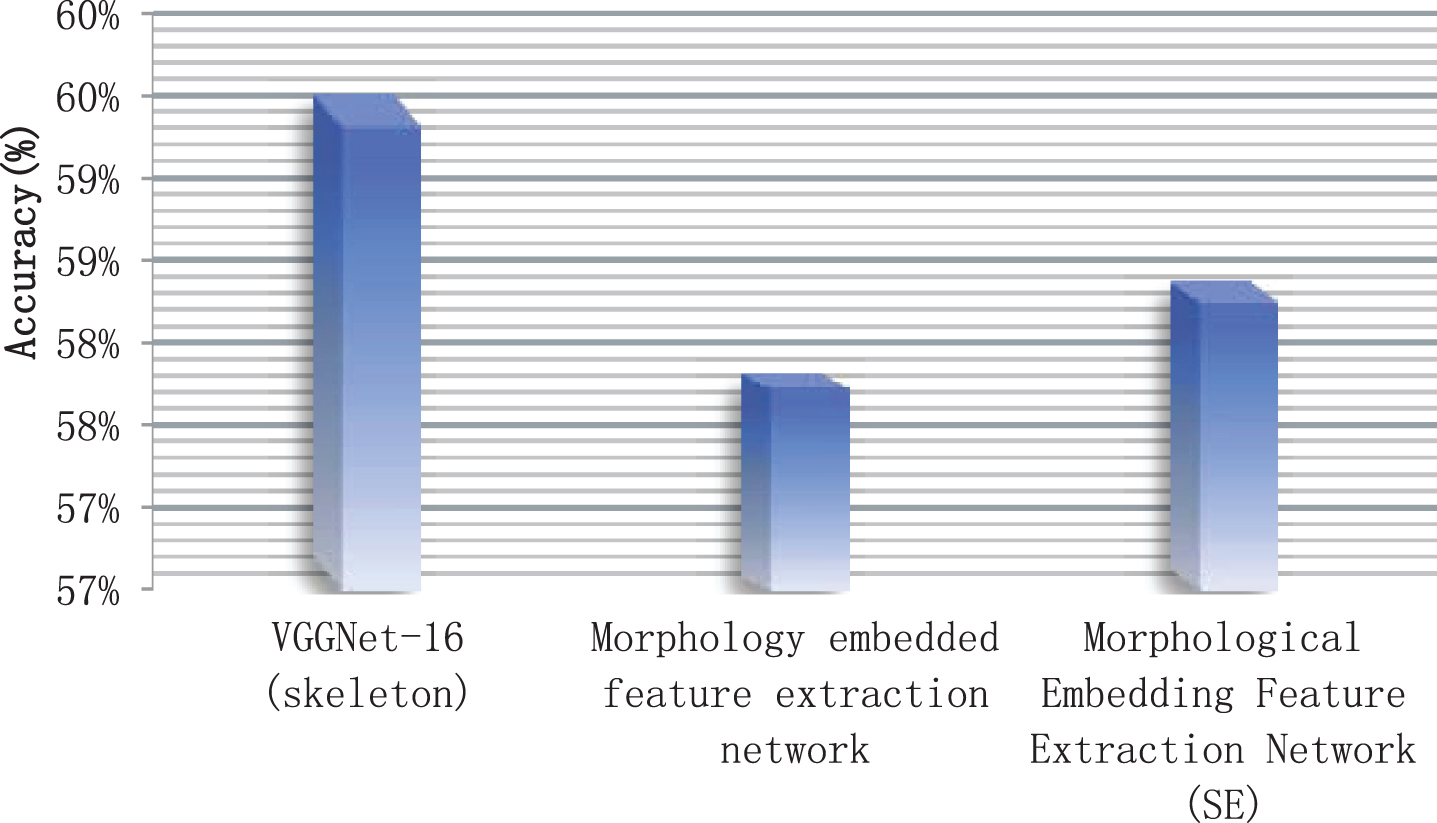
Statistical diagram of performance of morphological embedded feature extraction network algorithm.
The experimental results show that the accuracy of the morphological embedded feature extraction network is slightly lower than that of VGGNet-16 (skeleton). However, its network model, parameter amount, and calculation amount are small, and it does not require a pre-trained model to initialize parameters, so it has certain advantages. Among them, the main reason for the reduction in network performance is the reduction in the resolution of the input image, the reduction in the number of fully connected layers and the reduction in the number of neurons in the fully connected layer. In the case of using SEBlock, the network obtains higher accuracy with a small amount of parameter added, so the SEBlock module is also effective.
Next, this research system is applied to practice. Through the collected video and picture information, a test group is constructed, a total of 50 groups are constructed, and these data are identified. The statistical data identified by the algorithm of this study is drawn into a statistical graph. First, the recognition accuracy is counted, and the results are shown in Table 3 and Fig. 7.
Statistical table of algorithm recognition accuracy
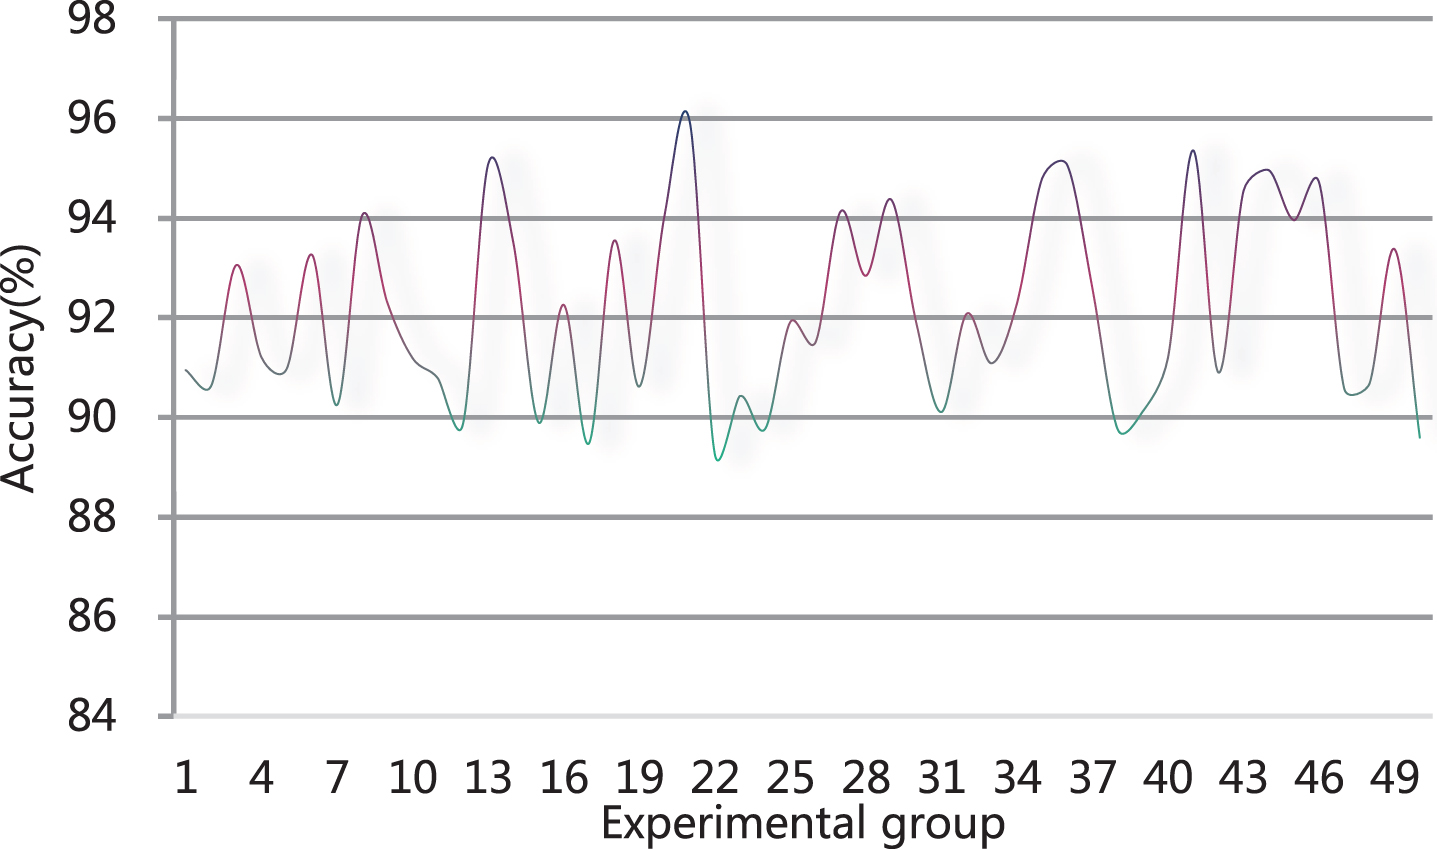
Statistical diagram of algorithm recognition accuracy.
It can be seen from Table 3 and Fig. 7 that the algorithm of this study performs well in classroom student behavior recognition. Figure 7 shows that the test results of most groups are above 90%, so this research model has a good classroom behavior recognition effect.
The algorithm of this research model is improved on the basis of cluster analysis combined with the random forest algorithm, so the performance of this research algorithm and cluster analysis algorithm in classroom student behavior recognition is compared.
As shown in Fig. 8 and Table 4, the recognition accuracy of the algorithm in this study is nearly 20 percentage points higher than the cluster analysis algorithm. It can be seen that this research model has certain effects, and this research model can be applied to students’ classroom behavior recognition to build an intelligent teaching system.

Comparison statistical diagram of algorithm recognition accuracy (%).
Comparison statistical table of algorithm recognition accuracy (%)
Human behavior recognition has a very wide range of applications in many fields, so human behavior recognition has always been a research direction that researchers are keen on. With the development of deep learning algorithms and 3D technology, the combination of deep learning algorithms and 3D technology for human behavior recognition is an important research content in this field in recent years. This topic proposes an action data collection method and applies it to classroom student behavior recognition to construct a behavior recognition network framework. In this framework, the time series features based on displacement, velocity and acceleration and the spatial features based on the relative position of space are designed. Moreover, this study improves the clustering analysis algorithm and completes the unification of the bone sequence length, which is convenient for subsequent motion recognition. Finally, the contrast divergence algorithm is used in the training of network models, and the superiority of the algorithm is verified on the commonly used behavior recognition database and collected data. Through experiments, the effectiveness of the extracted spatial angle features based on the human skeleton model is verified. Moreover, the results show that the improved algorithm in this paper is superior to the network structure of single feature extraction algorithm.