
Abstract
Because sports video has a wide audience and huge market potential, research with the main goal of sports video content analysis has become a hot spot in the field of video analysis. Although after more than ten years of hard work, the current achievements are still far from the expectations of people. In this study, the sports video is taken as the analysis object, and for the shortcoming that when the VIRE positioning algorithm uses linear interpolation to calculate the virtual label, the error between the obtained RSSI value and the actual value is larger, this paper uses quadratic interpolation to improve it. Moreover, this study explores the threshold setting of the algorithm and proposes a threshold setting method, so that the adjacent map thresholds of each reader are not necessarily consistent, and the resulting adjacent label map is more accurate. In addition, this experiment uses the algorithm model designed in this study combined with the qualysis infrared capture system to capture the tennis serve. Finally, this study conducts model algorithm performance analysis through comparative analysis. The research results show that the algorithm of this study has certain practical effects.
Introduction
In modern life, sports video is an important video that is popular among the majority of viewers, and it has a large proportion in existing TV programs and the Internet. With the continuous improvement of people’s quality of life and the rapid development of technology, the audience’s requirements for sports video are also increasing [1]. For example, in watching sports games, this passive and flat viewing method cannot meet the requirements of TV viewers. The broadcasters need to add various visual effects to meet the visual requirements of the audience [2]. In the analysis of game research, it is necessary to extract relevant data from the game video to assist the coach in conducting tactical research. In terms of commercial applications, broadcasters also need to more fully explore the commercial value of sports broadcasts. Video data analysis and fusion technology [3] can process the game video in real time for different needs, in order to meet the requirements of all parties facing the game video. Video image processing technology provides a broad application prospect for TV broadcast. In the face of traditional TV live broadcast passive, flat, relatively boring and simple communication methods, it is extremely urgent to develop and adopt video fusion technology. There are two main applications of video convergence technology in live TV broadcast: virtual information prompts and virtual advertisements. On the one hand, it makes it easier for viewers to enjoy the game. On the other hand, it brings rich returns to sports producers [4].
Sports events currently have a large audience around the world, and the research on sports video has attracted the attention of academic and industrial circles due to its wide application prospects. In recent years, the rapid development of electronic information and network technology has also caused great impact on the field of video analysis. People’s viewing needs for sports events have shifted from direct viewing and simple browsing to diversification. In order to meet the audience’s viewing needs, video information service providers develop video technologies such as video content editing, program customization services, and specific event detection. These services require semantic analysis and understanding of sports videos. Of course, like general video processing, sports video analysis also has problems such as the separation between the underlying features and the high-level semantics, but it also has its own special features: Due to the sports video positioning and sports events, the corresponding video events can be determined through the rules of the game, which means that the definition of advanced semantic events in sports videos is relatively clear.
Related work
In a virtual advertising system, the seamless integration between virtual objects and real scenes is critical and is the key to determining the performance of a video fusion system. The seamless integration of virtual information in a video fusion system is to ensure that the spatial perception and understanding obtained by the user in the virtual environment are consistent, that is, to solve the “visual consistency” problem between the real scene and the virtual object. Feature mark detection and scene recognition technology is a very key core technology in video fusion systems, which is a solution to maintain the geometric consistency of video fusion. Feature detection is to detect the feature lines in the video sequence under the condition of still camera, abstract the feature points of the site, establish the site feature model, and quickly track the feature points identified under the static camera condition under scene switching or dynamic camera, and update the feature model. Scene recognition is to calculate the correspondence between scene perspective and front view based on the site feature model. At present, there are generally two ways to identify feature points: feature point recognition based on sensor signal acquisition and feature point recognition based on image feature analysis.
Princeton Video Image (PVI) ‘s [5] Virtual Advertising and Game Enhancements systems are widely used in MLB, NFL, NBA, PGA TOUR, SUPER BOWL and other events. Moreover, ABC, NBC, FOX, ESPN, etc. all use virtual media services provided by PVI. Israel’s Orad company [6] launched two sports live and video convergence solutions, CyberSport and AD Vision. Among them, TrackVision, which is used in football matches, is already the first choice for TV broadcasters in football live broadcasts. CyberSport provides a convenient and easy way to add 3D graphics, animation and video to live broadcasts. Moreover, as the lens moves, the inserted virtual object remains stationary at a particular location, making it appear to be part of the real scene in the arena. CyberSport consists of two main components: virtual sports and virtual advertising. Abid [7] specializes in interactive solutions that enable a personalized viewing experience and provides an opportunity to build a brand image for all forms of broadcast, interactive and wireless media. Sportvision provides powerful solutions for a wide range of broadcasters, including ABC, ESPN, NBC, Fox Sports and Turner Sports (NASCAR, NFL, MLS and PGA TOUR). By means of the Sportvision solution, these broadcasters are able to bring more entertainment to the audience. Karmali F [8] provides a video analysis system. Moreover, its eagle eye technology is widely used in tennis, football, snooker, and cricket competitions. In addition, in the tennis games such as Wimbledon and French Open, the virtual image analysis system provided by the judges whether the ball is out of bounds has become an auxiliary means of referee ruling.
Although these systems based on sensor signal capture feature points have achieved good results, it is necessary to attach the sensor to each joint of the athlete to collect data in real time, which will inevitably affect the athlete’s performance in training [9]. At the same time, the system they developed has higher computational complexity and the equipment required is more expensive and is not suitable for promotion. Compared with the sensor-based method, the image feature analysis method is more intelligent, cheaper, and flexible. The method has the advantages of no special equipment, low cost and strong application adaptability [10]. Of course, there is still room for improvement in terms of stability and accuracy. Since the feature point recognition method based on image feature detection has a broad application prospect, it is the direction of future research and development. At the same time, the rapid development of video fusion related technologies has raised higher requirements for the identification of multiple scenes and the fast and stable tracking of feature points [11]. The identification of multiple scenes is an extension of the application scope of video fusion technology. Moreover, the fast and stable tracking of feature points is an improvement of the application under the complicated conditions of video fusion technology. Therefore, feature point recognition based on image detection can be divided into the following development directions: (1) Improved algorithms and improved real-time performance through parallel computing; (2) Feature point detection stability analysis; (3) Multi-site feature recognition and matching [12].
Land mark algorithm
The LandMark algorithm is a classic RFID positioning algorithm, which was proposed by Professor Plappert M [13] in 2004. Since then, many excellent algorithms have been derived based on this algorithm, such as COMPASS algorithm and COCKTALL algorithm, which all improve the accuracy and stability of positioning to some extent.
The LandMark algorithm is different from the traditional RSSI ranging method: The traditional RSSI ranging method converts the RSSI into specific distance information through the Friis transmission equation, and then calculates the position of the label. However, the LandMark algorithm pre-deploys a fixed-position reference tag, and the reader perceives the need to locate the RSSI value of the tag and the RSSI value of the reference tag. If the positioning tags are adjacent to the reference tag, their RSSI values are similar. By comparing the neighboring method with the RSSI value of the reference tag, the adjacent tag can be determined to determine the position of the tag.
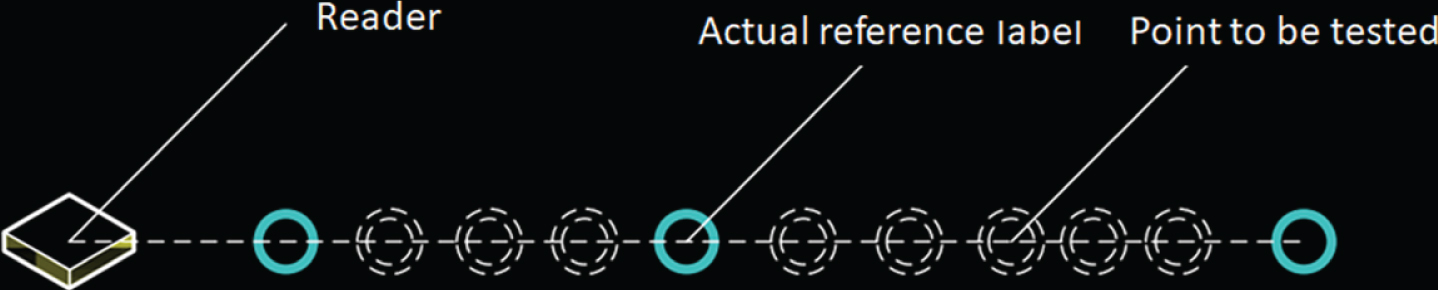
The specific deployment of the LandMark algorithm is shown in Fig. 1. We set m readers, n reference tags, and u tags to be tested. Such a deployment is to ensure that each reference tag can communicate with the reader (that is, the reference tag and the tag to be tested must be within the read range of the reader). If we assume that on the playground, we need to deploy the reader and reference tags on the field, while the athletes and items carry active RFID tags (the athletes carry the tags on the carrier). Then, the positioning application can be performed.
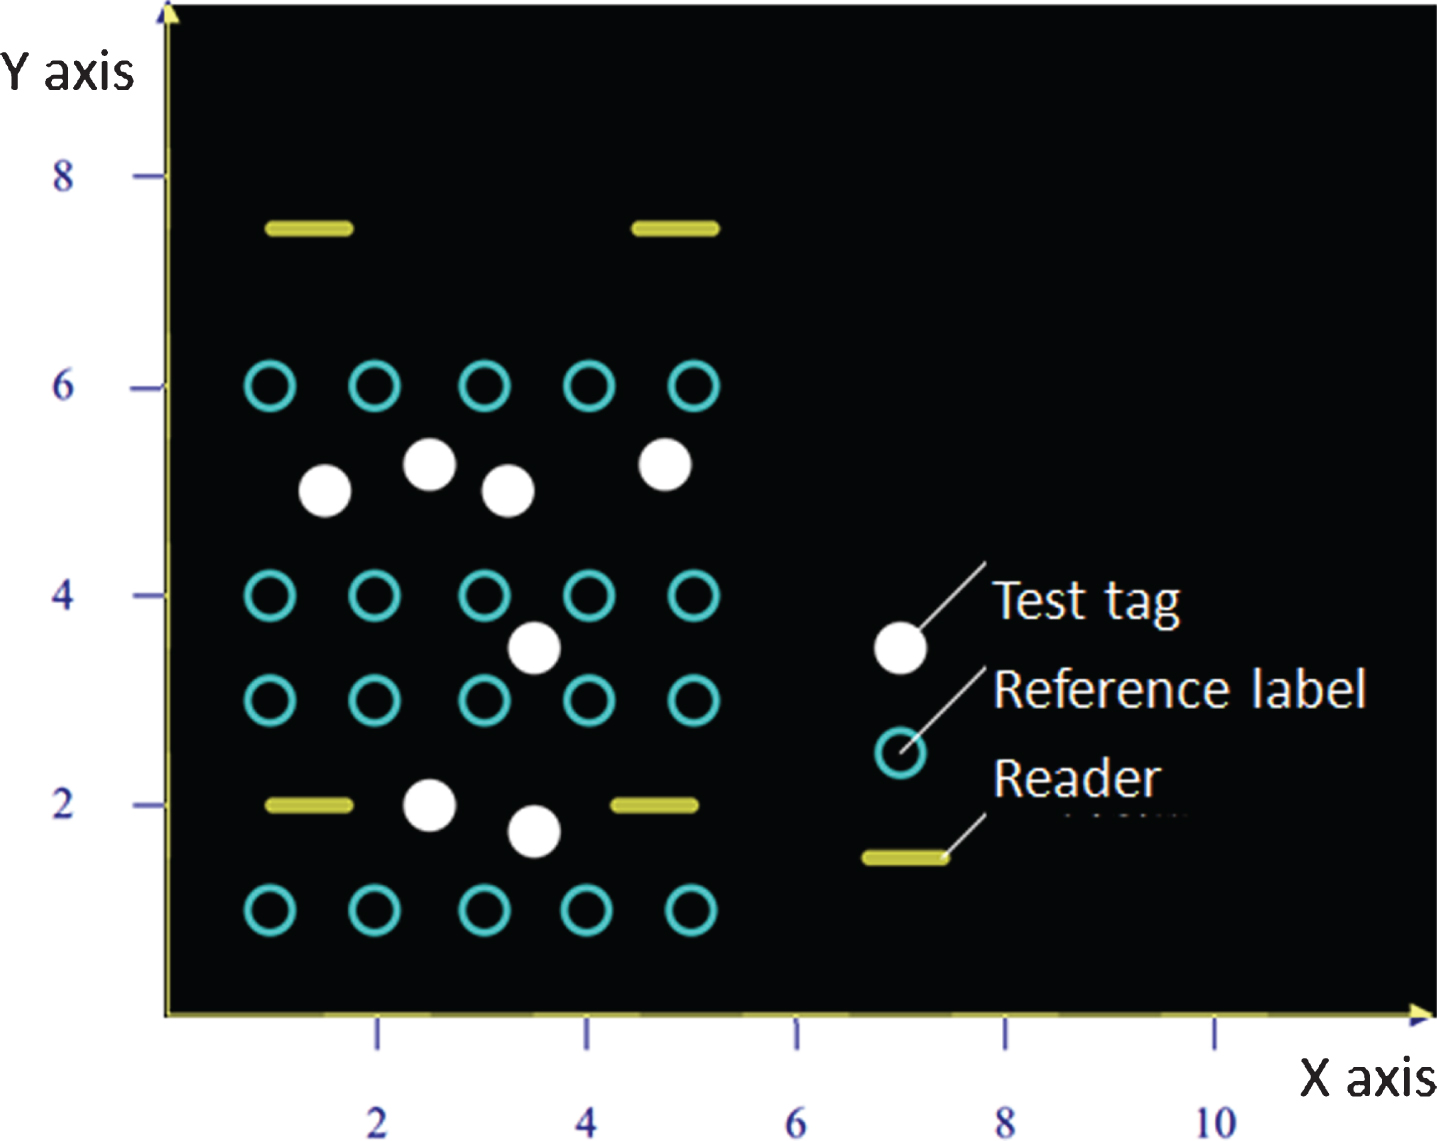
LandMark layout diagram.
We assume that the signal strength value of the tag to be tested is S
i
(i = 1, 2, ⋯ , m) andS
i
represents the signal strength value of the tag to be tested perceived by the i-th reader [14]. It is represented by a vector as:
The reference tag has a signal strength value of θ
i
(i = 1, 2, ⋯ , m), and θ
i
indicates that the i-th reader perceives the signal strength value of the reference tag. It is represented by a vector as:
LandMark references the Euclidean distance and the variable E
j
(j = 1, 2, ⋯ , n) is defined as:
The closer the reference label is to the position of the label to be tested, the smaller the value of E
j
and the more it tends to 0. The further the distance between the reference label and the label to be tested, the larger the value of E
j
. In practical applications, if there are n nearest reference labels, then there are n numbers of E and E:
The smallest E is chosen as the proximity reference tag. With m readers, there are m adjacent reference tags. The position of the tag to be tested is calculated by weighting as shown in the following formula (5).
The weight w
i
is second-order, as shown in the following Equation (6):
By pre-deploying reference tags, it is possible to overcome the shortcomings of traditional RSSI ranging that the positioning accuracy is unstable due to environmental factors. At the same time, the LandMark algorithm reduces the number of readers and does not require too many readers (the LandMark algorithm uses 4 readers) to adapt to complex and varied scenarios, and it can dynamically update the RSSI. As shown in Fig. 2, in the experimental environment, the Landmark algorithm has an error of up to 2 meters and an average error of about 1 meter. In addition, many LandMark-based improved algorithms reduce the error to the centimeter level and improve positioning accuracy and robustness.

LandMark algorithm error.
The location of the LandMark algorithm reference tag deployment and the location of the reader deployment are relatively square. At the same time, the tag to be tested must be deployed in the reference tag. The number of reference tags deployed will affect the accuracy of the positioning, and too many reference tags will interfere with each other. The number of adjacent reference tags has a large impact on the accuracy of the positioning. For example, when the number of neighboring reference tags increases from 2 to 5 (the reader changes from 2 to 5), the cumulative probability of positioning errors decreases from 2.68% to 1.99%. Therefore, in practice, the LandMark algorithm is less directly used for positioning, but the improved algorithm based on LandMark has been widely used, which lays the classic position of LandMark algorithm.
The VIRE algorithm is a large number of deployment reference tags based on the LandMark algorithm, which leads to excessive cost [15]. Based on the actual reference label deployed by the LandMark algorithm, the VIRE algorithm introduces a virtual reference label, which reduces the number of actual reference labels and the difficulty of deployment and reduces equipment costs. For the introduced virtual reference tags, the VIRE algorithm meshes them, creates a close map with the actual reference tags, and cleans up some incorrect reference points. Moreover, two factor weighting methods have been introduced to further improve the accuracy of positioning. The experimental results show that the positioning accuracy of the VIRE algorithm is improved by 27% ∼73% compared with Land-Mark. In the same scenario, the average error can reach 0.29 m under the influence of environmental factors.
The specific deployment of the VIRE algorithm is shown in Fig. 3. We assume that four reference labels are placed and the range covered by the four labels is meshed.
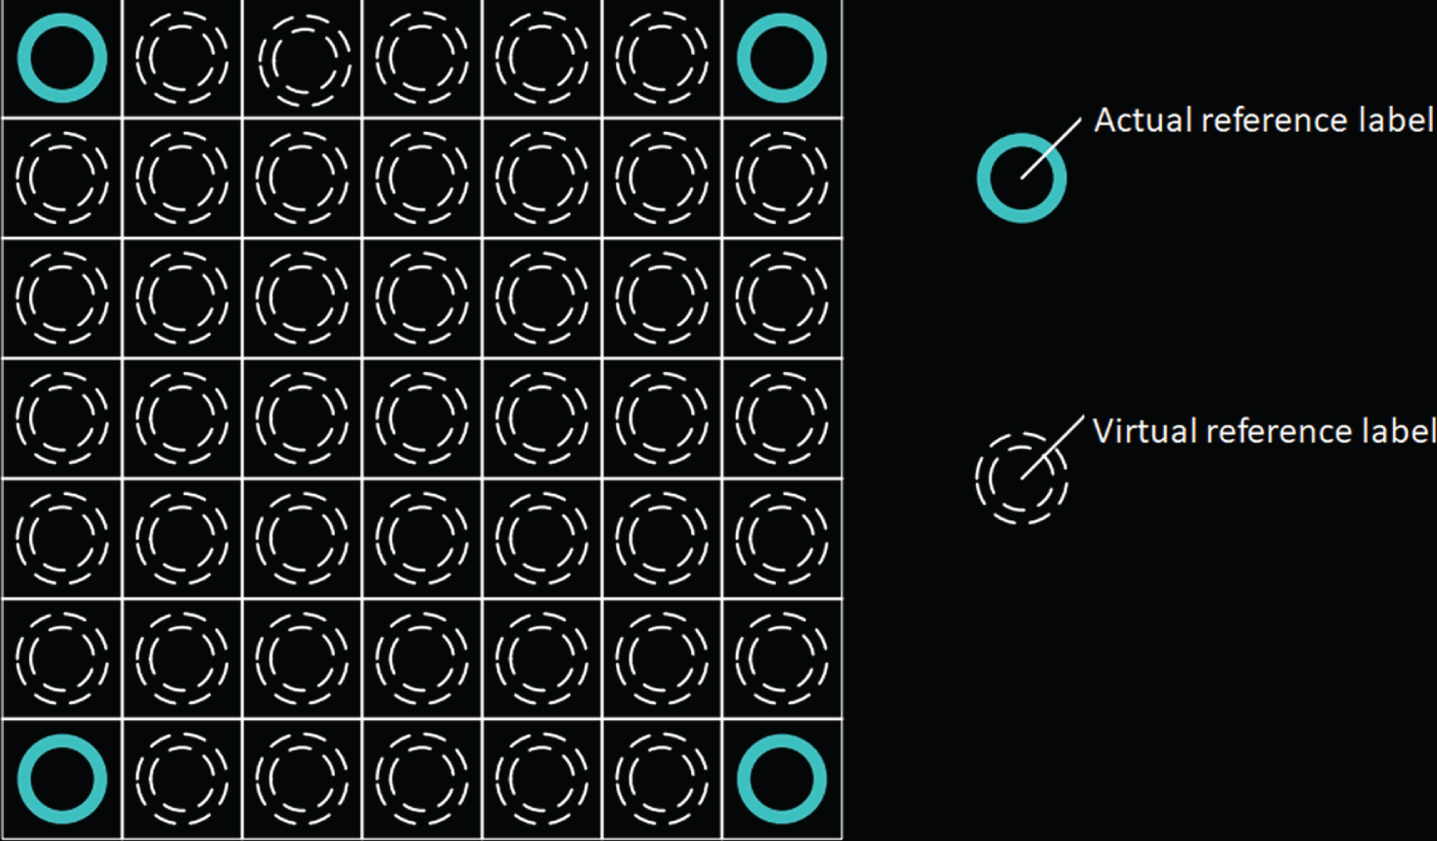
VIRE algorithm layout.
When performing VIRE algorithm positioning, we first need to get the RSSI value of the virtual reference tag. In the VIRE system, all the reference labels are divided into equally spaced grids, each grid is a reference label, and the RSSI value of the reference label is obtained by linear interpolation.
We assume that the coordinate of the virtual tag is (p, q), the coordinate of the actual reference tag is (a, b), and the RSSI value of the tag of the coordinate (x, y) is defined as S k (Tx,y).
Then, the RSSI value of the tag can be obtained by the formulas (7) and (8).
Second, by constructing a similar map, the wrong positioning coordinates can be eliminated. The process of eliminating incorrect positioning coordinates is shown in Fig. 4. After the RSSI of the virtual reference label is obtained, it can be compared with the label to be tested. If the RSSI is smaller than the preset threshold, the area is marked as a valid area. Then, by performing an AND operation on the similar map of the reader, the position of the label can be estimated.

The process of eliminating incorrect positioning coordinates.
Finally, the coordinates of the tag to be tested are obtained by weighting calculation. The VIRE algorithm introduces two weighting factors in order to improve the accuracy of the positioning. The weighting factor w1i and w2i are as shown in Equations (9) and (10):
In the formula, k represents the reader, S
k
(T
i
) represents the RSSI value of the tag to be tested read by the reader k, and S
k
(R) is the RSSI value of the virtual reference tag. Therefore, w1i represents the difference between the RSSI value of the virtual reference tag and the actual RSSI value of the tag under test. n
a
represents all selected virtual reference label areas, and n
c
i
represents the area where the selected virtual reference labels are consecutive (connected together in the grid). Therefore, w2i represents the proportion between the contiguous area of the virtual label and the entire selected area. Moreover, the weight w
i
= w1i * w2i. Finally, the coordinates of the label to be tested are calculated by the following formula.
Although the VIRE algorithm improves the accuracy of positioning and does not increase the cost of the system, there are also deficiencies: VIRE uses linear interpolation. In the actual environment, the RSSI of electromagnetic waves is lossy and not proportional to the distance. Second, the two weighting factors introduced by the VIRE algorithm are affected by the threshold set by removing the incorrect positioning coordinates, as shown in Fig. 5. If the threshold is too large, the number of adjacent tags will increase, and the error will be too large. If the threshold is too small, the number of adjacent tags will be too small, and the error will be too large. If the threshold is too large or too small, it will affect the positioning effect. Although the VIRE algorithm refers to the threshold setting method, the threshold setting method of the VIRE algorithm needs to be measured too many times and takes too much time.
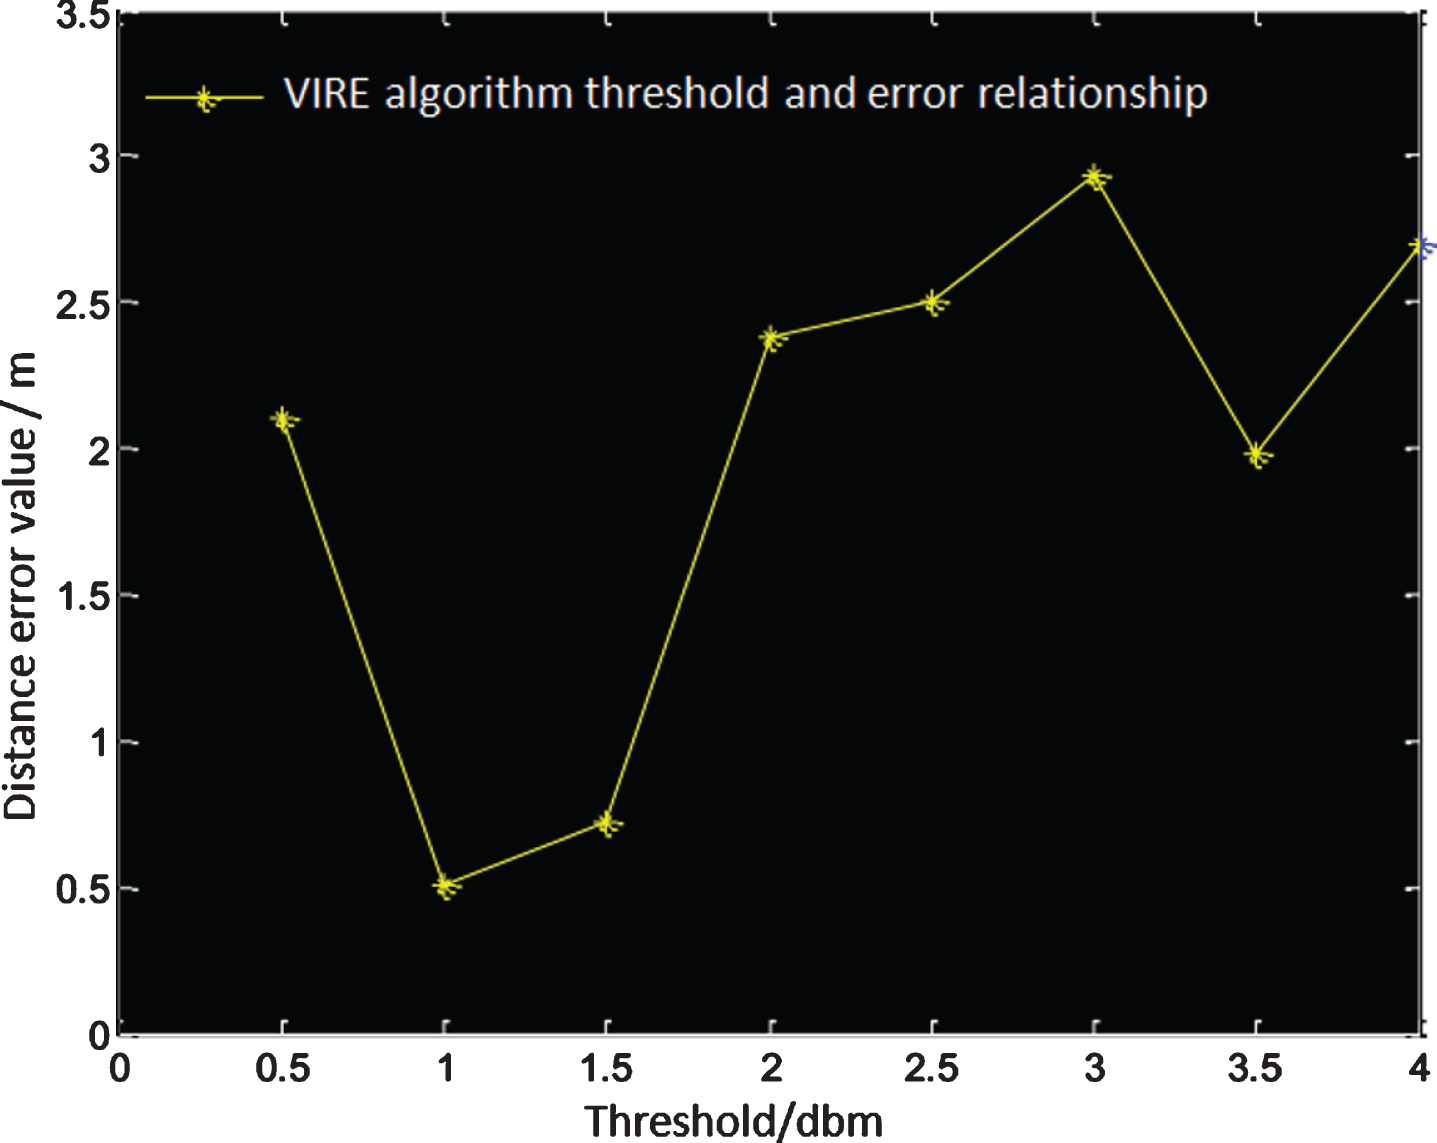
Relationship between threshold and error of the VIRE algorithm.
In an ideal medium space, such as a vacuum environment, there is no loss of electromagnetic wave propagation, but in actual scenes, electromagnetic wave propagation may be reflected, refracted, scattered, and absorbed. Moreover, in the case of a large number of obstacles, the loss of electromagnetic waves in indoor or outdoor scenes is more serious. In an outdoor environment such as a playground, there are two main interference factors: One is obstacles (people, sports equipment, etc.), and the other is noise (sound noise, thermal noise, etc.). However, these can be controlled and eliminated. Therefore, the impact in practice is small, as long as a suitable interpolation method is selected, and the interpolation method conforms to the loss model in the electromagnetic wave propagation process.
In the transmission process of traditional electromagnetic signals, the distribution model of RSSI mainly includes free Freespace propagation model, Log-distance path loss model, Log-distance distribution, Rayleigh Fading model, Okumura model, etc. Of course, we can also choose to collect the RSSI distribution data by ourselves, enter the database, and dynamically update the distribution of RSSI in real time. Although the RSSI values obtained by this method are more accurate, the data points that need to be collected are too numerous and too detailed, and this involves methods of machine learning and data mining. Therefore, this article does not adopt such a method.
The improved algorithm is based on the shortcomings of the VIRE algorithm, which is a linear interpolation method used on the reference label. This method has a large error in practical applications because the distance loss of RSSI is not linear in practice.
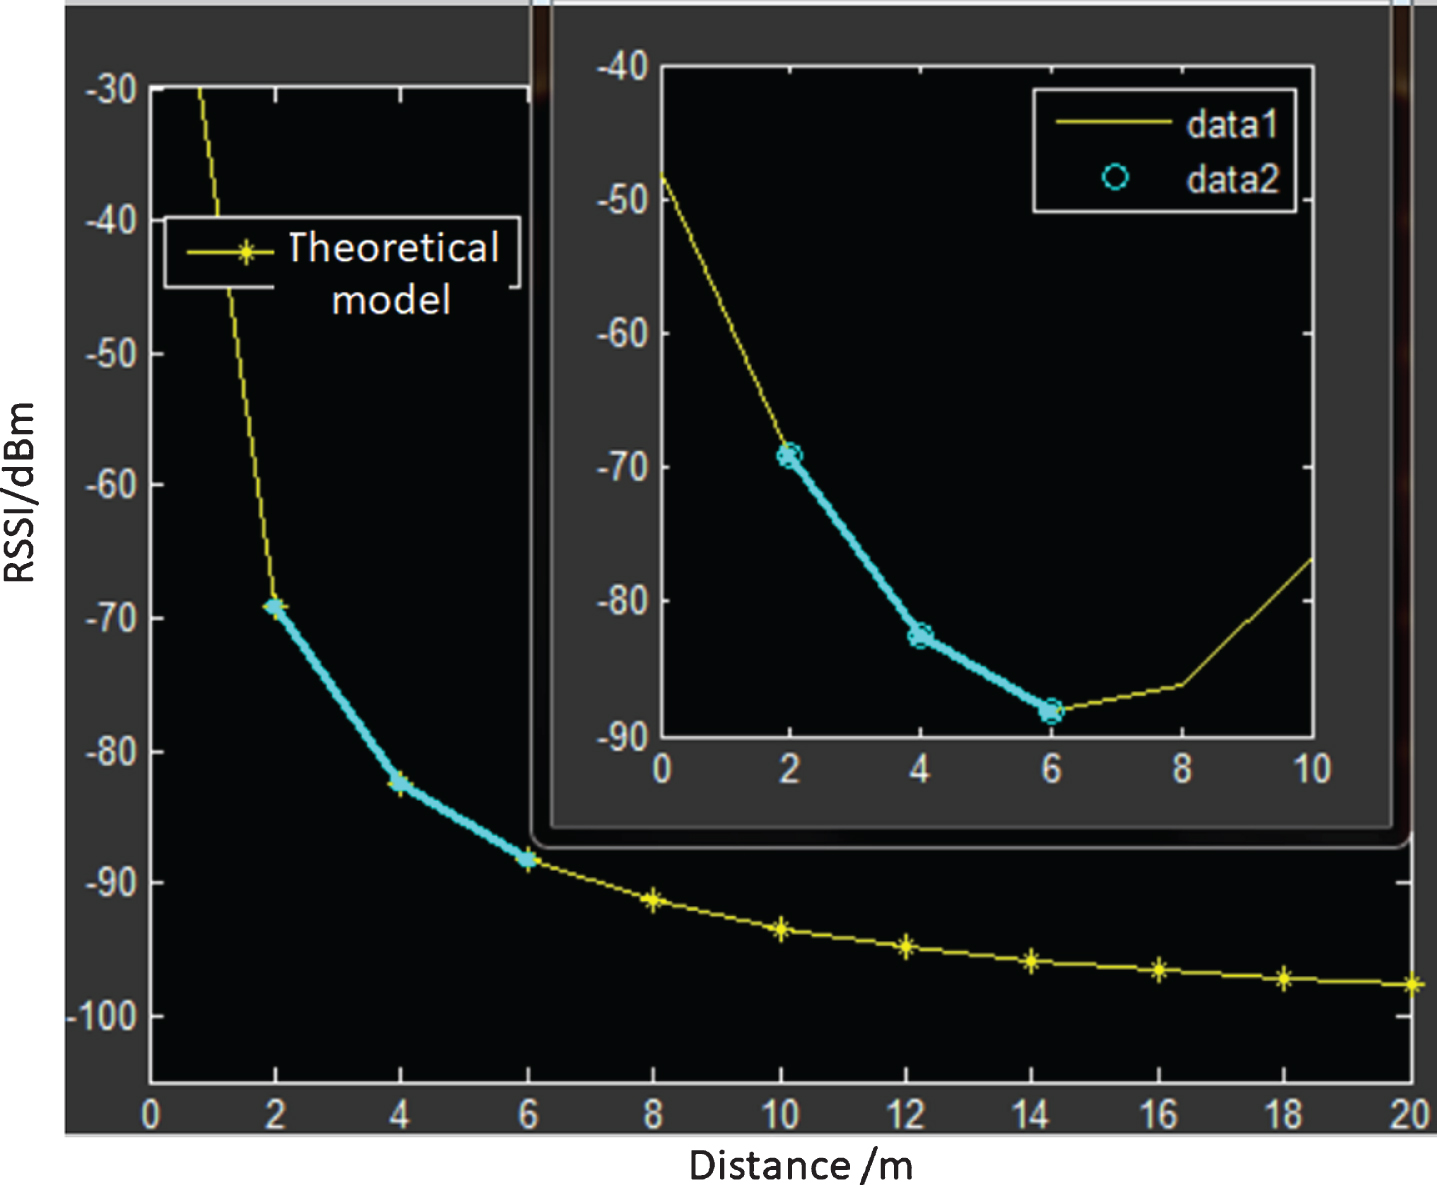
A large number of experiments and the above propagation models show that: The electromagnetic wave RSSI value has a logarithmic relationship with the distance during the propagation process. It is represented by the common logarithmic distance loss model. The loss model is:
In the formula, d is the distance between the signal receiving point and the transmitting point (that is, the distance between the reader and the tag), d0 is the reference distance, which is usually 1 m, n is the path loss index, which is related to the surrounding environment, and X σ is the Gaussian distribution random variable.
As shown in Fig. 6, it is a theoretical model of RSSI and distance based on the logarithmic distance loss model.
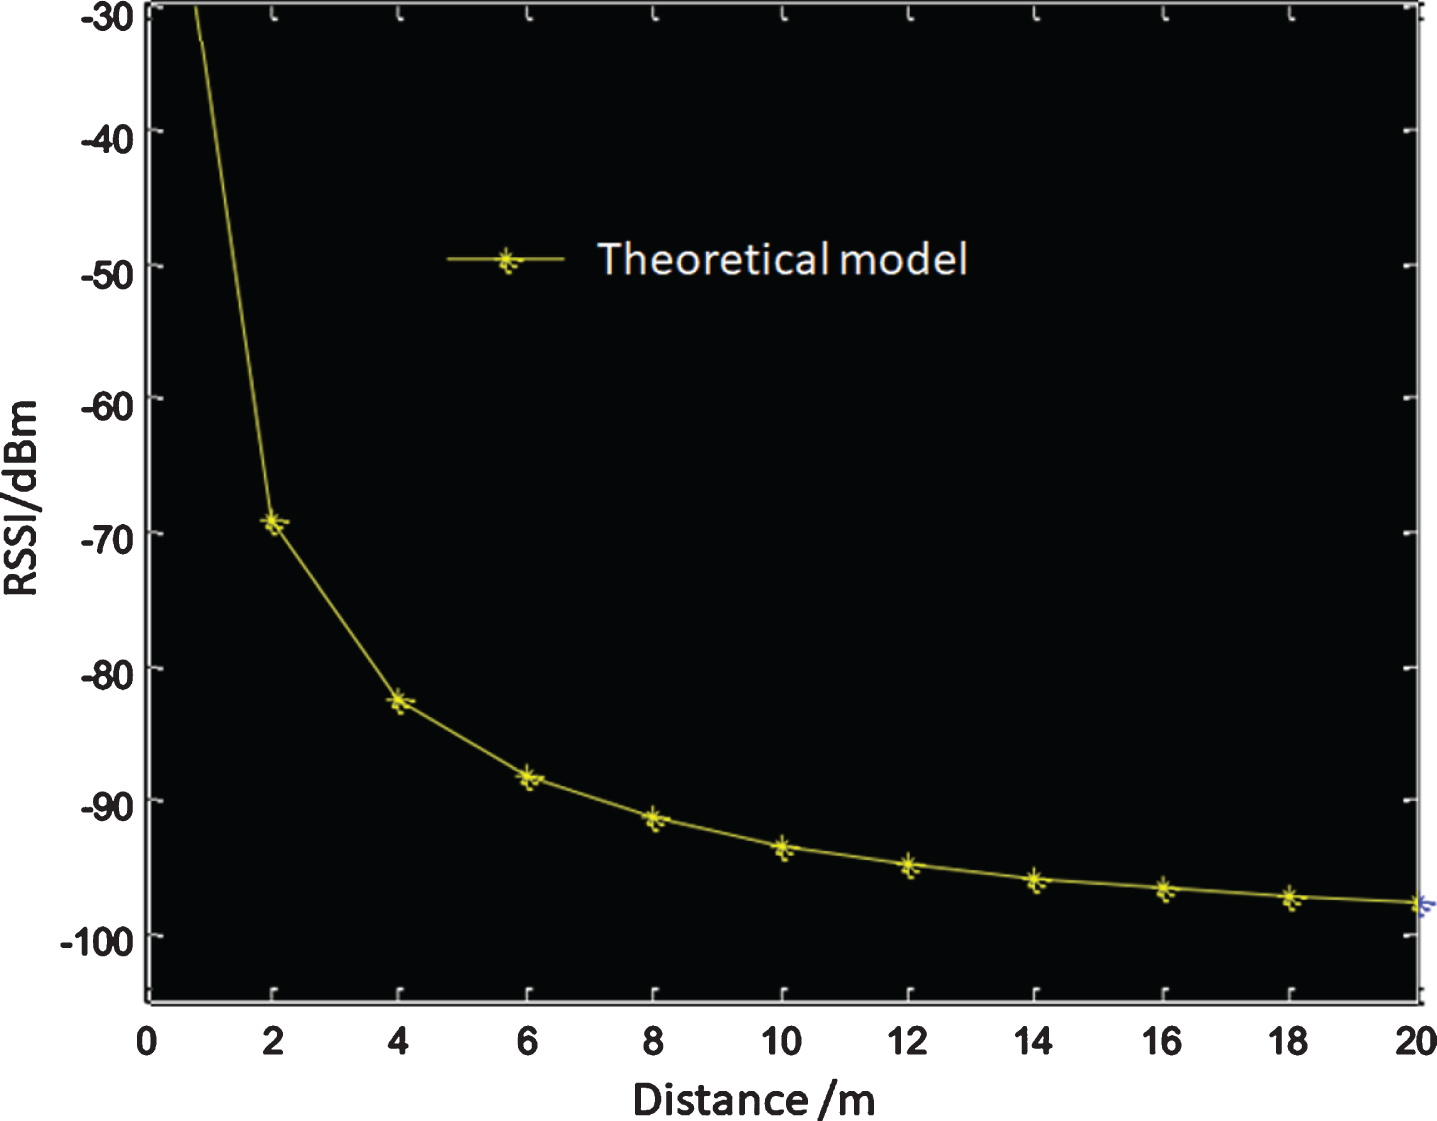
The graph of relationship between signal strength value RSSI and distance.
If linear interpolation is used, we can perform a simple analysis, as shown in Fig. 7.

Error analysis of linear interpolation.
Therefore, this paper uses a nonlinear interpolation method - quadratic interpolation (parabolic interpolation). Of course, there is also an interpolation method based on the logarithmic distance loss model, but this interpolation method is complicated, and the controllability of the algorithm is not strong. The specific interpolation methods used in this paper are as follows:
First, we also assume that the coordinates of the virtual tag are (p, q), and the RSSI value of the tag of the coordinate (x, y) is defined as S k (Tx,y).
We assume that in the direct coordinate system, the coordinates of the three actual reference labels with the same ordinate are known as (x1, b) , (x2, b) , (x3, b). Then, the RSSI value of the reference tag is S
k
(Tx1,e) , S
k
(Tx2,e) , S
k
(Tx3,e) in order, and the parabolic equation is f (x) = a * x2 + b * x + c, and the resulting system of equations is as follows:
This is a simple ternary equation system, and the amount of calculation is not very large. The interpolation function is obtained by calculation as follows:
Thus, the horizontal RSSI value S
k
(Tp,e) of the virtual reference tag is:
Similarly, the vertical RSSI value of the virtual reference tag can be obtained. By means of quadratic interpolation, the virtual tag RSSI value in the entire positioning system can be obtained.
The advantage of using quadratic interpolation is that the quadratic interpolation is nonlinear, and the function of the parabola constructed by quadratic interpolation is close to the actual distance loss function. As shown in Fig. 8, the truncation error of the quadratic interpolation is also significantly smaller than the truncation error of the linear interpolation.
Analysis of the error of quadratic interpolation.
The effects of quadratic interpolation and linear interpolation on the estimation of RSSI values were compared by performing experiment. The experiment is schematically shown in Fig. 9. The three active reference tags are listed on the same line and distributed. The reader is outside the three active reference tags and the readers are on the same line, and the site selects an open area to reduce the interference with the signal.
Schematic diagram of the interpolation test scenario.
First, the RSSI values of the three active reference tags are measured, and 8 position points of the three reference tags are selected. After that, the linear interpolation and quadratic interpolation are used to estimate the RSSI value of the position point, respectively. Then, the linear interpolation and quadratic interpolation are used to actual reference label and the actual RSSI values of the 8 position points are measured. Finally, the measured and actual values are compared.
The comparison of relative error of quadratic interpolation and linear interpolation is shown in Fig. 10.
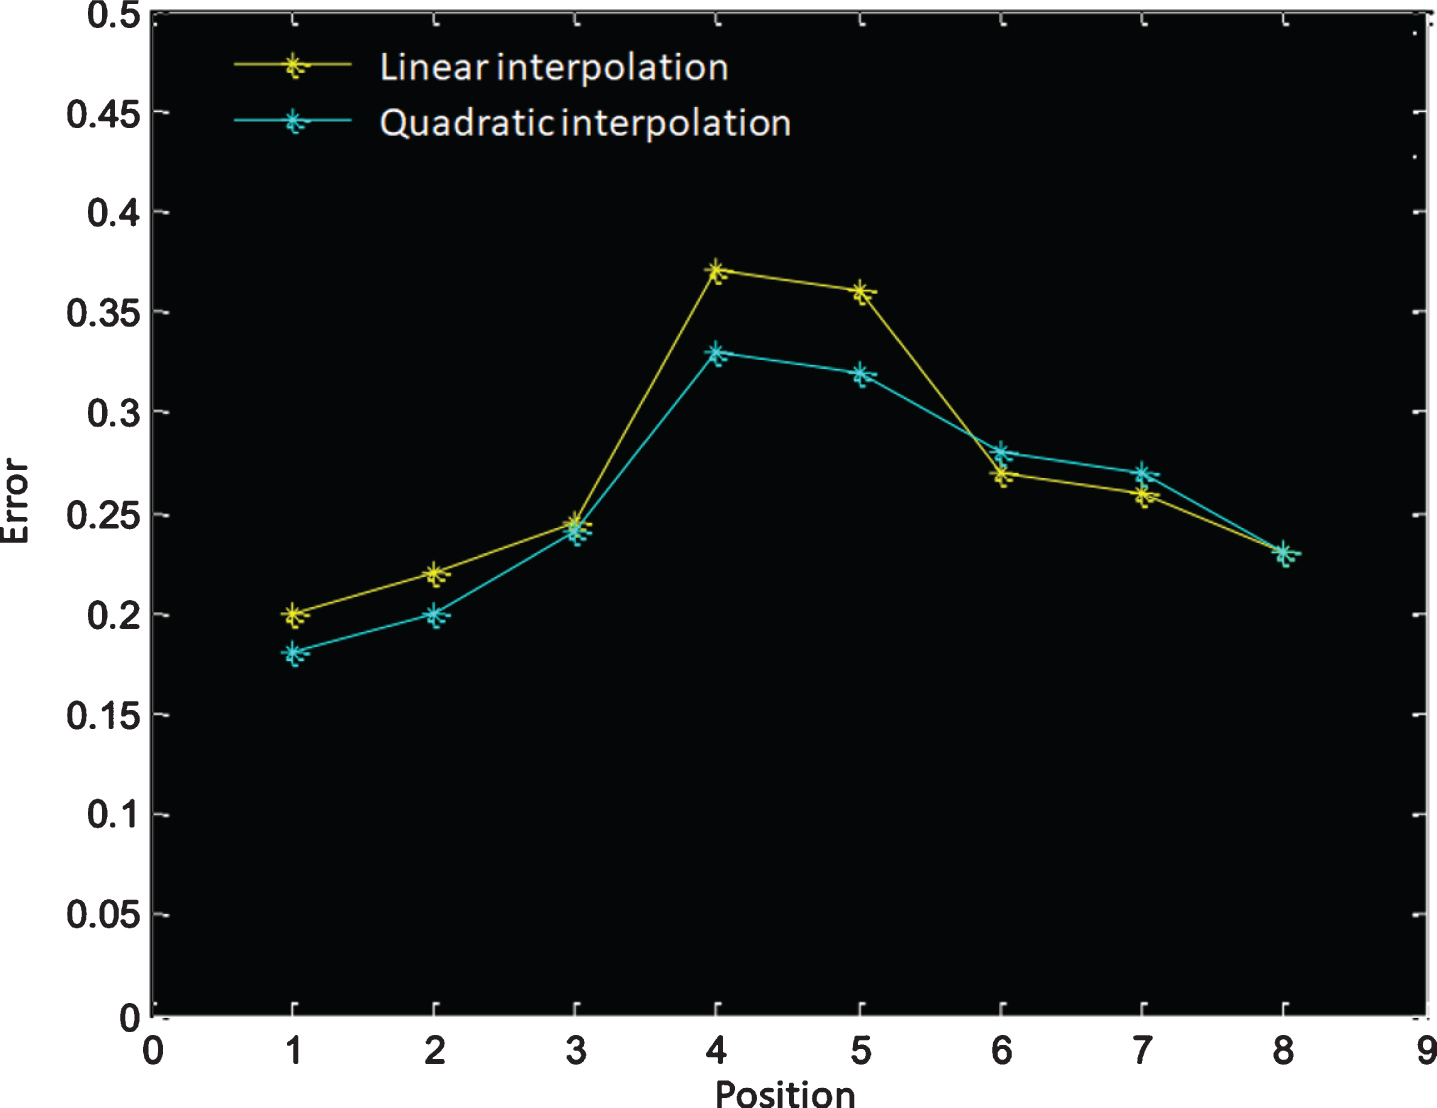
Error analysis of quadratic interpolation and linear interpolation.
It can be found that the overall relative error of quadratic interpolation is less than linear interpolation, Moreover, linear interpolation has a large error near the midpoint position (for example, 4, 5 positions) of the actual reference labels of the two endpoints. In some locations, there is a place where the quadratic interpolation method is larger than the linear interpolation error. However, it is found that these large errors are usually where the RSSI attenuation is particularly severe, and its impact on system positioning is small.
At the same time, the workload of calculation using quadratic interpolation is not large. If logarithm distance path loss is used, the exponential and logarithm operations are involved, while quadratic interpolation involves only the basic operations of addition, subtraction, multiplication, and division. The complexity of exponential and logarithmic operations is significant compared to simple addition and subtraction operations. Compared with the method of Newton interpolation, the quadratic interpolation does not need to require the derivative of the RSSI and the distance function (in practice, because the function curve is unknown, the difficulty of the derivative is very large), and it is simpler.
In practice, at regular intervals, the reader re-reads the RSSI value of the reference tag and evaluates the RSSI distribution of the virtual reference tag. If there is a large error, the RSSI value is recalculated in time.
Correction of RSSI values
There is a certain error between the RSSI value calculated by the quadratic interpolation and the RSSI value calculated based on the logarithm distance loss model, which also deviates from the actual RSSI value. In this chapter, the RSSI value is modified to make the calculated RSSI value close to the actual one, so as to minimize the interference of the actual environment.
The middle position of the adjacent two reference labels is selected and the actual RSSI value of the position is measured. Three such location points are randomly selected to measure the actual RSSI value S
i
(i = 1, 2, 3) and calculate the RSSI value S
k
(T
i
) (i = 1, 2, 3) obtained by quadratic interpolation. After that, the average value
Reference label deployment
Linear interpolation requires only two endpoints to interpolate, while quadratic interpolation requires three endpoints to take interpolation calculations. Therefore, the positioning algorithm of this study uses reference label deployment of the nine-square grid method. The deployment of the reference label is shown in Fig. 11:
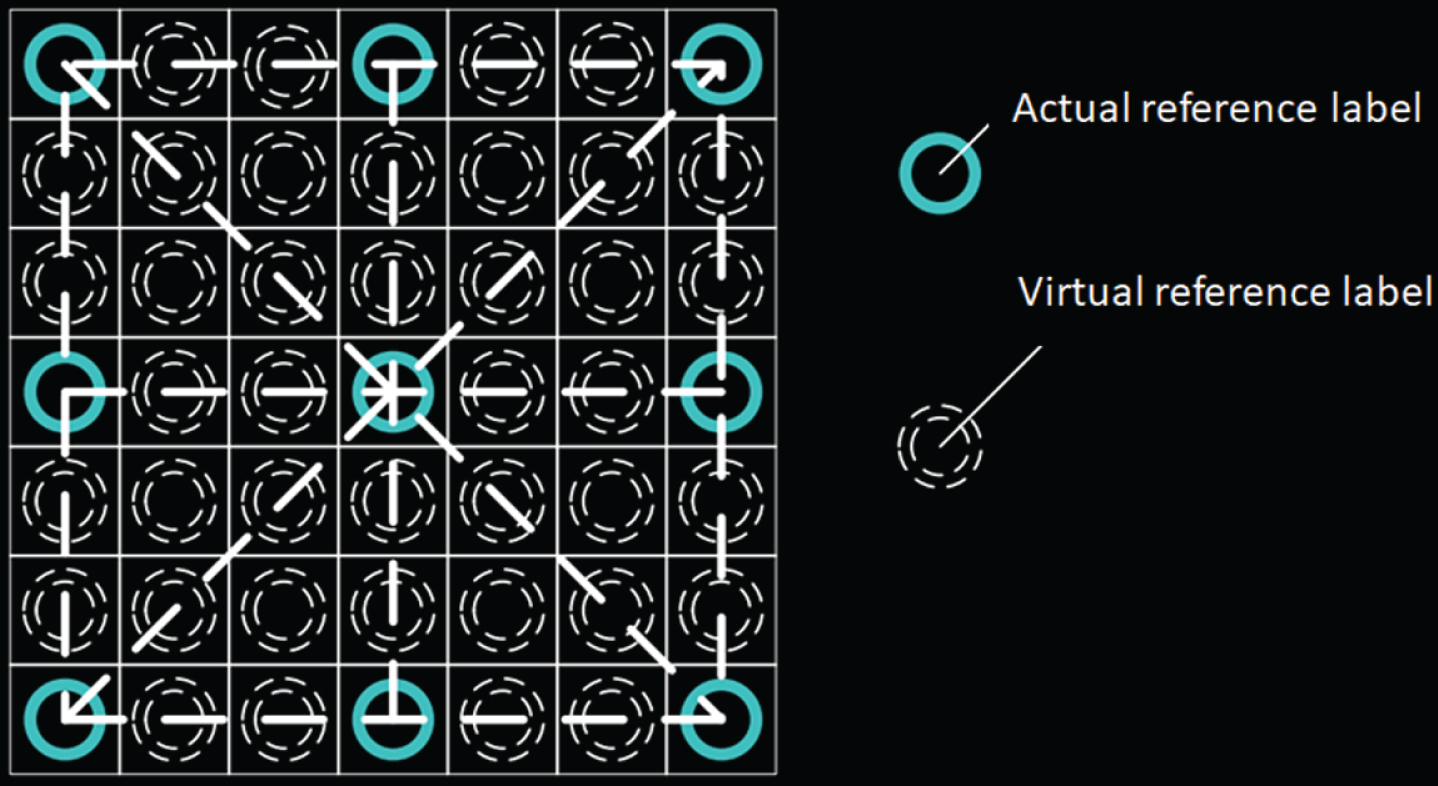
Schematic diagram of the reference label deployment of the improved algorithm.
For the actual deployment, the improved algorithm is consistent with the VIRE algorithm. The difference is that the VIRE algorithm can arrange at least 4 reference labels, and the improved algorithm must have at least 9 reference labels. In practice, the cost of the reference label is not much increased, and the impact is small. The nine-square grid is 6 * 6m2. As shown in Fig. 11, the reference labels are mostly located at the end points, one at the center point, each end point being 3 m apart, and the distance of the reader from the end point reference label at the top corner is 1 m.
The distance from the reference tag to the reader is 1–7 m. In such a reading range, the loss of RSSI with distance is obvious, and the fitting curve obtained by quadratic interpolation is close to the actual curve.
As shown in Fig. 12, because the improved algorithm reference tag is deployed in a nine-square grid, the area of the virtual tag is more detailed than the VIRE algorithm, and the number of reference tags is increased, which is actually beneficial for building the RSSI distribution.
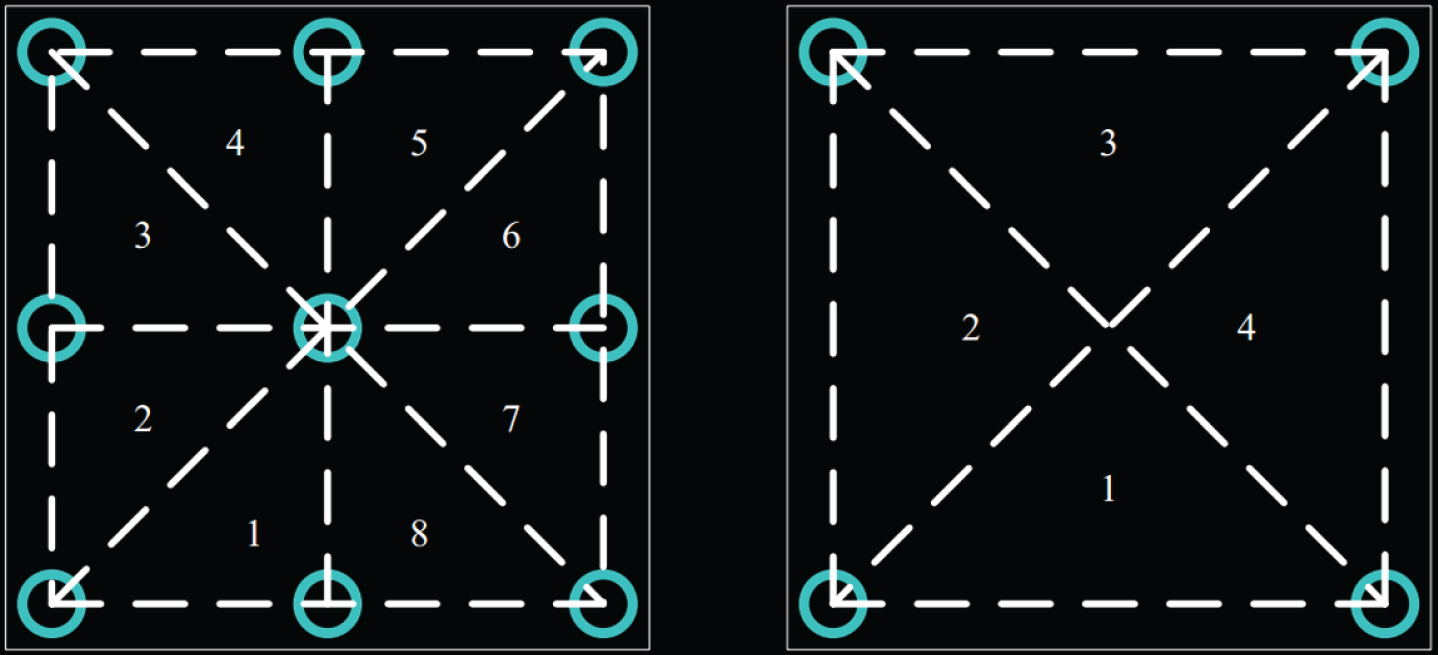
Comparison of regional division.
After the RSSI value of the virtual tag is determined, when the tag with positioning enters the measurement range of the reader, the reader will perceive and measure the RSSI value of the tag to be located. After that, the obtained RSSI value is subtracted from the virtual RSSI value and then taken as an absolute value. If the absolute value is less than the set threshold, the virtual label is regarded as a neighboring label. At the same time, by performing AND operations with other reader-perceived results, a set of adjacent virtual reference tags can be obtained.
However, if the threshold is set too large, significant errors will occur. As shown in Fig. 13, the actual tag to be tested should be located close to the virtual tag to be tested below. Then, if the threshold is set too large, the calculated position will be biased. Although the VIRE algorithm hopes to eliminate this effect as much as possible by the weighting factor in the weight formula, the effect is average. If the threshold is set too small, the number of neighbor tags that we obtain will be too small, and the accuracy of positioning will be greatly reduced. Therefore, it is important to choose a suitable threshold.

Distribution of adjacent tags.
Through the above figure, we can also find a phenomenon that after the positioning area is meshed, the neighbor labels closest to the label to be located must be adjacent. If the selected neighbor reference labels are not adjacent and are discretely distributed, the portion of which the probability is small can be excluded.
In view of this, we propose a method of setting the threshold. Each reader initially sets a larger threshold, the neighbor map of the reader virtual tag is constructed (The absolute value of the difference between the virtual tag RSSI and the tag RSSI is less than the current threshold), and the area is recorded. Then, the threshold is linearly decremented to obtain a new virtual neighboring label area, and the neighboring area is compared with the previous threshold. If the regions are the same or the regions are similar (the number of different adjacent tags is less than 1), the threshold continues to decrease. Otherwise, the threshold stops decrementing, and the adjacent tag area of the previous threshold is recorded as the final virtual tag adjacent area of the reader. Each reader repeats the above steps, and finally we do the intersection operation to get the intersection of all the virtual adjacent label areas of the reader. In this way, the threshold of each reader is not uniform, and the number of threshold decrements is reduced.
Finally, the selected adjacent tag area is further optimized, and the continuous area is selected, and the continuous area is the largest part compared to the other discontinuous areas, and the other parts are eliminated.
After obtaining a set of adjacent virtual reference labels in the above manner, the improved algorithm still uses the weight calculation method of the VIRE algorithm. However, at this time, the weighting factor is less affected by the threshold. Finally, the coordinate position of the label to be positioned is calculated and obtained.
The weighting factor w1i and w2i are as follows, and the weight w
i
= w1i * w2i.
This experiment uses the algorithm model designed in this study combined with the Qualysis infrared capture system to capture the tennis serve. This experiment is divided into two tests. The first test time is July 14, 2019, and the second measurement time is September 12, 2019. Both are testing and using the same set of qualysis infrared camera instruments. The reason why it is divided into two tests is because the first time when the first measurement is catching up with the summer vacation, the school team only left the students with the game task, so the number is small. Therefore, the new school team athletes be measured after the start of school in September.
The qualysis analysis system is used to analyze the shoulder hip torsion of each athlete’s throwing ball and raising the racket and the shoulder hip torsion at the moment of hitting. The trajectory of the joints collected by the illuminating balls on the marked joint points is recorded by the qualysis infrared camera, and then each illuminating ball is connected according to the human anatomy to form the trunk part of the human body. Finally, the data of the shoulder hip torsion degree of the athlete’s first and second shots at the time of throwing ball and raising the racket the time of the hitting are analyzed, and the shoulder hip twist and the serve score are used as the basis for evaluating the serve ability. After that, the shoulder hip torsion degree of the athletes was compared with the world professional players to provide reference standards for the serve of domestic athletes.
The girl ITN1 (345–430 points) has a range of 86–108, divided into the first step, there is only one girl in this ladder, and her serve score is 86 points, and the relative rise height ratio of shoulder and hip is 0.066. The trajectory of the serve is shown in Fig. 14. We can see that the shoulder hip movement is obviously up and down in the horizontal plane and reaches the highest point when hitting the ball.
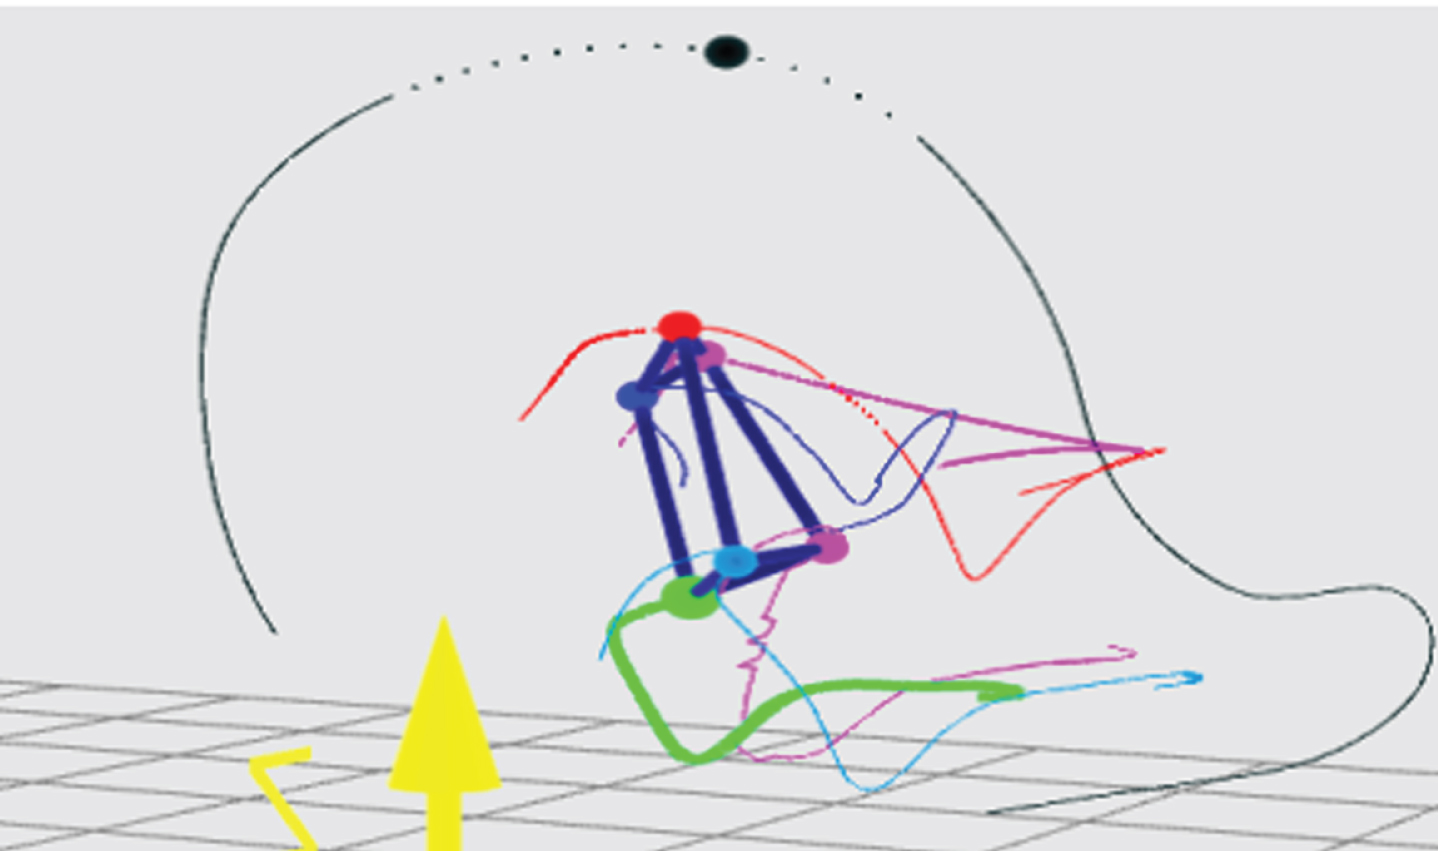
Feature recognition of the female athlete’s serve trajectory.
The boy’s ITN2 (338–362 points) has a range of 84–90 points, which is the second step. There are 4 boys in this ladder, and their scores are 90, 90, 85, and 85.
Based on the ups and downs of their shoulders and hips in the horizontal plane (Figs. 15a-15d):
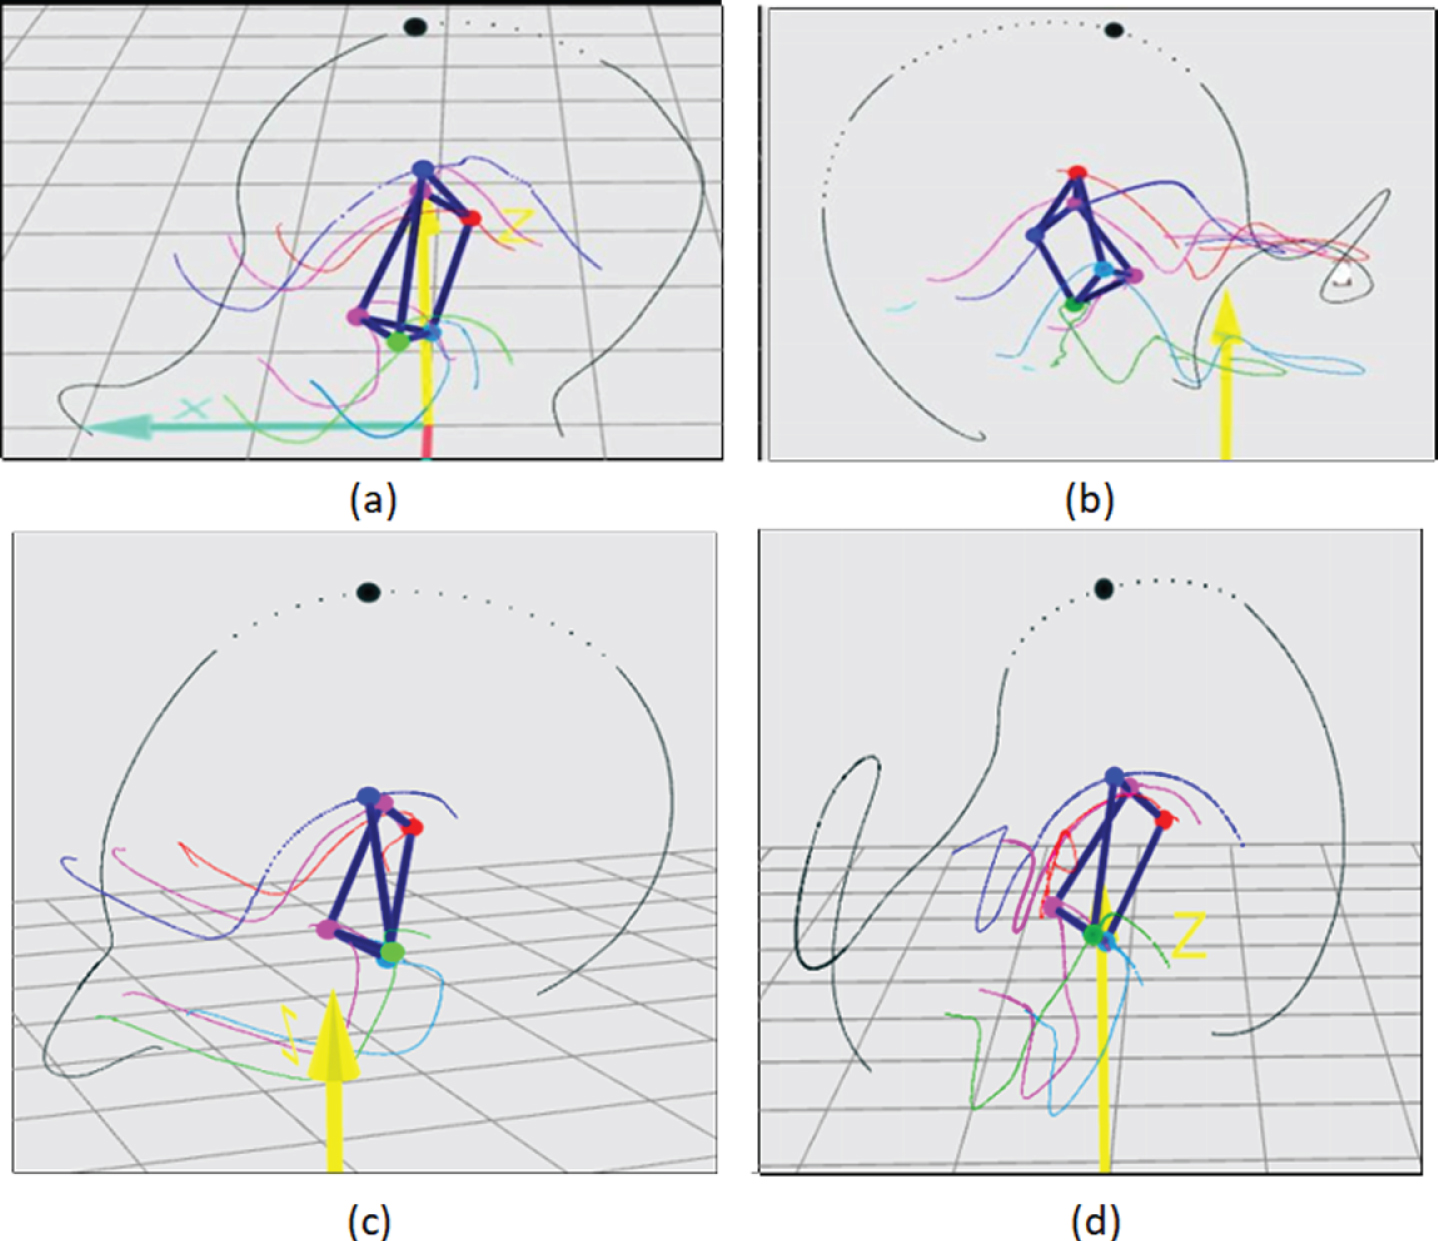
Feature recognition of the male athlete’s serve trajectory.
It can be seen from the above analysis that the algorithm model of this study combined with the qualysis infrared capture system to capture the results of the tennis serve is in line with the actual situation. Therefore, this research system has certain practical effects and can be applied to sports capture.
With the development of information technology and the diversity of viewing forms of sports events, sports video analysis and processing show high research significance and commercial value. Taking sports video as the object of analysis, this paper focuses on the feature mark detection and scene recognition technology in sports video analysis. This technology is the core technology of sports virtual video fusion system and has a wide range of application value. The feature mark detection and scene recognition technology mainly include sub-modules such as main area extraction, feature point detection and matching, and feature point motion tracking. For the shortcoming that when the VIRE positioning algorithm uses linear interpolation to calculate the virtual label, the error between the obtained RSSI value and the actual value is larger, this paper uses quadratic interpolation to improve it. The result of the quadratic interpolation method is closer to the actual RSSI distance distribution. Moreover, this study discusses the threshold setting of the algorithm, and proposes a threshold setting method, so that the thresholds of neighboring maps of each reader are not necessarily consistent, and the resulting neighbor label map is more accurate. In addition, this paper uses the algorithm model designed in this study combined with the qualysis infrared capture system to capture the tennis serve. Finally, this study conducts model algorithm performance analysis through comparative analysis. The research results show that the research system has certain practical effects.