
Abstract
For industrial production, the traditional manual on-site monitoring method is far from meeting production needs, so it is imperative to establish a remote monitoring system for equipment. Based on machine learning algorithms, this paper combines artificial intelligence technology and Internet of Things technology to build an efficient, fast, and accurate industrial equipment monitoring system. Moreover, in view of the characteristics of the diverse types of equipment, scattered layout, and many parameters in the manufacturing equipment as well as the complexity of the high temperature, high pressure, and chemical environment in which the equipment is located, this study designs and implements a remote monitoring and data analysis system for industrial equipment based on the Internet of Things. In addition, based on the application scenarios of the actual aeronautical weather floating platform test platform, this study combines the platform prototype system to design and implement a set of strong real-time communication test platform based on the Windows operating system. The test results show that the industrial Internet of Things system based on machine learning and artificial intelligence technology constructed in this paper has certain practicality.
Introduction
With the expansion of the Internet, the rapid development of artificial intelligence technology, the continuous transformation of the manufacturing industry under its impetus, industrial production began to face a series of diversified challenges, and the traditional production technology and information management methods can no longer meet their development needs. What has changed is the birth of diversified information technology and the integration of the industry, and concepts such as “smart factory” and “smart manufacturing” have emerged. In this field, intelligent manufacturing that incorporates multiple technologies such as industrial automation, intelligent logistics, industrial big data platforms, and the Industrial Internet of Things has gradually injected new blood into the manufacturing industry [1]. With the introduction of Industry 4.0, concepts such as smart factories, visual factories, and digital manufacturing frequently appeared. The Internet of Things is the core of it: The Internet of Things replaces the M2M (Machine to Machine) communication structure in traditional industrial production and realizes intelligent connections through the ToT (Things to Things) architecture. In production, all the devices involved are integrated into the Internet of Things management, so that a flexible network communication mode can be built between the device and the host [2]. The arrival of the “Internet of Things” has brought more possibilities for the intelligentization and intelligent decision-making of the manufacturing industry. In the past industrial production, it was often difficult to cover everything because of the large and complex production system, and it was impossible to completely control all production equipment and production links by manpower alone. Moreover, when faced with the adjustment of process technology of different types of products, too much intervention based on manual experience will have a certain impact on the smooth progress of the production process and the quality assurance of the final product. So far, the advantages of the Internet of Things have been greatly reflected: by building an intelligent factory based on the Internet of Things, digital control of workshop production, real-time monitoring of equipment status information and adaptive control are realized, so as to monitor and control the entire production, and optimize the process management at the same time [3].
The realization of data visualization is crucial. Due to the high degree of integration between industrialization and informatization, information technology provides a variety of methods for data collection. For example, bar codes, two-dimensional codes and RFID, industrial sensors, automatic control systems and other technologies have been applied in all directions. Through the combination of radio frequency technology and industrial sensors, a data acquisition system covering the entire production system equipment can be realized. At the same time, the difficulty of manual supervision is increased, and it is difficult to manage a large amount of production data with human resources alone. Therefore, it is particularly important to complete data visualization and realize data concentration and intelligent management and control. In addition, another important purpose of data visualization is to make full use of these industrial data. The reason why the production efficiency and yield rate of products in traditional production is difficult to be greatly improved lies in the limitations of manual regulation. Workers rely on work experience to supervise and optimize the production process with reference to industry standards. However, due to incomplete information acquisition and the uncertainty of past experience, product quality control is very ineffective. Facing the increasing production demands and high-quality requirements, the traditional methods of quality control are no longer applicable. Therefore, big data brings a turning point for breaking through these dilemmas in industrial production. In workshop production, the data collection cycle is usually in seconds, and the amount of data generated in the long run is very large. Through these big data, we can analyze the entire production process and improve the process. However, by using a variety of data mining and analysis methods, it is also possible to model the production process of the product, simulate and optimize the production process. At the same time, it can also explore how process parameters affect processing efficiency and product quality, so as to further monitor and optimize. At the same time, methods of quality control are constantly evolving. Quality control is a systemic issue involving many factors such as environment, equipment, operators, materials, design, and processes. Therefore, it is dynamic and uncertain. With the increasing complexity of products and processes, manufacturing systems and supply chains, it is difficult for traditional quality management methods to meet production requirements. Statistical analysis methods based on sampling, such as statistical process control (SPC), have been widely used for quality control due to its practical operability and simplicity [4]. However, the sampling process will produce information distortion, because only part of the data is used to represent the entity. Therefore, in the application of industrial manufacturing, quality control is still in its infancy. At this stage, big data analysis has gone further than the traditional statistical methods in the past and developed a data analysis method that combines a variety of algorithm models such as machine learning. Therefore, trying to apply the currently popular data mining algorithm to quality control in the industrial field will bring great benefits.
Related work
The bottom data collection of equipment in manufacturing factories is the foundation and important link of the Industrial Internet of Things. In the era of the Internet of Things, in the process of product manufacturing, real-time monitoring of equipment status data and production data in the processing process is required, including equipment operating status, crankshaft running speed, working environment temperature and humidity, product output and production data, etc. Therefore, data collection has become the primary task. Data collection refers to the process of automatically collecting multiple (non-) power signals from intelligent collection devices [5], including various sensor signals, or the amount of information in other analog or digital measured units. After the signal is converted and transmitted, it is sent to the host computer for analysis and processing to provide data support for the factory’s intelligent decision-making. In many process manufacturing industries, the automation and intelligence of production lines are the focus of attention. In terms of device control, distributed control systems (DCS) or programmable controllers (PLC), etc. are usually used, and a variety of data interfaces and communication protocols are integrated. At the same time, a large number of various types of intelligent instruments and industrial sensors are used to record the production process data in detail.
The literature [6] provided a variety of data collection schemes based on OEM software with data monitoring and collection devices based on the specific conditions of industrial field CNC systems, and used HMI and FOCAS software packages to collect data from Siemens CNC systems. Similarly, the literature [7] designed a low-level data collection module through the combination of Internet of Things technology, and established a system framework with collection, storage, monitoring, and analysis in one. The literature [8] used the RFID radio frequency identification in the Internet of Things technology, and the barcode and QR code scanning technology to collect the operating parameter data of the CNC machine tool. The literature [9] has designed an embedded data acquisition device, which realizes the collection of machine tool operating current signals by externally embedded sensors, and at the same time the PLC controller realizes the collection of data such as machine tool working status and tool change information. The literature [10] adopted the industrial communication standard based on OPC UA to design a set of flexible production management and control system that can quickly connect the equipment to the system through configuration, providing a solution for rapid equipment acquisition and data storage application for flexible production. In order to solve the problem of disagreement of industrial data interface, the literature [11] unified Modbus and Profibus protocol, established OPC UA standard interface, and developed a universal data acquisition module. Aiming at the problem of remote device data collection, the literature [12] combined with Web technology proposed an OPC standard interface. Moreover, in order to make up for the shortcomings of current remote device information collection, the literature proposed a remote data collection system architecture, and designed an interface-standard collection scheme to realize remote data collection monitoring and information sharing between remote platforms. The literature [13] proposed a scheme called CyberOPC. The scheme includes a new open communication system for remote control of industrial CNC machine tools, which is used to realize remote monitoring of industrial machine tools. This scheme makes the transmission delay of time node control data shorter than other solutions and meets network security requirements. In addition, there are many other pioneers who have also done a lot of design and development work, such as the development of SCADA collection platform based on MES system [14] and related data monitoring and application work in storage and transportation aspects such as warehouses [15]. After the completion of the underlying data collection, the need for data visualization, real-time display and detection of data through man-machine interfaces, etc., to complete the convenience and comprehensiveness of production management and control [16] can be further considered. In this regard, literature [17] used QT to design a set of interface and functions of configuration monitoring software to be used in actual production applications. The literature [18] and the literature [19] have designed a set of equipment monitoring system to monitor the production of CNC equipment in the workshop in real time. Their work brought industrial production into the information age, obtained previously unknown information from data, and realized data-driven production.
Machine learning algorithm
Boosting method is a kind of ensemble learning method. Integrated learning is a machine learning technique that can be used for regression and classification problems. Its basic idea is to combine several simple models to form a complex model to complete the learning task. The advantage of this is that combining multiple models can achieve better results than a single model and improve the generalization ability of the entire model. Its general structure is shown in Fig. 1 [20].

General structure of integrated learning.
The basic step of the lifting algorithm is to learn an initial weak classifier from the initial training samples, and then determine the distribution of the training samples in the next learner according to the performance of each sample in this weak learner. The principle is that the wrong sample gets more attention, and the correct sample gets less attention. After that, the model will continue to learn the next weak classifier according to this principle until the value of the loss function reaches the set threshold or the change of the loss value is not large, and the learning is completed. Finally, all the weak classifiers are weighted and combined to obtain the final model. Therefore, in the process of model algorithm training, the distribution of samples is always changing [21].
The lifting tree algorithm takes the decision tree as the basis function and performs addition operations on it:
In the above formula, T (x, θ
m
) represents the mth decision tree, θ
m
is the parameter of the mth tree, and M is the total number of trees. The initial tree f0 (x) = 0 is assumed, and the m-th tree can also be expressed as [22]:
Among them, fm-1 (x) is the model that has been learned when generating the m-th tree, then the parameter
In the formula, N is the number of samples. L (y, F (x)) is the loss function, and its typical definitions are:
or
Formula (4) is called mean square error loss, and formula (5) is called absolute error loss.
After the θ
m
parameter is determined, a lifting tree model composed of m trees can be obtained, which can be obtained by formula (2) and formula (3),
It can be seen that this way of minimizing search is similar to the greedy algorithm.
Commonly used lifting trees are AdaBoost, GBD, XgBoost and LightGBM, etc. The main difference between them is the loss function used by the model. Among them, the gradient boosting decision tree (GBDT, Gradient boosting Decision Tree) is a commonly used lifting tree method, and the idea is that the model parameters are updated in the opposite direction according to the gradient value of the loss. This view of gradient promotion in the function domain has a profound influence on many ideas of machine learning. Both XgBoost and LightGBM can be regarded as an efficient implementation of the GBDT algorithm, and their model bases are similar. The gradient lifting algorithm is similar to the general lifting algorithm. Its idea is to use the negative gradient value of the first derivative of the loss function to represent the real loss value, and to reduce the gradient as the goal to optimize the model, and finally achieve the purpose of reducing the loss value. Therefore, formula (6) can be rewritten as,
Among them, γ
m
is the learning rate, the best learning rate value can generally be obtained using linear search,
Based on the above introduction, if the number of decision trees is increased indefinitely, so that the value of M tends to infinity, the fitting results of the model can be infinitely approximated to the true distribution of the data, and then the model with very high accuracy can be obtained. However, when the model becomes very complicated, on the contrary, it will reduce the generalization ability of the model, resulting in the problem of overfitting. Therefore, in addition to the model itself, regularization techniques are generally needed to reduce overfitting. Regularization techniques generally add the regular term Ω (T) after the loss function [24–26].
Generally, the complexity of the model is proportional to the number of leaf nodes K or the square of the leaf node score ω, therefore,
Here, both μ and λ are hyperparameters of the model, which is used to control which aspect of the model’s complexity is more inclined.
In addition to adding regular terms to the loss function, it is also possible to reduce the complexity of a single tree by pruning the decision tree to reduce the complexity of the entire model. We set the number of leaf nodes of tree T to |T|. t represents the leaf node of the tree T, and the leaf node is set with N
t
sample points. Among them, there are N
tk
sample points of the k class, k = 1, 2, ⋯ , K, H
t
(T) are the empirical entropy on the leaf node t, and α ⩾ 0 is the parameter, then the loss function learned by the decision tree can be defined as:
Among them, the experience entropy is:
The lth term at the right end of Equation (11) is written as:
At this time, there are the following results:
It can be seen that when the complexity of the model is higher, the smaller C (T) is, the better the fitting effect of the model is. However, |T| will increase, resulting in a large C α (T). When the model is relatively simple, the complexity of the model will be small, then |T| becomes smaller, but the value of C (T) is larger, and the effect of the model is relatively poor. Therefore, there is a trade-off between the effect of the model and the complexity of the model. Pruning means that when α is determined, the effect and complexity of the model are in the best state, that is, the loss function is minimized. Among them, α controls the influence between the two.
The specific method of pruning is to first calculate the empirical entropy of each leaf node, and then calculate the empirical entropy of its parent node in turn. The tree before the leaf node backtracks to the parent node is assumed to be T A , and the tree after the backtracking is T B . If C (T A ) ⩾ C (T B ), pruning is performed to make the parent node a new leaf node. This is repeated until the tree structure with the smallest loss function value is obtained.
In addition to the two methods described above, there are many strategies that can be used to control the complexity of the model, such as the maximum depth of the control tree, the maximum number of leaf nodes in a tree, the minimum number of samples contained in each leaf node, and so on.
Recurrent Neural Network (RNN, Recurrent Neural Network) is one of many network structures in deep learning. Because of its excellent “memory", it stands out among many deep network structures and has become one of the most popular deep learning networks.
The structure of the RNN is shown in Fig. 2, which is to “remember” the previously learned information by adding a connection to itself between the hidden layer neurons themselves, and then learn the timing information between the data. x t is set to represent the input at time t, h t is the hidden layer output, o t is the output, u is the input matrix, and w is the hidden layer transfer matrix, then:
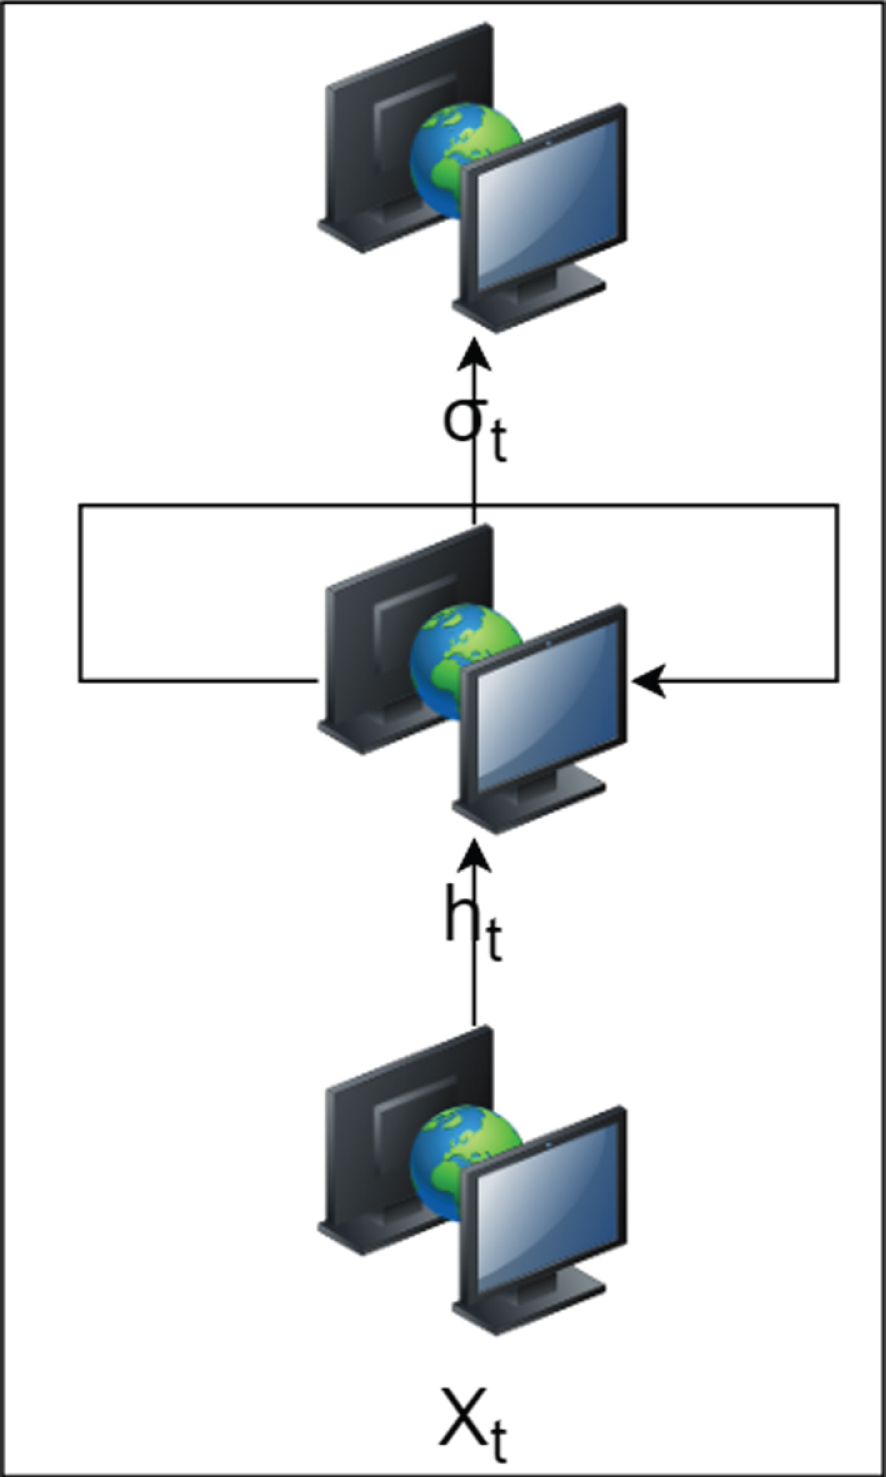
RNN basic structure.
Among them, φ is the activation function, b is the bias term. We set V as the output matrix, then the output at time t is:
The predicted output of the final model is:
Among them, σ is the activation function. If it is used in the classification problem, a softmax function will be added at the end.
The above introduction is the most primitive RNN model structure, also known as Vanilla RNN. There are many variants of the RNN model structure. The reason for the emergence of so many variants is that the traditional recurrent neural network structure will have a gradient disappearing phenomenon during the model training process, resulting in no information being learned. In order to solve this problem, a Long Short-Term Memory (LSTM) structure is proposed to solve the gradient dispersion phenomenon. LSTM can be regarded as a variant of the traditional RNN network structure, which introduces three gates structure to achieve protection and control information. These three gates are called forget gate, input gate and output gate respectively, and their network structure is shown in Fig. 3. Among them, the forget gate is controlled by a sigmoid function to determine how much information can be passed through,
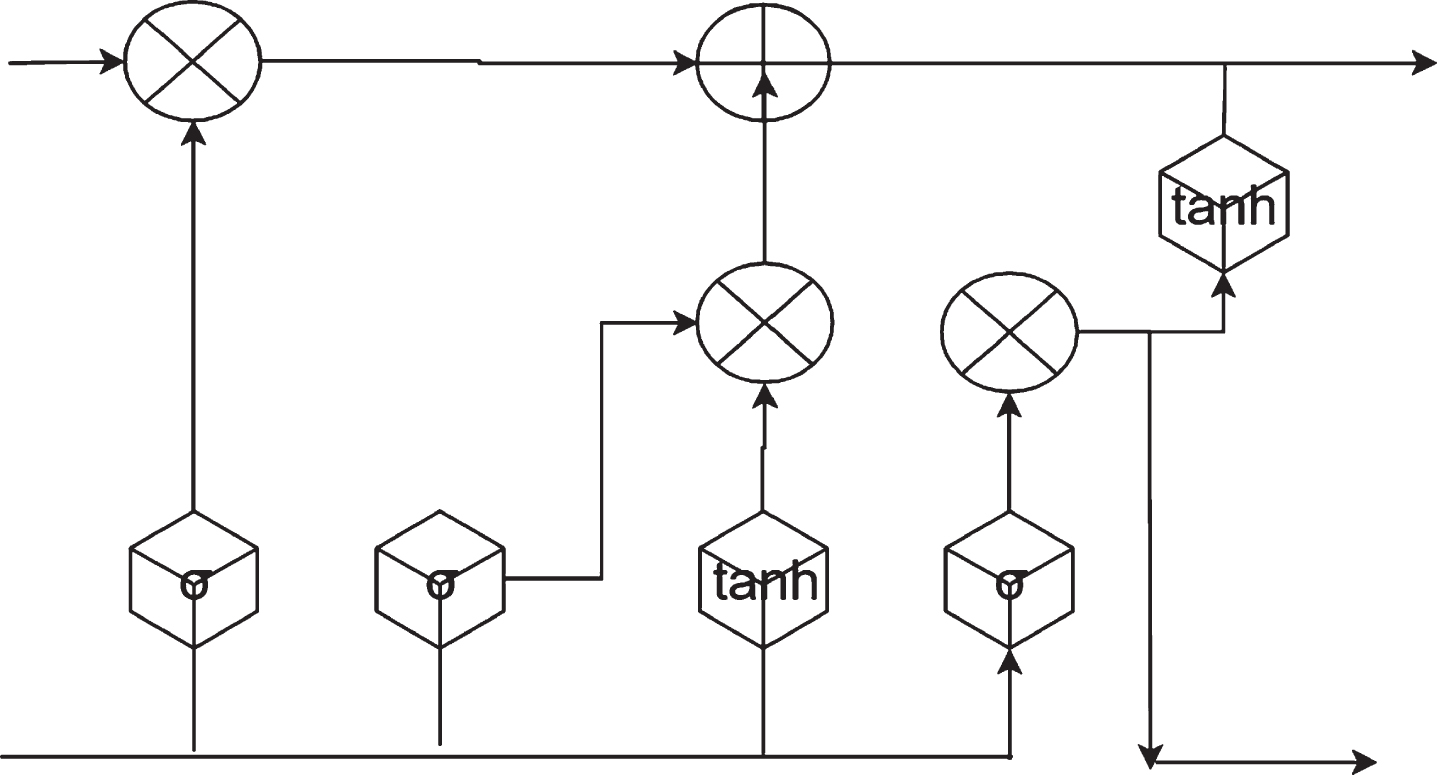
LSTM model structure.
The input gate determines how much new information is added to this study. There are two parts here. First, a sigmoid layer is used to determine what information needs to be updated, and then a tanh layer is used to generate a vector for the updated content.
Finally, the combination of old and new information is the final input information,
After receiving the input information, the output gate will first normalize the values between -1 and 1 through a tanh layer, and then still use a sigmoid layer to determine which part of the information of C
t
will be output, and get the final output h
t
.
In addition to LSTM, there is a more famous RNN variant GRU (Gated Recurrent Unit). GRU can be regarded as a simplified version of LSTM, because it also uses a gate structure, but there are only two kinds of gates: reset gate and update gate, as shown in Fig. 4. Among them, r
t
means heavy Set the door, and z
t
means update the door. The reset gate is used to control the proportion of the information output by the front unit,
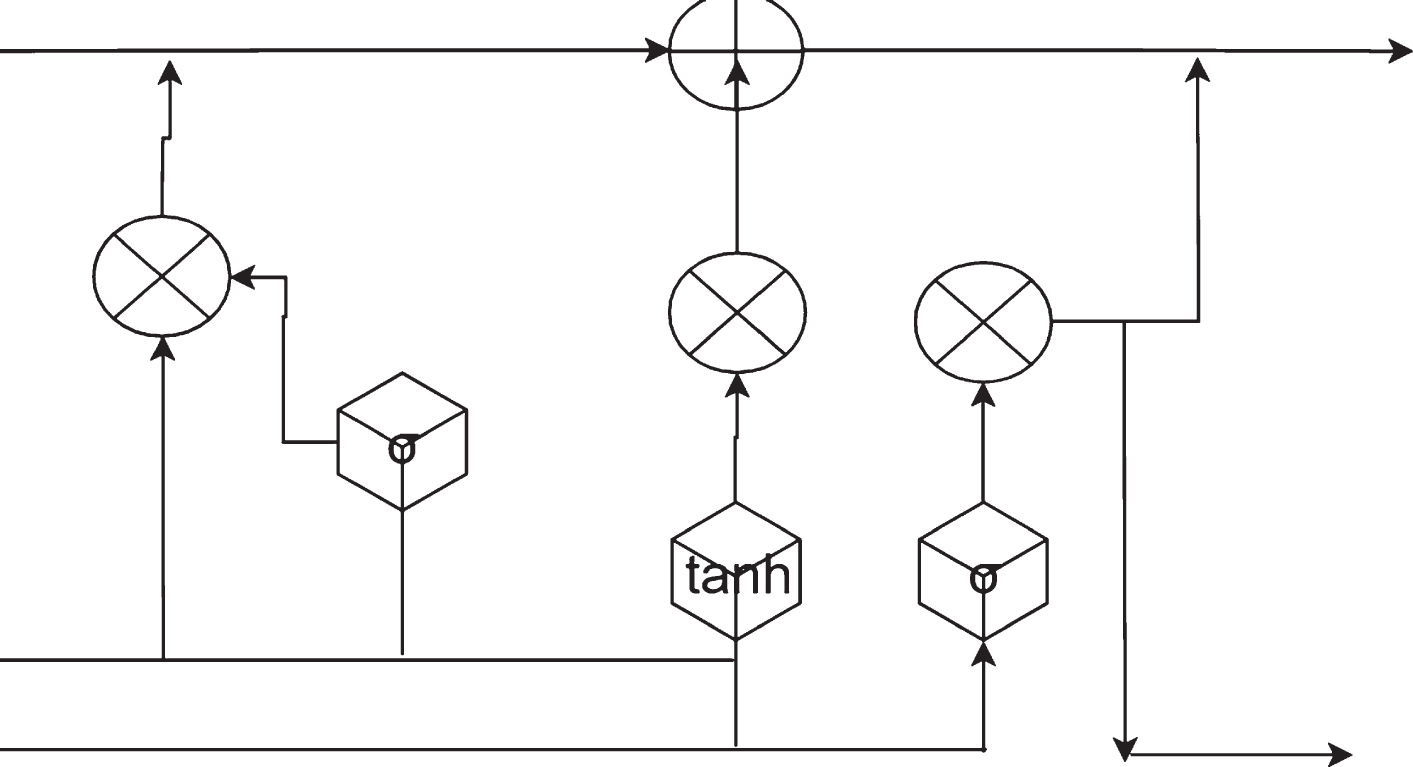
GRU model structure.
The output of Equation (24) will constrain the value between -1 and 1 through the tanh layer to obtain
The update gate determines the ratio of the new information
The overall architecture of the IoT gateway software is shown in Fig. 5.
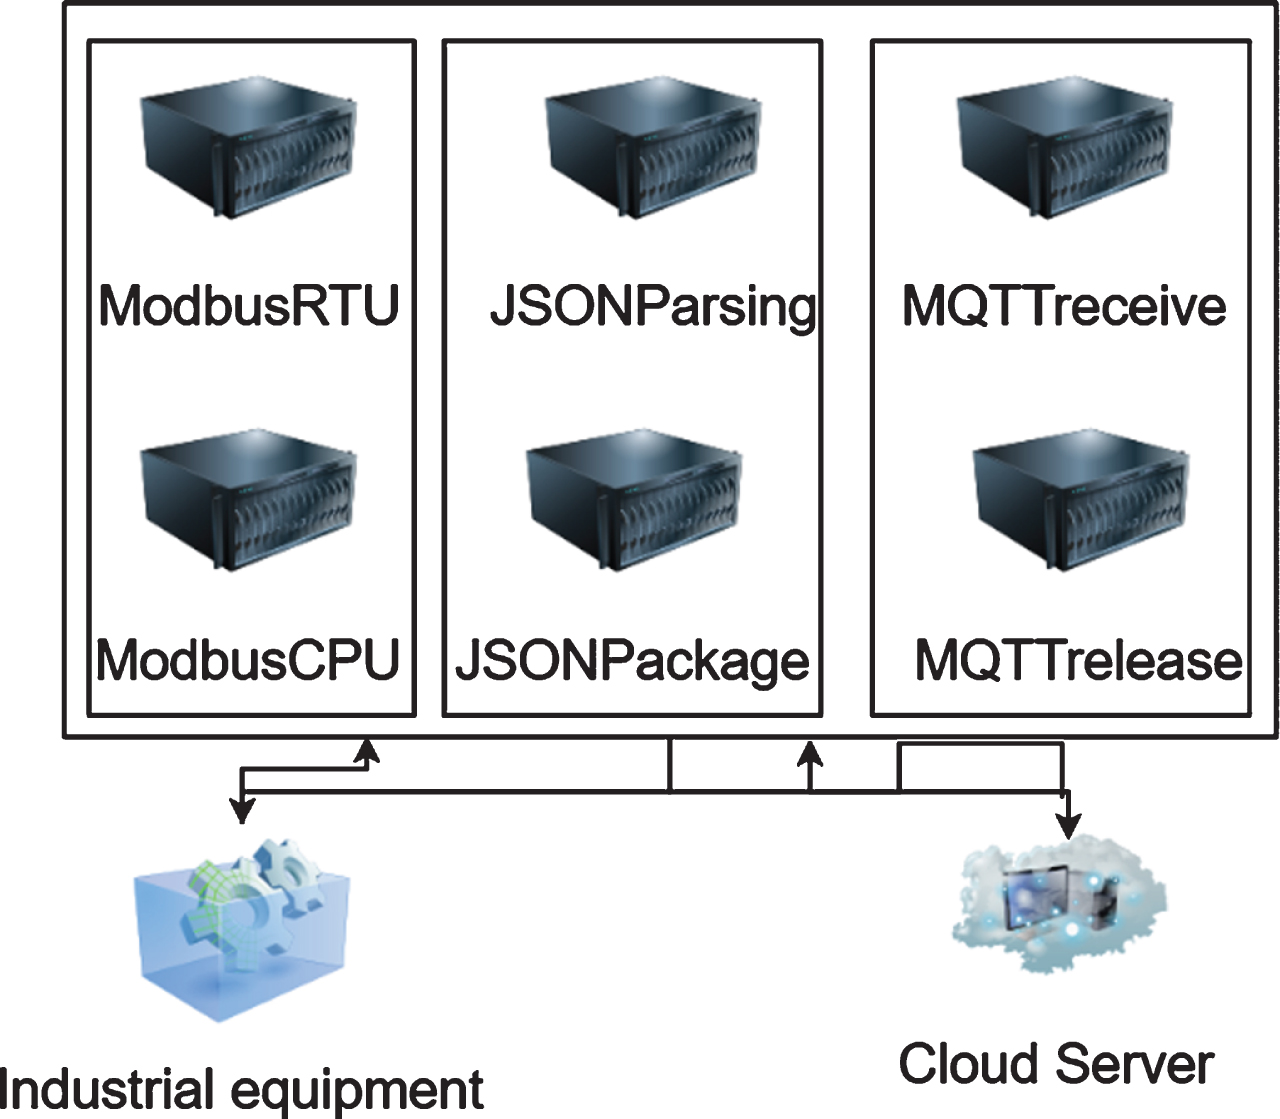
Overall architecture of IoT gateway software.
Modbus module. Industrial equipment and sensor equipment are connected to the Internet of Things gateway through the RS-485 bus interface or network port, and the data collection is carried out through the corresponding ModbusRTU protocol or ModbusTCP, such as equipment operating status, equipment data and other parameters. JSON data format packaging and parsing module. It is used to connect the lower layer data collection module and the upper layer data subscription/release module, use the parsing function to parse the protocol data packet of the upper layer subscription/release module, and identify the Modbus protocol mode collection mode. Moreover, it adopts the RS485 serial port or TCP network port collection mode, resolves the protocol address to determine the device node, and determines whether the Modbus module function mode is data collection or device control. The encapsulation function encapsulates the protocol point data collected by the bottom layer module into a JSON format data packet and provides the upper layer module to transmit the data packet. MQTT module. When the user (Web or APP) needs to actively obtain the data of the Internet of Things gateway, the client must first subscribe to the data response topic of the Internet of Things. By posting the current Internet of Things request topic, the Internet of Things requires subscribing to the client’s request topic in advance, and finally the client sends the topic to the MQTT proxy server. The server pushes the message to all Internet of Things subscribed to this request topic. After the Internet of Things receives the message, it extracts the content of the message and sends the corresponding data to the server. The MQTT proxy server sends this message to the client who subscribes to this topic, and finally the client decapsulates the message to obtain the monitored data. The post/subscribe flow chart of the MQTT module is shown in Fig. 6. MQTT module post/subscribe flow chart.

Qos guarantee mechanism refers to an algorithm that optimizes data communication. The algorithm analyzes the network data stream obtained through the hardware device to determine the accuracy and timeliness of the data. For example, it analyzes the communication protocol to select the retransmission time, whether to lose packets, negotiate the size of the communication window, etc. It is a communication guarantee algorithm. When the network is in a normal communication state, the Qos guarantee mechanism is an algorithm for filtering abnormalities, which does not interfere with or affect normal communication. When the network is overloaded or congested, the QoS guarantee mechanism can choose to discard data frames or require retransmission of key data frames while ensuring that important traffic is not delayed and ensure the efficient operation of the network. The goal of the Qos mechanism in the system is to design a set of communication schemes to ensure that UDP can still be controlled in a packet loss environment, and that packet loss does not occur in multiple consecutive cycles. Moreover, it needs to achieve a combination of fast sending and receiving and stable retransmission of supplementary packages. The outline of the plan is: The outline of the scheme is to use UDP communication for normal communication and TCP communication for supplementary packet retransmission. The key principle of the scheme design is the characteristics of fast communication using UDP communication and the characteristics of reliability transmission using TCP transmission. Through the tacit cooperation between TCP and UDP in the application, the communication of the platform is in a stable and high-speed state. The Qos design mechanism of the strong real-time communication platform will now be described. First, the technical terms of the Qos technology supporting strong real-time performance are explained below. In real-time applications, the strong real-time industrial Internet of Things communication platform will be equipped with an embedded communication host, and its function is designed to send data in milliseconds. The operation of the strong real-time communication platform (hereinafter referred to as “communication platform") is configured on an ordinary computer with Windows 10 operating system, quad-core processor, and 4 G memory.
The performance of the industrial cloud platform system is tested, which is divided into the test of the client and the joint debugging test analysis of the entire gateway system. We test whether the client can see the monitoring data, and test whether the Internet of Things gateway data is sent and received normally. Moreover, we test whether the joint debugging work and expected results among the individual modules can be agreed to ensure the feasibility and stability of the entire industrial energy consumption cloud platform system.
In order to intuitively feel the data collection and control functions, two simulation software, mqttfx and ModbusSlave, are used. The mqttfx is used to simulate the Web side or the mobile phone side to receive and send industrial equipment data. In practice, the data sent by the user to the server is the same as the data we send in the mqttfx software. Modbus Slave is used to simulate industrial equipment data, in which the equipment protocol address represents the equipment acquisition or control communication protocol point to be collected. For example, when we need to collect the three communication protocol points of humidity, temperature and pressure of the central air conditioner, we need to set three protocol addresses in ModbusSlave software, As mentioned above, the highest bit of the communication protocol point represents the function code type of Modbus. “4” represents the data collection function of the IoT gateway, and “5” represents the data control function of the IoT gateway.
During the operation of the entire system, the working status and performance parameters of the terminal equipment are collected and uploaded by the specifically configured sensors and stored in the database. We need to analyze these data. On the one hand, we draw a histogram of the data and fit the measured data of a certain parameter to find the corresponding distribution. On the other hand, we use model analysis to determine whether there is correlation between different parameters. If there is a correlation, we need to determine what kind of correlation (linear or curve) is specifically met. Taking the temperature control system as an example, in order to verify the real-time monitoring function of this research system, the temperature of a certain device is monitored in real time, and a 48 H temperature curve is drawn. Moreover, the obtained data is compared with the measured data of the equipment maintenance personnel, and the obtained results are shown in Table 1 and Fig. 8.
Statistical table of equipment temperature monitoring

Simulation system test composition diagram.
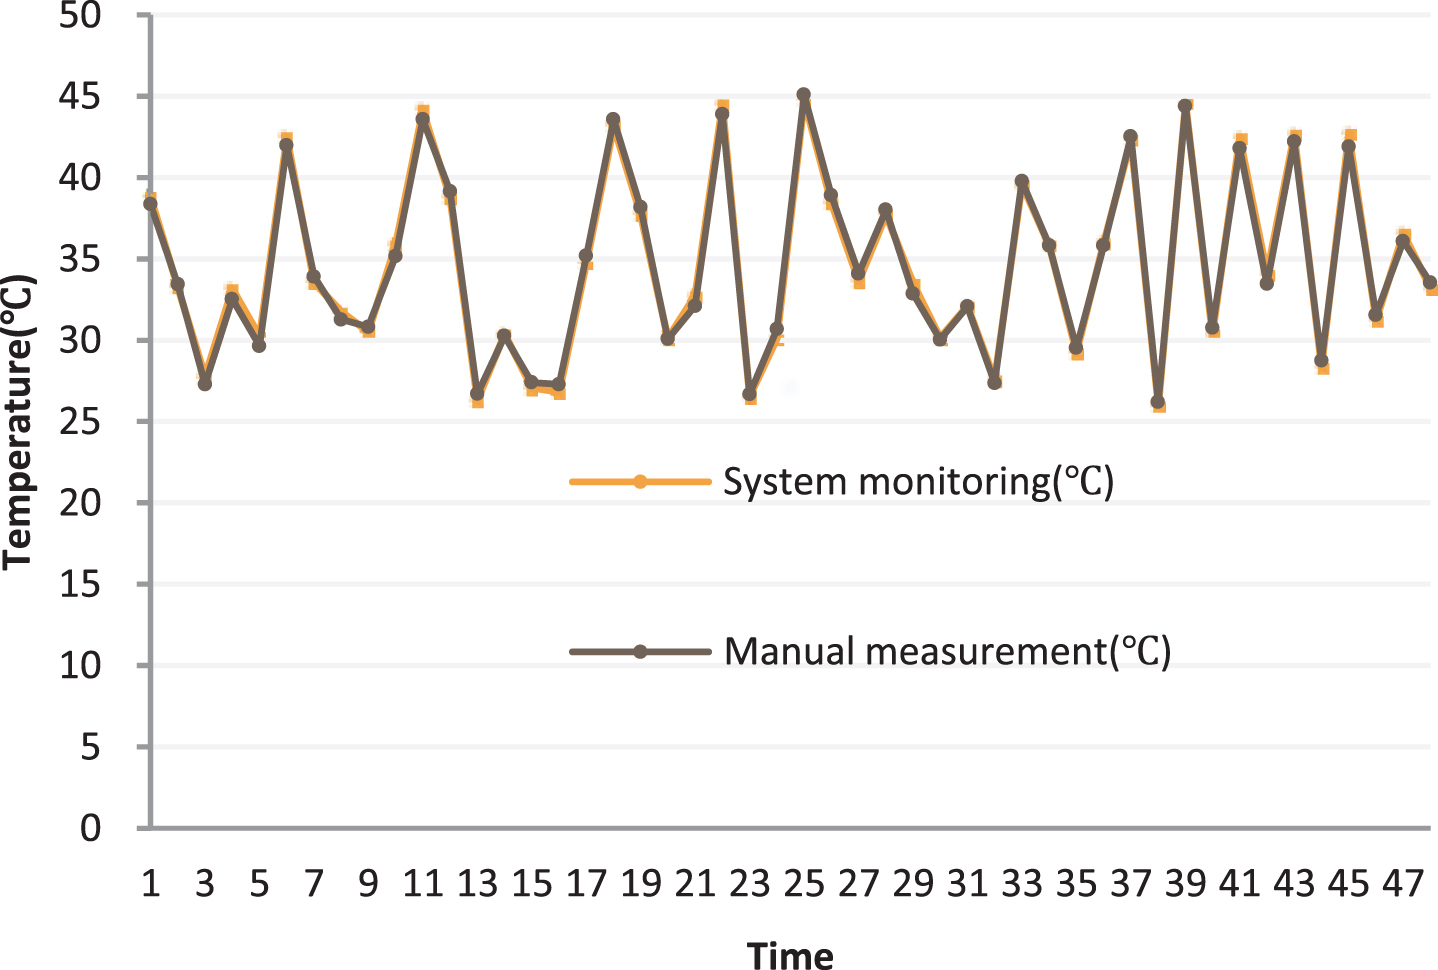
Statistical diagram of equipment temperature monitoring.
As shown in Fig. 8, the results obtained by manual measurement and control and Internet of Things system monitoring are basically the same, and the error is negligible.
Next, a systematic test of multiple sets of data is carried out. In this paper, a variety of industrial data are collected, a total of 70 sets. The data is collected through system statistics and compared with the manually collected data to determine the accuracy of the data. The results are shown in Table 2 and Fig. 9.
Statistical table of IoT test results of industrial data

Statistical table of IoT test results of industrial data.
As shown in Fig. 9, the accuracy of the Internet of Things detection of industrial data is higher than 98%, and this accuracy rate can already meet the normal needs of industrial production. The main reason for the accuracy rate not reaching 100% is the problem of test equipment. When it is officially applied to industrial production, its accuracy rate will certainly reach 100%. It can be seen that the industrial Internet of Things system based on machine learning and artificial intelligence technology constructed in this paper has certain practicality.
This study analyzes the functional modules to be realized by the IoT gateway, selects the main chips of the IoT gateway, and finally designs a complete set of IoT gateways. Moreover, this study completed the establishment of the IoT gateway environment and transplanted the Linux system and 4 G module. In addition, this research deeply understands the Modbus protocol and MQTT protocol and designs a Modbus protocol and MQTT protocol fusion IoT gateway software to improve the real-time performance of the industrial cloud platform system as a whole. Finally, this research uses CGI related technology and Web to complete the initial configuration of the Internet of Things gateway. In order to meet the current needs of the manufacturing industry for remote monitoring of industrial equipment, in-depth research is conducted. Aiming at the characteristics of diversified, scattered layout and numerous parameters of manufacturing equipment, as well as the complexity of the high temperature, high pressure and chemical environment in which the equipment is located, a remote monitoring and data analysis system for industrial equipment based on the Internet of Things is designed and implemented. In addition, according to the application scenarios of the platform prototype system and the actual aeronautical weather floating platform test platform, this study designs and implements a set of strong real-time communication test platform based on the Windows operating system. The test results show that the industrial Internet of Things system based on machine learning and artificial intelligence technology constructed in this paper has certain practicality.
Footnotes
Acknowledgments
This research has been financed by The Henan Provincial Department of Science and Technology Research Project in 2018 “Substation Intelligent Patrol Service Robot” (No:182102210600).