
Abstract
The existing stand-alone multimedia machines and online multimedia machines in the market have certain deficiencies, so they cannot meet the actual needs. Based on this, this research combines the actual needs to design and implement a multi-media system based on the Internet of Things and cloud service platform. Moreover, through in-depth research on the MQTT protocol, this study proposes a message encryption verification scheme for the MQTT protocol, which can solve the problem of low message security in the Internet of Things communication to a certain extent. In addition, through research on the fusion technology of the Internet of Things and artificial intelligence, this research designs scheme to provide a LightGBM intelligent prediction module interface, MQTT message middleware, device management system, intelligent prediction and push interface for the cloud platform. Finally, this research completes the design and implementation of the cloud platform and tests the function and performance of the built multimedia system database. The research results show that the multimedia database constructed in this paper has good performance.
Introduction
Since the beginning of the 21st century, with the popularization and application of new media and data technologies, the use of modern multimedia technology for teaching activities has become the norm, especially in colleges and universities. The increase in the number of multimedia classrooms provides strong technical support for teaching activities and improves the quality of teaching from a technical level. However, it also poses challenges to management and maintenance work [1].
This subject comes from the enormous work pressure and challenges brought by the ever-expanding multi-media classrooms of colleges and universities to the administrators of the modern education technology center of the school under the background of educational informatization. The continuous development of new media technology has promoted the development of modern educational technology, and also put forward higher requirements for modern educational technology workers. The continuous updating of educational technology and the improvement of the functionality and operability of multimedia classrooms have created favorable conditions for the application of modern educational technology in colleges and universities. Using multimedia equipment to develop and serve modern teaching has become a common phenomenon, and then developed into a new teaching model. Since moving to the new campus, the number of multimedia classrooms in the school has grown rapidly, and so far, there are hundreds of classrooms. Since our school moved to the new campus in 2010, multimedia teaching has been highly valued by the leadership of the college. The school has also increased related investments, and the number of classrooms has increased from 44 to 200. The number of multimedia classrooms in the Deye Building (Central Teaching Building) alone is as many as 94. The development and application of modern teaching technology has promoted the development of multimedia classrooms. However, the rapid growth of the number has brought great challenges to the management of daily teaching equipment, and the limitations of the management level have become increasingly prominent. Class teachers are usually direct users of multimedia classrooms. However, the 94 classrooms in Deye Building are distributed on the six floors of A and B, which makes the daily management of multimedia classrooms difficult and puts a test on the personal management level of managers. Moreover, it is difficult to do all equipment pre-checks before use. In addition, the manpower is becoming increasingly tight. Due to the lack of modern management methods, it has caused excessive investment in management and maintenance, increased management costs, consumed more management resources, and the results were unsatisfactory. How to improve the efficiency and effectiveness of management and maintenance has become the focus of multimedia classroom management. When the traditional management methods are outdated, managers still use the traditional registration book method to register the statistics of the multimedia classroom feedback information, resulting in a low level of communication between managers and users. It not only increases the cost input, but also affects the quality of teaching. Therefore, the efficiency of management and maintenance must be improved from a technical perspective. In particular, how to detect, locate, and display equipment failures is an urgent problem to be solved in the current multimedia classroom management [2]. The Internet of Things refers to the use of information sensing equipment on the Internet platform to collect and receive information related to objects or activity processes to enable the information of various objects to be transferred between networks and to enable them to communicate in a true sense under a huge network. The real role of the Internet of Things is to enable information communication between objects, objects and people, and objects and networks at any time, to facilitate the identification and management of objects under the network, and to effectively monitor the status of objects [3]. This research focuses on extending the concept of “Internet of Things” and integrating WSN (Wireless Sensor Network Technology) into the campus LAN. Moreover, this study uses radio frequency identification technology (RFID) to read the identity information of teachers and students (campus card electronic tags), and then combined with sensor network nodes to manage multimedia classroom equipment. In addition, this study uploads data to the server through the wireless sensor network to complete the management of the classroom.
Related work
So far, some countries in the world led by the United States, including Japan, South Korea, and the European Union, have been at the forefront of research in the Internet of Things industry, and the development of Internet of Things technology in some countries such as France and Austria has also been rapid. In most of these countries, the Internet of Things is included in the national plan and embarked on pilot and implementation. Moreover, they all hope that the Internet of Things industry can promote the new growth of the national economy [4]. The World Summit on the Information Society (WSIS) was held in Geneva. This conference provides an international permanent discussion and consulting organization for the Internet of Things researchers, that is, the Ubiquitous Network Society International Expert Working Group [5]. The working group was established by the International Telecommunication Union. In the United States, many well-known universities are studying WSN, including the famous Massachusetts Institute of Technology and the University of California, Berkeley and Los Angeles. The research and experiments of these universities in the Internet of Things are mainly concentrated in the fields of wireless sensors, self-organizing sensor networks and the formulation of related protocols and system applications. For example, the multi-mode wireless sensor (MuSE) multi-chip module developed by Rutgers University, the low-power and low-cost MEMS motion sensor developed by the University of Florida and the thermal infrared (IR) wireless MEMS sensor developed by Urbaba-Champaign University in Illinois. These technologies have laid a good foundation for the development of the Internet of Things [6]. In addition, some well-known large companies are also major players in the research of wireless sensor networks. The first well-known company in the world to study wireless sensor networks is Crossbow, and it has established partnerships with well-known companies and universities such as Intel, Microsoft, Honeywell, and the University of California, Berkeley. The wireless sensor technology solution they designed was adopted by many universities and large companies around the world [7]. “Smart Dust” (SMARTDUST) is listed as a key R&D project by the US Department of Defense. The National Science Foundation also regards the formation of sensor subnets on the next generation Internet as an important part of the “Global Network Environment Research” (GENI) project [8]. The US Act proposed to invest heavily in the development and application of Internet of Things technology in the fields of medical care and energy, and to use the Internet of Things and new energy as the two core weapons for the United States to revitalize the economy and get rid of the financial crisis. At the national level, the United States is constantly advancing corporate restructuring in the field of information technology and consolidating its monopoly position. Moreover, the United States attempts to continue to fully control the root server of the next-generation Internet (IPv6), and also strives to promote the EPC standard system worldwide. In addition, it seeks to lead the development of the global Internet of Things to ensure the US’s international information control status [9]. The development of informatization in Europe lags behind the United States. However, Europe has always been unwilling to fall behind. The European Commission has announced the “i2010” policy framework, which is the EU’s information and communication policy framework for the next five years. The framework states that the EU must integrate different terminal devices, communication networks, and content services to meet the arrival of the era of digital convergence and adapt to the growth of the global digital economy [10]. The European Commission and its presidency co-sponsored the European Information Society Conference with the theme “i2010-Creating a Ubiquitous European Information Society” [11]. From 2007 to 2013, the European Union has invested 53.2 billion euros in research and development funds in order to promote the research of the European Union’s 7th EU research framework (EU-FP7) [12]. One of the largest research areas in the EU-FP7 plan is the research and development of information and communication technologies [13]. The relevant functional departments of the European Union adopted the “European Internet of Things Action Plan". The core idea of the plan is to ensure Europe’s leading role in the global Internet of Things construction strategy [14]. In Japan and South Korea, from the end of the last century, in order to promote national economic and social development, the Japanese government has successively formulated a number of information technology development strategies. The more influential ones are E-Japan, U-Japan, I-Japan and so on. U-Japan and I-Japan’s strategy focuses on the development and application of Internet of Things technology [15]. In response to the new round of the “U” strategy of the global information industry, South Korea also established the u-Korea strategy shortly after Japan proposed the u-Japan strategy in 2006. The strategy intends to widely deploy IoT infrastructure and network construction nationwide, integrate existing IoT new technologies into it to serve people’s livelihood, and bring revolutionary progress to national life and culture [16]. Compared with the informatization strategies proposed by various countries and regions, they have relatively similar characteristics. The common points are summarized as follows: using multiple information technologies as support, cracking the limitations of the mobile Internet, integrating objects into the information network, constructing the Internet of Things, and effectively promoting and applying the Internet of Things technology [17]. Among them, the United States and South Korea focus on the development of sensor and network applications such as sensing technology and infrastructure construction, especially on the structure of smart infrastructure, the EU emphasizes the promotion and application of radio frequency identification, and attaches great importance to information security, and Japan plans to use e-government and social information services and other information applications as development Heavy [18]. The launch of the plan marks that IoT-related technologies and industries have become the common focus of the world’s economic development and has gradually been widely deployed around the world.
Machine learning algorithm
Naive Bayes aims to calculate the value of, that is, under the probability that the B event has occurred, the probability of the A event occurring is obtained. In the classification model, B belongs to the observed sample data, and A belongs to the predicted sample category, which means that P (A|B) calculates the probability that B is the category A. The essence of Naive Bayes is to describe the model through data by counting, that is, according to the data we have, the parameters of the model are constantly updated, and finally the probability of the category to which the predicted sample belongs is calculated according to the trained model [19].
The expression of the Naive Bayes formula is as follows:
In the formula: P (C j |D) -the probability value of the category C j of the document D to be classified;
P (D|C j ) -the probability of D documents appearing in category C j ;
P (C j )-the probability of randomly selecting a document belonging to category C j ;
P (D) -the probability of a certain document appearing.
P (D) in the formula is a constant term, and the value is the same for each category. In actual calculation, you can omit the calculation term. The important point is to calculate the probability that the document belongs to each category, and then the category with the largest value is regarded as the category to which the document belongs [20].
Naive Bayes Although Naive, that is, the premise of the algorithm is to assume that the sample’s feature attributes are completely unrelated, but in practice, the features are usually not completely independent of each other. Although Naive Bayes has its own drawbacks, this algorithm is still popular in various enterprise applications due to its fast classification speed, low computational complexity, and good results.
Regression model. The model establishment is also divided into two steps: one is the learning process, and a reliable model is obtained by inputting training data. At the same time, the other is the prediction process, which predicts the results of the training data. Linear regression model is one of the commonly used regression models. It predicts the results of unknown data according to the determined functional relationship [21].
The expression of the linear regression model is:
In the formula:
ω-weight matrix;
x i -sample point;
b-offset.
You can input the x value through the model and predict the y value. In order to make the prediction result more accurate, that is, the cost function J (ω) is established to make the difference between the predicted value f (x) and the known real value y as small as possible. The cost function is also called loss function [22].
The expression of the linear regression model is brought into the loss function to get:
Least squares is used to optimize the cost function, and through continuous iteration, a curve that best fits the training data is found. It is assumed that the function is optimal and the cost function is 0, the partial derivative is solved and the system of equations is solved [23]:
Because the function obtains the extreme value when the partial derivative is 0, we set the above equation to be 0 and solve the equation system to get:
In the formula:
From this, the optimal parameter A of the linear regression model is obtained, and the initial formula can be used to obtain the model expression. In addition, in order to make the model more versatile, that is, the model has a certain fault tolerance, it is necessary to add regular items to the model [24].
The Internet of Things can be said to be the collection and sharing of data between connected devices, and artificial intelligence will extract the data and make analysis and summary to promote better portability between connected devices. The combination of the Internet of Things and artificial intelligence will make the collected data more meaningful [25].
The fusion technology of the Internet of Things and cloud computing and artificial intelligence has gradually matured. IoT devices send data to the cloud through message middleware, and the cloud provides data storage, parallel computing and other technologies [26]. Combined with Hadoop big data platform tools, it provides users with three basic services: IaaS (Infrastructure as a Service), PaaS (Platform as a Service), and SaaS (Software as a Service).
Random interpolation can be divided into two categories: hierarchical random interpolation and random regression interpolation [27]. Among them, the expression of random regression interpolation is as follows:
In the formula:
αk0,1,2⋯k-1-offset matrix;
βkj12⋯k-1-the parameter matrix of sample point y ij ;
e ik -subject to zero mean, independent and normal distribution with the same variance.
In the regression model, the previous variables are used as auxiliary variables to establish an appropriate regression model and predict the missing value Y
j
. The model expression is:
In the formula:
Y j -predict missing value;
β0 ⋯ βj-1-regression parameters of different characteristics of known data.
According to the explanatory variable X of Y, the corresponding variance matrix is
In the formula:
Y*j-Predicted interpolation value
z i -Normal deviation.
The outliers in the data set are usually called “outliers”. For the determination of outliers, there are usually the following: Simple statistical analysis: After getting the data, you can do a simple statistical analysis on the data, and then remove the abnormal points according to the set threshold. For example, you can set the age of the person to be between 0 and 120 years old. Data exceeding this range is determined as abnormal points. Abnormal points can be removed and then filled by the filling method. Principle 3∂: If the data follow a normal distribution, under Principle 3∂, the abnormal value is the value of the deviation of the measured value from the average value of more than 3 times the standard deviation in a set of measured values. If the data follows a normal distribution, the probability of occurrence of values other than the average value 3∂ is P (|x - u| > 3∂) ⩽ 0.003, which belongs to very small probability events. This method can be used to determine outliers.
In addition, there are box chart analysis and model-based and distance-based outlier detection method. After detecting abnormal points, the supplementary method is used to supplement to ensure the integrity of the data sample.
PCA principal component analysis is to find the optimal coordinate subspace of data distribution by mapping the data set to different dimensional spaces, so as to achieve the purpose of dimensionality reduction. It first establishes the covariance matrix C formula (12) of the initial features, and then creates the feature vector {x1, ⋯ x n } corresponding to the top N largest eigenvalues, and performs the dimension reduction formula (13) by multiplying the original matrix C by the eigenvector matrix.
The feature vector represents the transition direction of the feature in the new coordinate space in the covariance matrix, and the feature value is λ in the variance formula (14) on the corresponding feature vector.
Covariance:
In the formula:
cov (X, Y)-covariance.
Covariance matrix:
Matrix A, eigenvector x, and eigenvalue λ satisfy:
The principle of LDA linear discriminant analysis is to project the labeled data into the low-dimensional space according to the label category, so that the distance between the same category of the projected data points becomes shorter and the distance between different categories becomes longer, so as to achieve the purpose of dimensionality reduction.
LDA first calculates the focus m
i
of each labeled category.
Then the original cluster center m
i
projected cluster center is calculated:
The projected degree of class dispersion is expressed by variance:
At the same time, the best parameters after projection are determined by continuously optimizing the loss function J (ω):
The integration of the Internet of Things and intelligent modules requires the support of development languages and scientific databases.
In this paper, the Flask framework is used to encapsulate an interface of an intelligent prediction module. The MQTT server can call this interface to predict the usage behavior, and send the corresponding instructions to the Internet of Things device to push the message to realize the intelligent response of the device in the intelligent mode. By mining the data collected by IoT devices, the devices can interact with people more intelligently, providing a new idea for the intelligentization of IoT devices.
The following figure is the intelligent prediction and message flow chart:
This module is divided into three major modules: feature engineering, algorithm selection and construction, message prediction and push. Message prediction and push flow chart as show in Fig. 1.

Message prediction and push flow chart.
Light GBM is an algorithm model based on the Boosting model. The Bosting model is a method that combines a series of weak classifiers by adjusting the weights to combine the weak classifiers into a strong learner. The following formula is the Boosting model expression:
The loss function of the model is L (F m (X) , Y). The process of optimizing the loss function is to make the loss function gradually decrease, that is, L (F m (X) , Y) < L (Fm-1 (X) , Y).
The second-order Taylor expansion of the objective function is:
In the formula:
g i -the first derivative of the sample;
h
i
-The second derivative of the sample.
XGBoost has made many optimizations, has higher training efficiency and low memory usage, and supports parallel learning, so it can handle large-scale data. However, XGBoost also has some disadvantages. For example, it needs to traverse the data set multiple times in each iteration, and it needs to occupy a large space in order to save the various sorting results of the features. To make up for the shortcomings of XGBoost, Microsoft has launched a new Boosting framework, namely, LightGBM (Light Gradient Boosting Machine). LightGBM (Light Gradient Boosting Machine) is an integrated learning (Boosting) model based on decision tree, which can be used for various learning tasks such as classification, prediction, and ranking.
LightGBM has three optimization algorithms: Gradient-based One-Side Sampling: The weights used in the AdaBoost algorithm explain the importance of the samples. However, there is no such weight in GBDT, but the gradient of each data sample can be obtained as sampling information. That is to say, if the gradient of a sample is small, it means that this sample has been trained well, and the training error is already very small, so we can no longer calculate this part of the data. Of course, changing the distribution of data samples will cause loss of accuracy of the model. GOSS will randomly select samples with small gradients by saving samples with large gradients and give him a constant weight to ensure that the original data will not change too much when more attention is paid to under-trained samples. Exclusive Feature Bundling (EFB): Generally, high latitude data is sparse according to experience, so a feature reduction method with minimal loss can be designed. Moreover, in the sparse feature space, many features are mutually exclusive, that is, they take non-zero values at almost different times. Therefore, the mutually exclusive features can be bundled to form a feature, and a histogram can be constructed based on the bundle of the bundled features, which will further increase the speed. Histogram algorithm (Histogram): It discretizes continuous floating-point features into K discrete points and constructs a histogram of width K. While traversing the training data, the statistics of each discrete value accumulated in the histogram are counted. In the subsequent feature selection, it is only necessary to traverse the discrete values of the histogram to find the optimal segmentation point.
The machine learning algorithm is used to predict the user’s water consumption time based on past historical behavior, and the program iterative improvement algorithm is routinely executed daily. The server issued a strong punch operation 30 minutes before the predicted user’s water consumption time, so that users can immediately drink a sufficient amount of water when they want to use water.
The flow chart of message push based on LightGBM algorithm is as follows:
The implemented LightGBM code module is routinely operated, that is, daily model predictions are performed. The MQTT server caches the prediction result of each user in the message queue and delivers the corresponding control message through the instantiated object of the MQTT service class to realize the intelligent mode conversion of the device. Flowchart of message push based on LightGBM algorithm as show in Fig. 2.
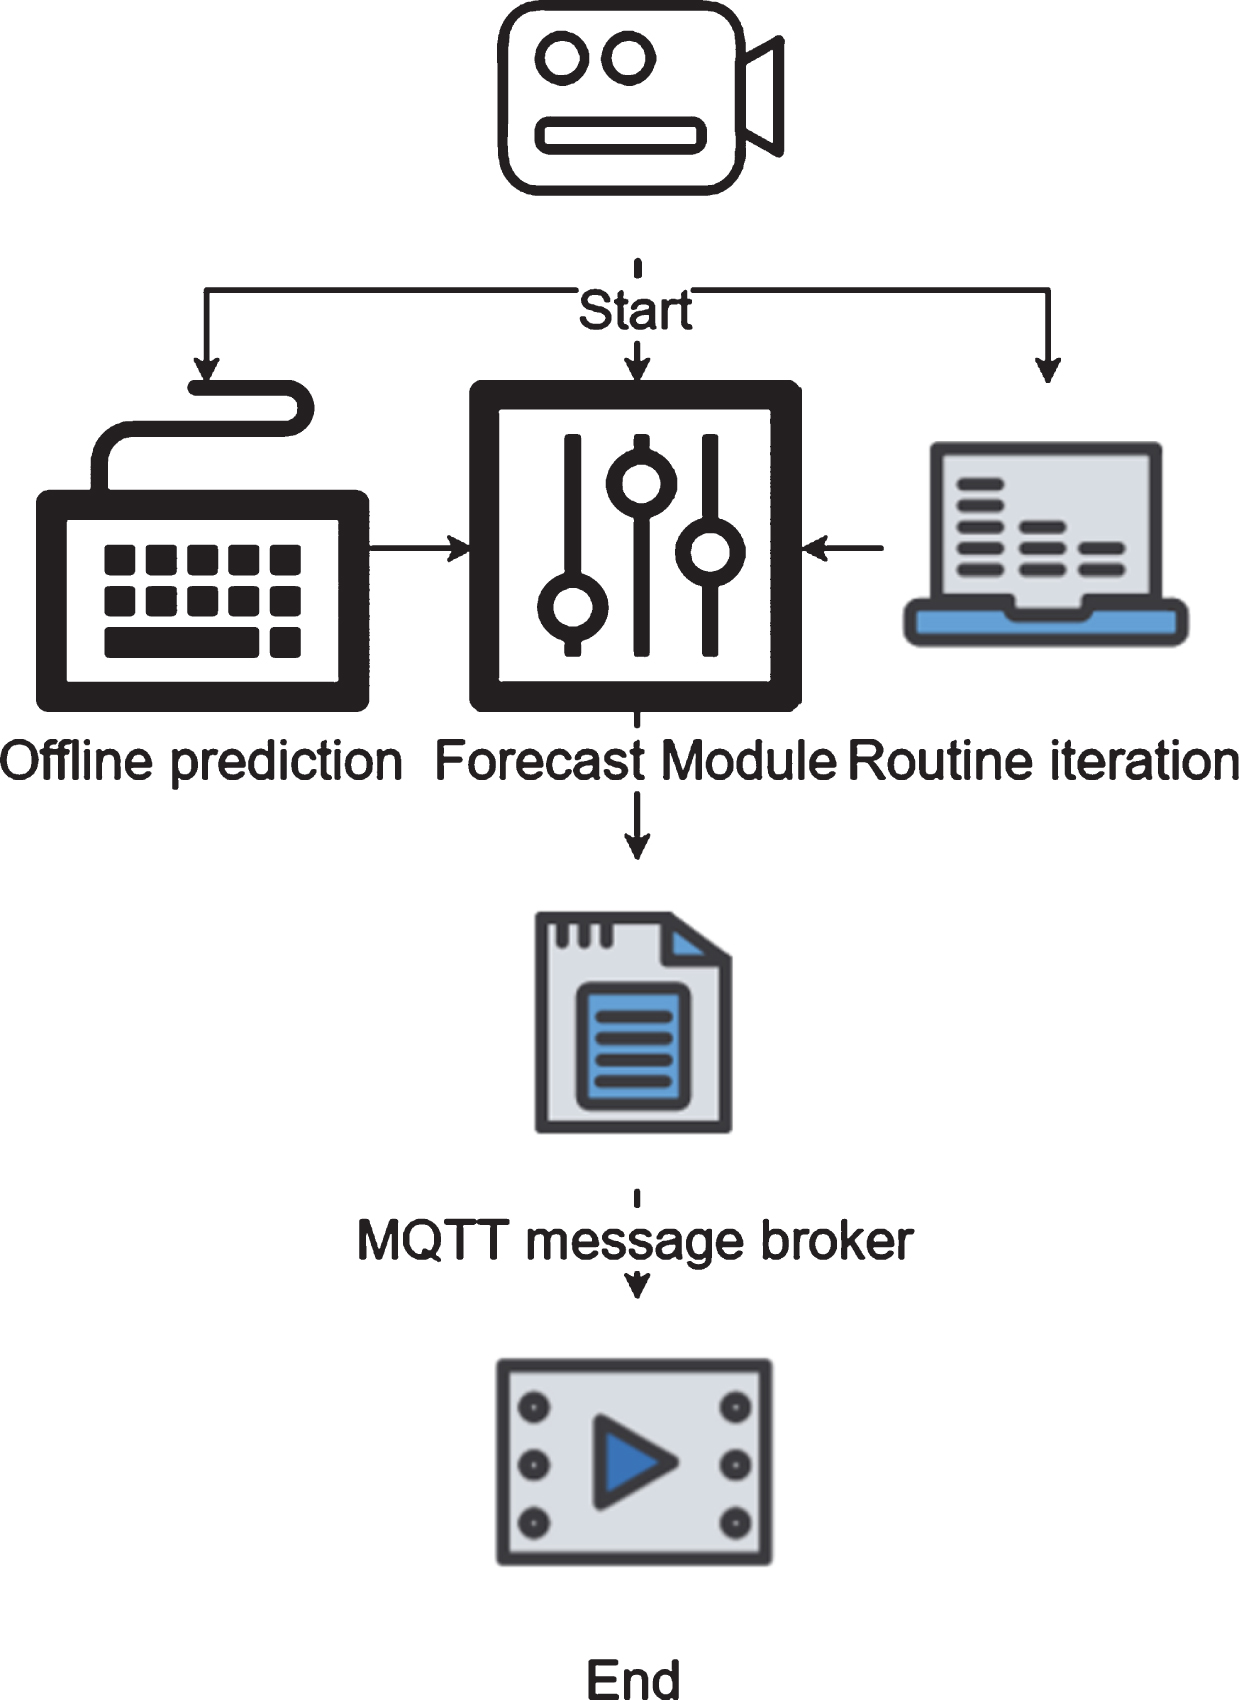
Flow chart of message push based on LightGBM algorithm.
The cloud platform operating system selected in this project uses Ubuntu Server 14.04, the memory is 8 G, and the hard disk is 500 G. In the deployment of the project, Nginx is used as a reverse proxy and load balancing server, and uWSGI is used as a web server to call Django applications. The server architecture is shown in Fig. 3.
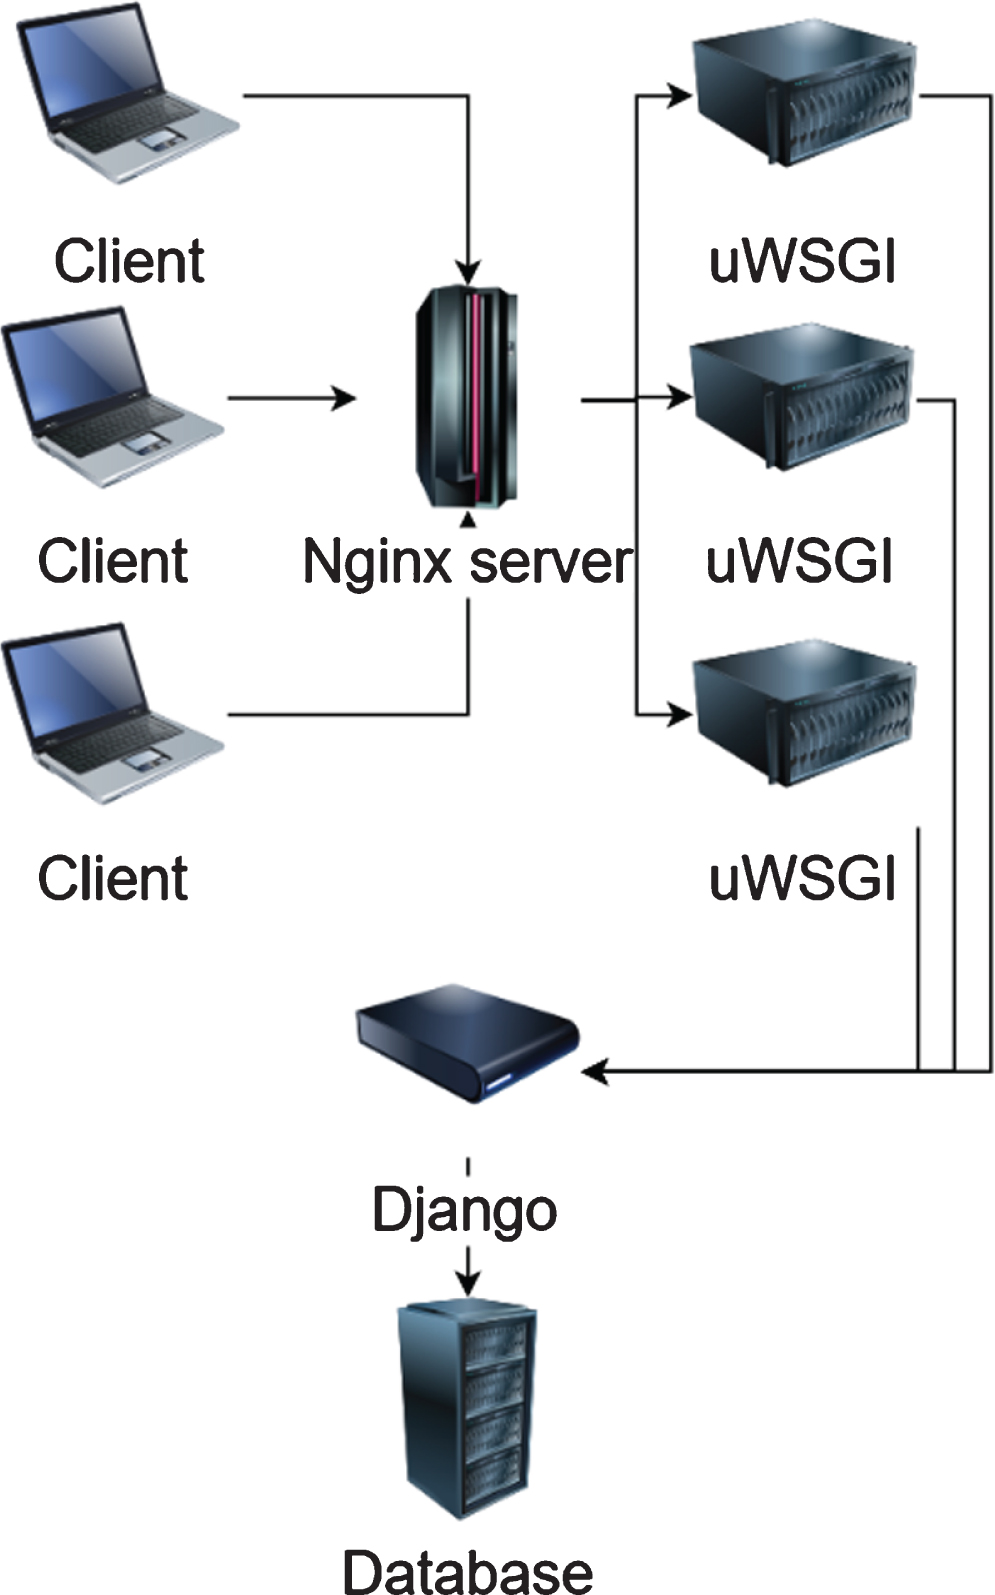
Cloud server architecture diagram.
As shown above, the cloud server receives requests from terminals and management systems, and the Nginx server implements the cloud platform’s external access interface. When Nginx acts as a reverse proxy server, after receiving the request, if a static file such as a picture or file is requested, Nginx finds the file according to the configuration file and returns it to the requester. However, if the request is for dynamic resources such as operations on the database, the service is proxied to the uWSGI server. uWSGI is a web server that implements the WSGI protocol and uWSGI protocol. After receiving the request, uWSGI starts a process, and then calls the Django application through Django’s WSGI gateway interface to process the business logic and complete the return of the request result. The flow of the server responding to the request is shown in Fig. 4.
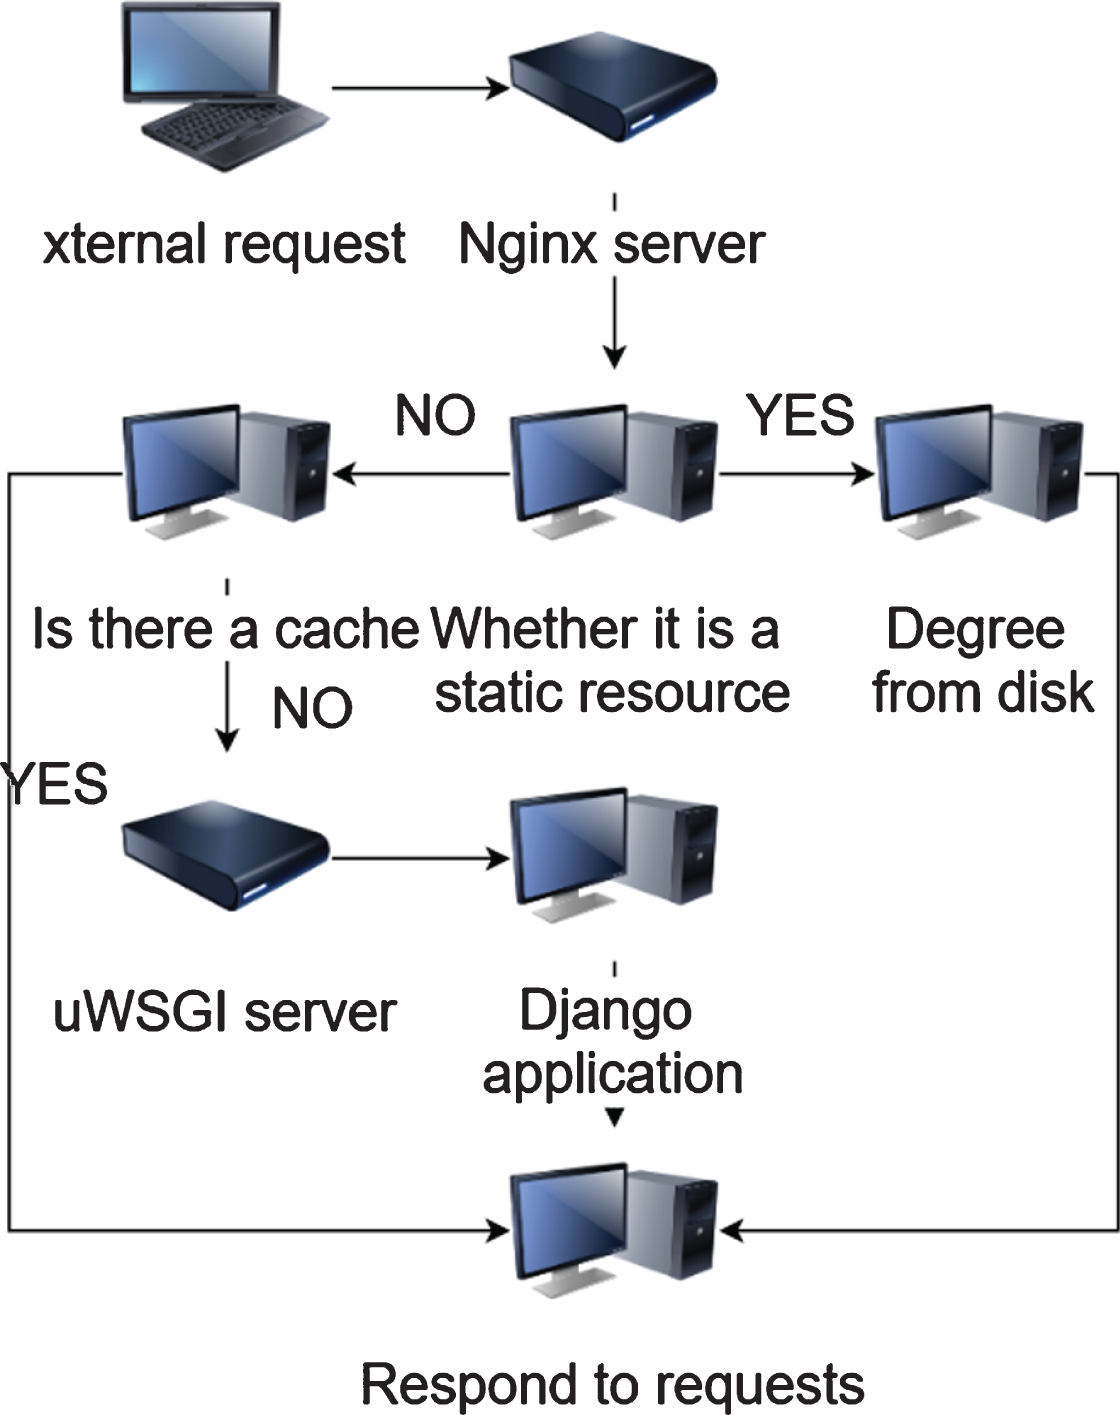
Flow chart of the server responding to the request.
The multimedia distribution system is a complete and complex Internet of Things system, which includes many issues such as terminal management, media playback, server construction, terminal networking, and data storage. Therefore, on the basis of system development and actual implementation, this topic divides the multimedia publishing system into three major parts based on the analysis of the project requirements mentioned above, which are the WEB terminal management system, cloud platform service system, and terminal playback system. The overall system architecture is shown in Fig. 5:
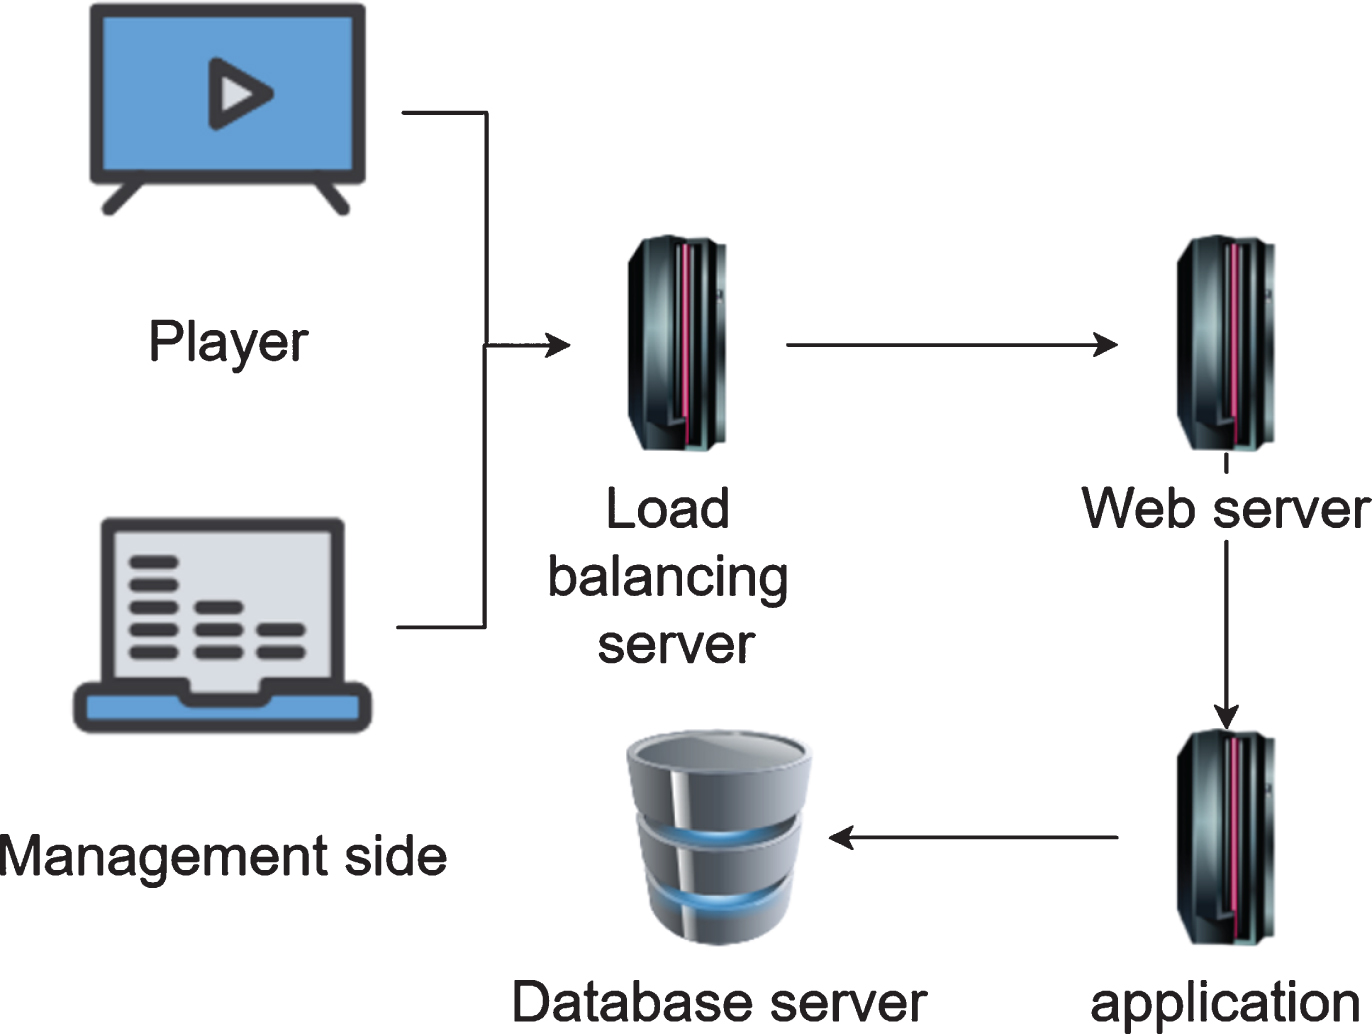
Architecture diagram of the multimedia publishing system.
Since users no longer need to install other software except for browsers, the use of B/S architecture development also enhances the speed and convenience of using the management system. The structure of WEB management system is shown in Fig. 6.

WEB management system.
As the central core of the multimedia publishing system, the WEB terminal management system adopts a layered design based on the development of the B/S architecture. In this design mode, the development of the WEB-side management system will be implemented separately from the presentation layer, business logic layer, and data access layer. Because the web-side management system is designed and developed based on the Python and Django frameworks, the hierarchical design of the management system is based on the three-tier architecture of the Django framework. The three-tier architecture based on Django is shown in Fig. 7.
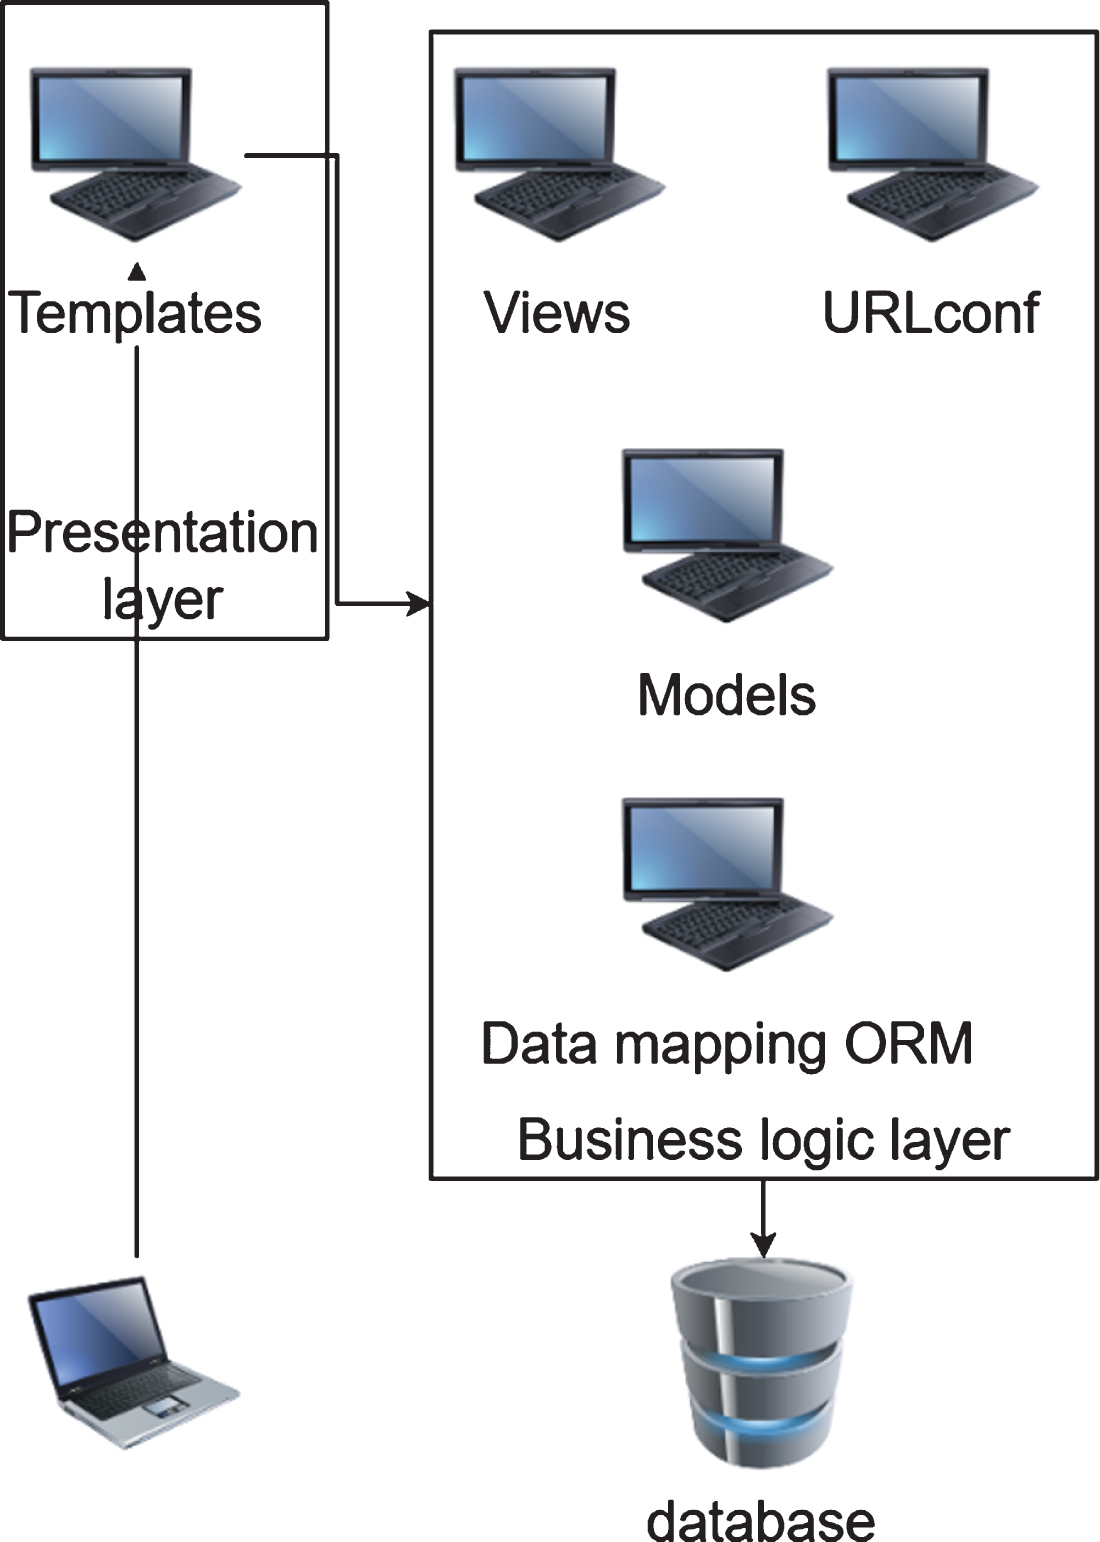
Three-tier architecture diagram.
On the basis of constructing the above model, the database is simulated and tested, and the main research is whether the database constructed in this study can meet the system requirements.
First of all, this research tested and analyzed the reaction time of the database. A large amount of data is stored in the database. The extraction and storage time of these data will directly affect the system performance. In this study, 100,000 sets of data were randomly extracted and stored, and a total of 60 sets of experiments were conducted. The results obtained are shown in Table 1 and Fig. 8.
Statistical table of database data storage and extraction speed
Statistical table of database data storage and extraction speed
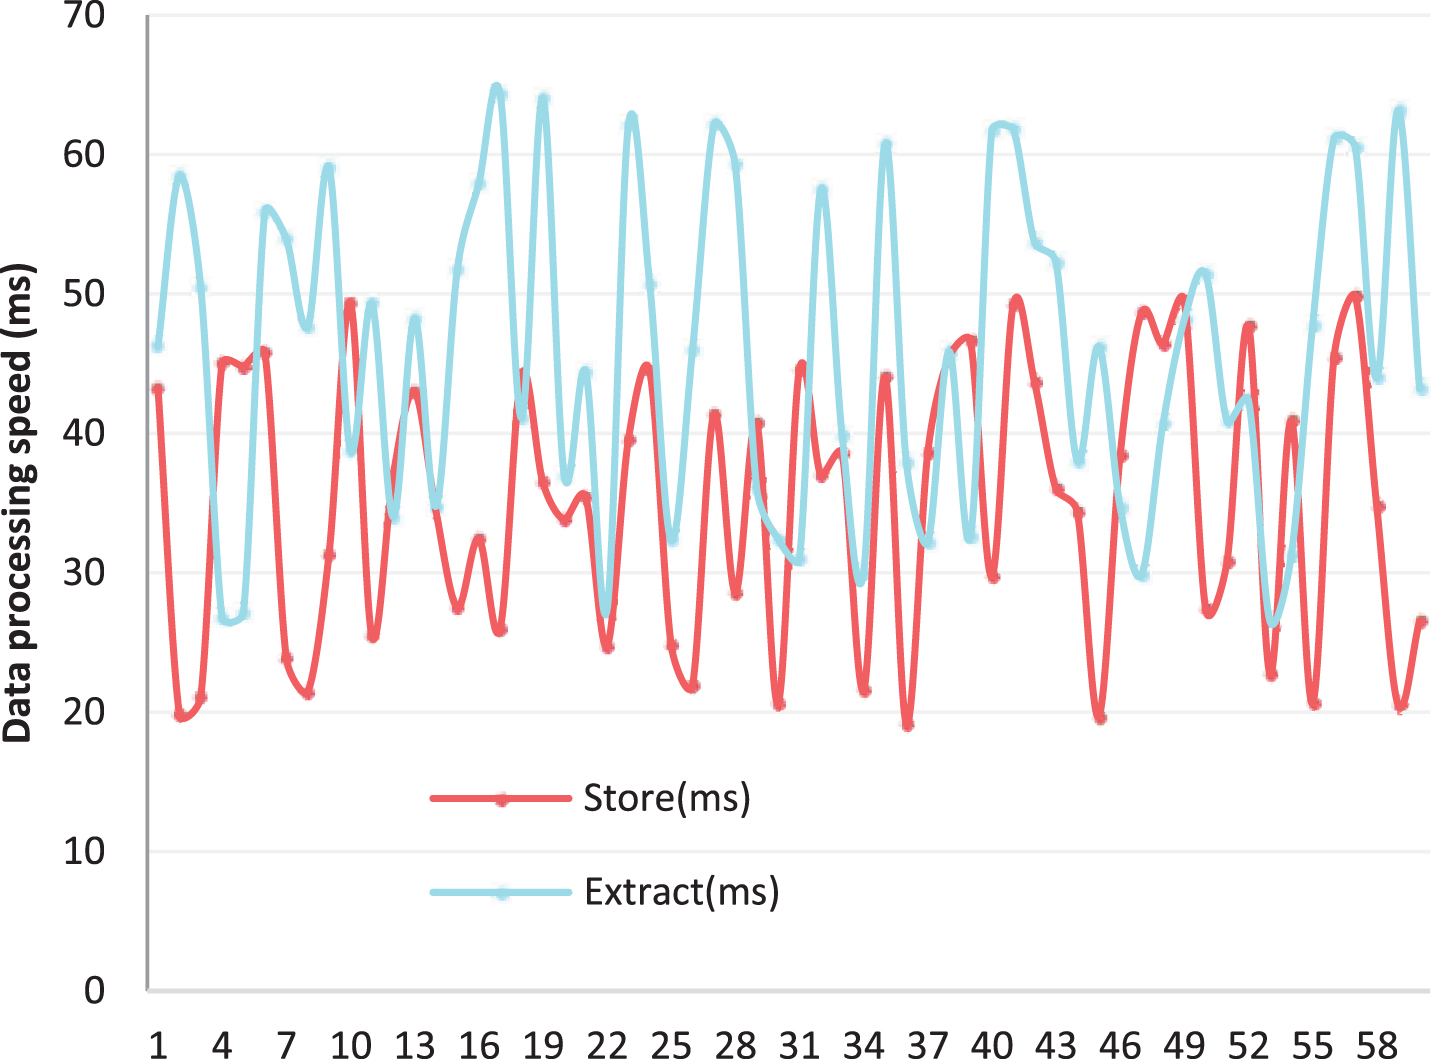
Statistical diagram of database data storage and extraction speed.
It can be seen from Fig. 8 that the database constructed in this paper is faster in data extraction and storage, both of which are below 60 ms. This speed is generally imperceptible to human perception, so it can meet actual needs. Next, the data distortion rate of the database was studied, and 60 sets of data were also counted. The results are shown in Table 2 and Fig. 9.
Statistical table of data distortion rate
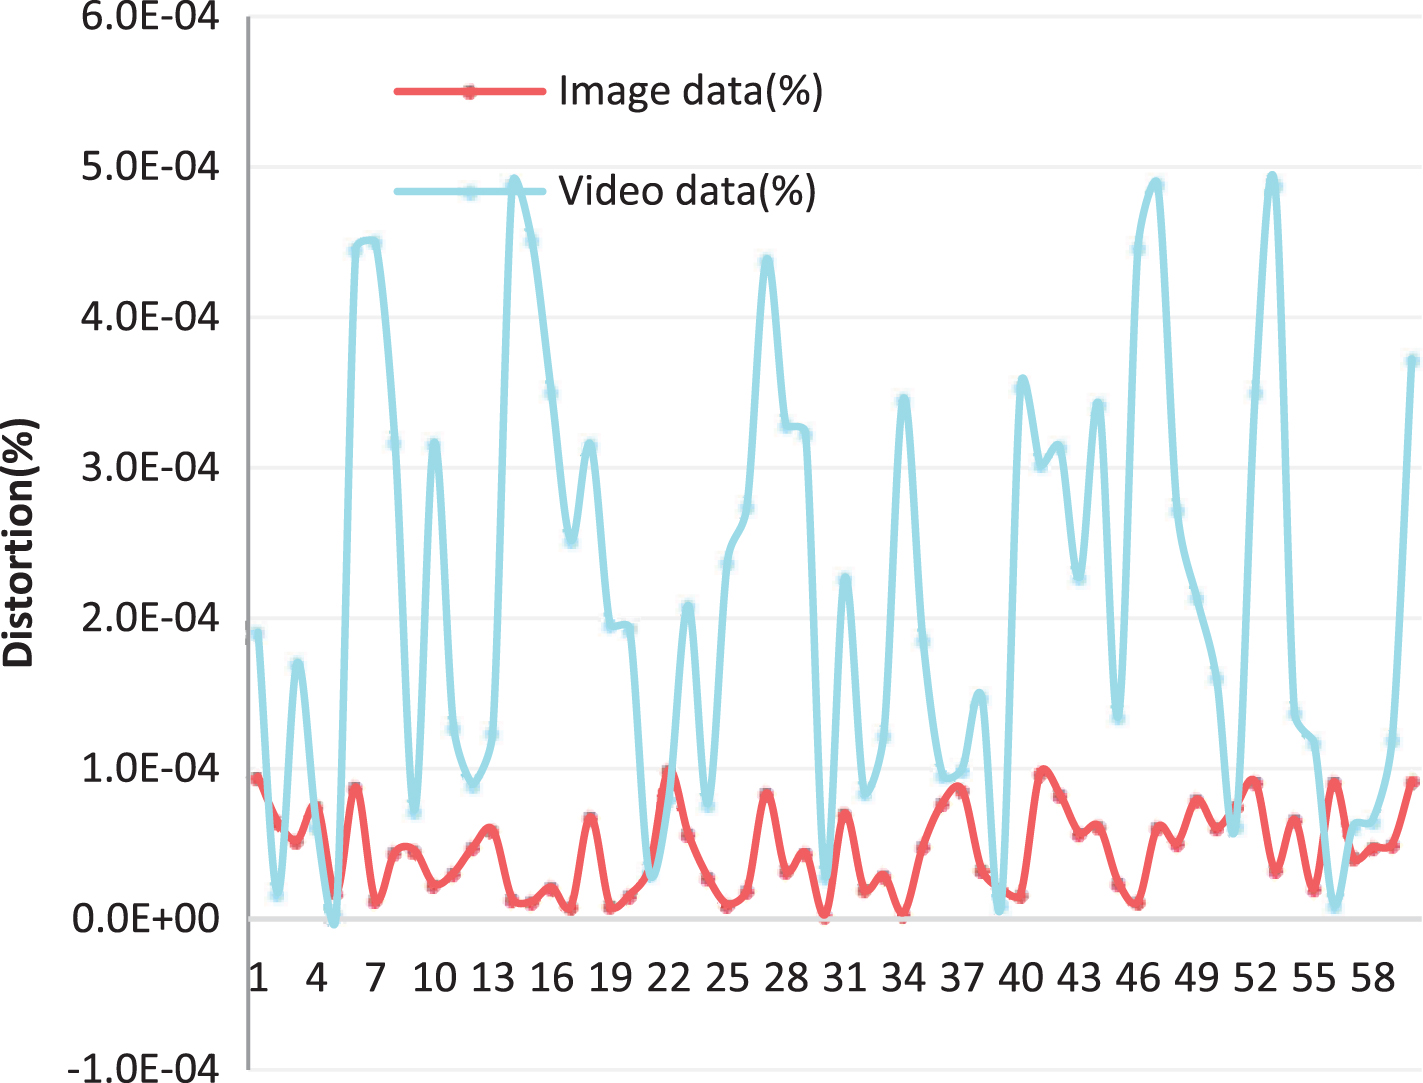
Statistical diagram of data distortion rate.
From the statistical results in Fig. 9, the distortion rate of the multi-endosome database constructed in this paper is very small and can be ignored. This shows that the model database constructed in this paper has good performance.
This topic is based on the requirements of the multimedia system in the new era, based on the Internet of Things and cloud platform technology, using the most mainstream development language and software and hardware technology development. After fully researching the existing multimedia distribution system, this system has realized the development and design of WEB management system, cloud platform server system and terminal playback system. Based on this platform, users can monitor and manage terminal devices distributed throughout the country and publish playback tasks to achieve real-time fixed-point push, and the good design of the cloud platform server system allows the system to support access to a large number of requests in a short time and enables the system to operate stably and safely. The design of the terminal playback system allows the device to provide effective information in a timely manner while spreading the media, and to strengthen the unstable network. Moreover, on the basis of building a model, this study simulates the database and mainly studies whether the database constructed in this study can meet the system requirements. In addition, database simulation research is conducted through actual data analysis. The results show that the model database constructed in this paper has good performance.
Footnotes
Acknowledgments
This research has been financed by Training program for young backbone teachers in Colleges and universities Project in 2018 of Henan Province “Research on Intelligent Traffic Management of Park Based on Internet of Vehicles Technology” (2018GGJS265), Kaifeng Agricultural Internet of Things Engineering Technology Center (20170217) and Kaifeng University Agricultural Internet of Things Collaborative Innovation Center (20160302).