
Abstract
The Covid-19 first occurs in Wuhan, China in December 2019. After that, the virus has spread all over the world and at the time of writing this paper the total number of confirmed cases are above 11 million with over 600,000 deaths. The pattern recognition of complex environment can be used to determine if a COVID-19 breath pattern can be established with accuracy. The traditional decorative pattern detection method has a high degree of recognition in simple scene. However, the efficiency of decorative pattern detection in complex scenes is low and the recognition accuracy is not high. Firstly, the evaluation index of target detection method is designed. Through this paper, it is found that the success rate of some targets is naturally better than other targets, and easy to distinguish from the background. In order to improve the recognition success rate of the object in the complex environment and determine the position and attitude of the object, the pattern as the artificial identification in the environment is proposed. The interior art decoration pattern is selected as the experimental pattern and the pattern classification evaluation index is designed. The experimental results show that the method proposed in this paper can optimize the pattern subsets which are confused with each other and easy to distinguish from the background. It has a certain reference value for decorative pattern recognition in complex environment for COVID-19 epidemic.
Introduction
The Covid-19 first occurs in Wuhan, China in December 2019. After that, the virus has spread all over the world and at the time of writing this paper the total number of confirmed cases are above 11 million with over 600,000 deaths. The pattern recognition of complex environment can be used to determine if a COVID-19 breath pattern can be established with accuracy [1–3]. In recent years, with the development and progress of science and technology, artificial intelligence is gradually entering people’s life [4]. Because human beings mainly obtain external information through vision, the development of artificial intelligence in the direction of vision is particularly important, and target detection is the top priority in the field of vision. The face gate and license plate recognition system which can be seen everywhere cannot do without high-precision target detection algorithm [5–7]. With the development of the research on the detection algorithm, the accuracy and recall rate of detection are increasing. However, the general target detection method still cannot meet the accuracy requirements in the field of decorative element pattern recognition [8]. Aiming at this problem, this paper proposes a method of target detection and location based on prior knowledge, which can improve the accuracy and recall rate of pattern recognition of decorative elements in specific scenes under the condition of integrating prior knowledge such as known patterns and reasonable space.
Faster-RCNN target detection algorithm
Faster RCNN, proposed by Ross in 2015, is a target detection algorithm based on candidate regions [9]. Compared with previous target detection methods, the accuracy and speed of this method are greatly improved. In recent years, most of the better detection algorithms are based on Faster-RCNN.
ROI pooling layer
The idea of the ROI pooling layer comes from the Spatial Pyramid Network Structure (SPP-net) [10]. Fast RCNN network makes use of this structure, so that the network can only extract features once, accelerating the operation of the network. This structure continues to be used in fast RCNN. Because the classifier in the traditional RCNN network can only accept the fixed size recommendation box, and when scaling the detection box, because of the diversity of the target shape, the image will become inconsistent in scale size, which will affect the detection results. In addition, the classifier needs to classify each detection frame, which results in waste of resources, slow network operation, and it takes 47 s to process a picture. In order to make up for these shortcomings, the ROI pooling layer accelerates the RCNN process through shared computing, and pools the detection frame to get a fixed size, thus avoiding further scaling [11]. A fixed size eigenvector is obtained by maximizing the pool size of the network, and then it is sent to the full connected network. Figure 1 shows the schematic diagram of ROI pooling:
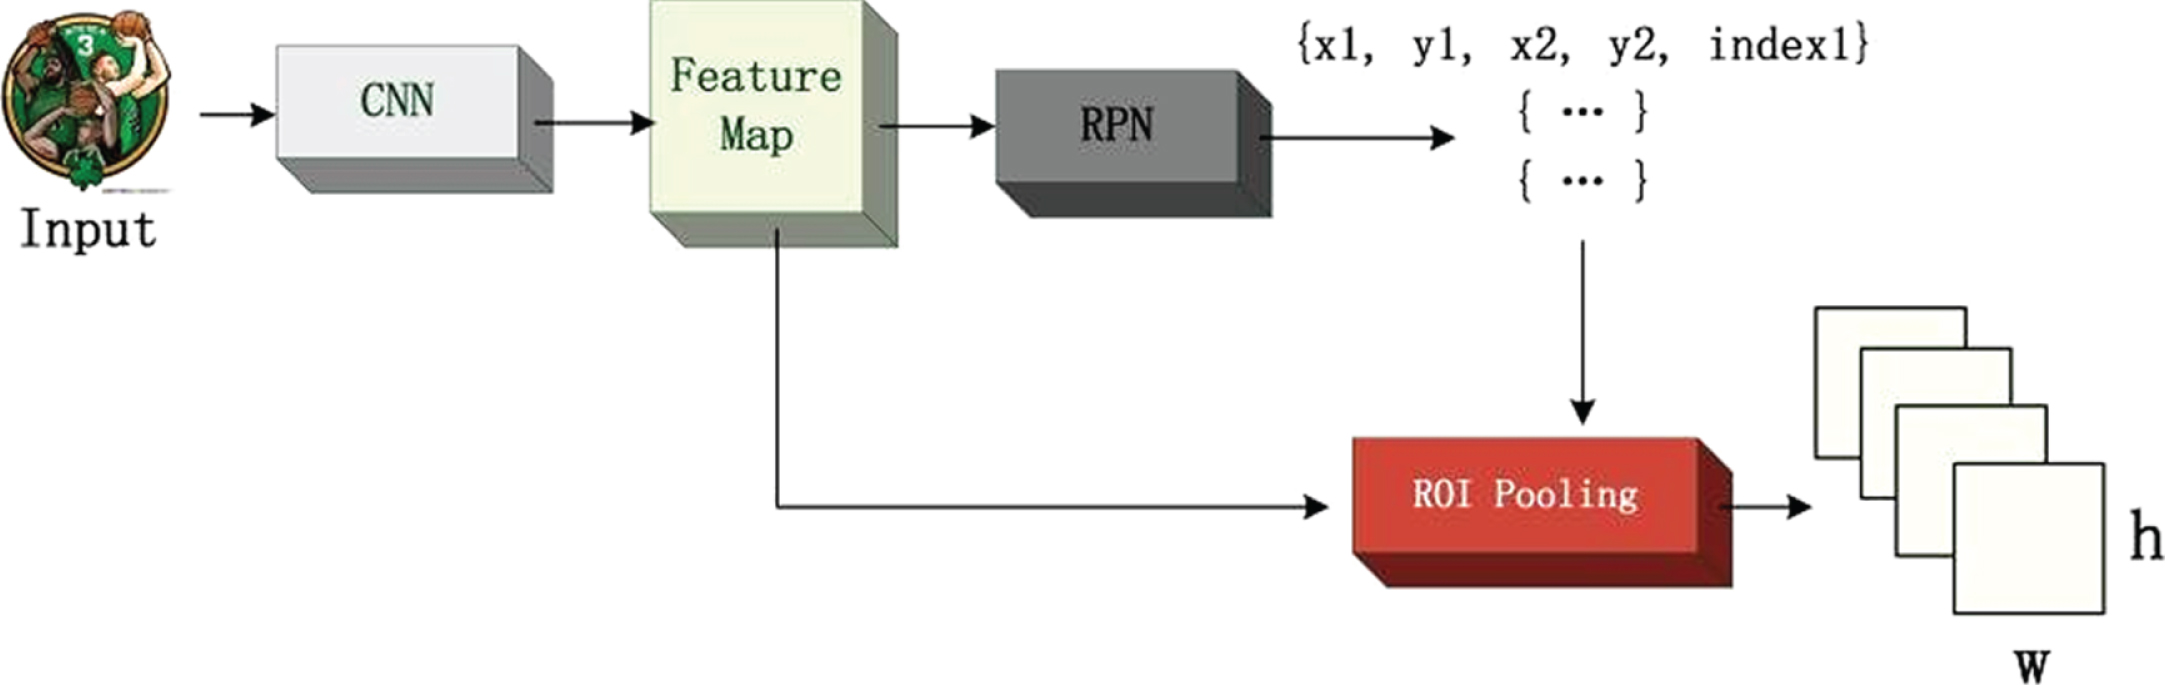
Structure diagram of ROI pooling layer.
The feature areas divided by the two suggestion boxes in the above figure are of different sizes (respectively set to (h_1,w_1) and (h_2,w_2)), but they all need to obtain the same output size. therefore, filters of different sizes are designed. if the final required output size is set to H×W, then the filter sizes of the two should be (h_1/H,w_1/W) and (h_2/H,w_2/W), respectively. practice results show that normalization of the feature size by ROIpooling results in high accuracy with speed.
The role of ROI pooling layer in fast RCNN is to pool the corresponding area into a fixed size feature map according to the location coordinates of the preselected box in the feature map, so as to carry out subsequent classification and bounding box regression operations. Because the position of the preselected box is usually obtained by model regression, generally speaking, it is a floating-point number, and the feature map after pooling requires a fixed size. Therefore, there are two quantification processes in ROI pooling. One is to quantize the boundary of the candidate frame into the coordinate value of the integer point. The second is to divide the quantized boundary area into k×k cells (bin) and quantize the boundary of each cell. In fact, after the above two quantization, the candidate frame at this time has a certain deviation from the original regression position, which will affect the accuracy of detection or segmentation. And if the position of the detection frame is used for three-dimensional positioning, the error will undoubtedly be enlarged.
The inaccurate positioning effect of ROI pooling is shown in Fig. 2. Take the fast RCNN detection framework with vgg16 as convolution network as an example. Input as an 800*800 picture with a 553*665 bounding box (with a dog in the box). After vgg-16 backbone network extracts features, the scale step of feature image is 32. Therefore, the edge length of image and bounding box is 1/32 of that of input. 800 can be divided by 32 to 25. But after dividing 665 by 32, we get 20.78 with decimal. So ROI pooling directly quantizes it to 20. Next, we need to pool the features in the frame by 7*7. So we divide the above bounding box into 7*7 rectangular areas on average. Obviously, each rectangular region has a side length of 2.86 and a decimal. So ROI pooling quantifies it to 2 again. After these two quantizations, the candidate regions have shown obvious deviation (as shown in the green part of the figure). More importantly, the deviation of 0.1 pixel on the layer’s feature map is 3.2 pixel when zoomed to the original image. So the deviation of 0.8 is close to the difference of 30 pixels in the original image, which should not be underestimated.

The cause of location error of ROI pooling.
In order to solve the above shortcomings of ROI pooling, this paper adopts the improved method of ROI align in the literature. The idea of ROI align is to remove the original quantization operation, i.e. nearest neighbor interpolation, and use bilinear interpolation method to obtain the image pixel value on the floating-point coordinate pixel points, so as to transform the overall mapping process into a continuous process, as shown in Fig. 3.
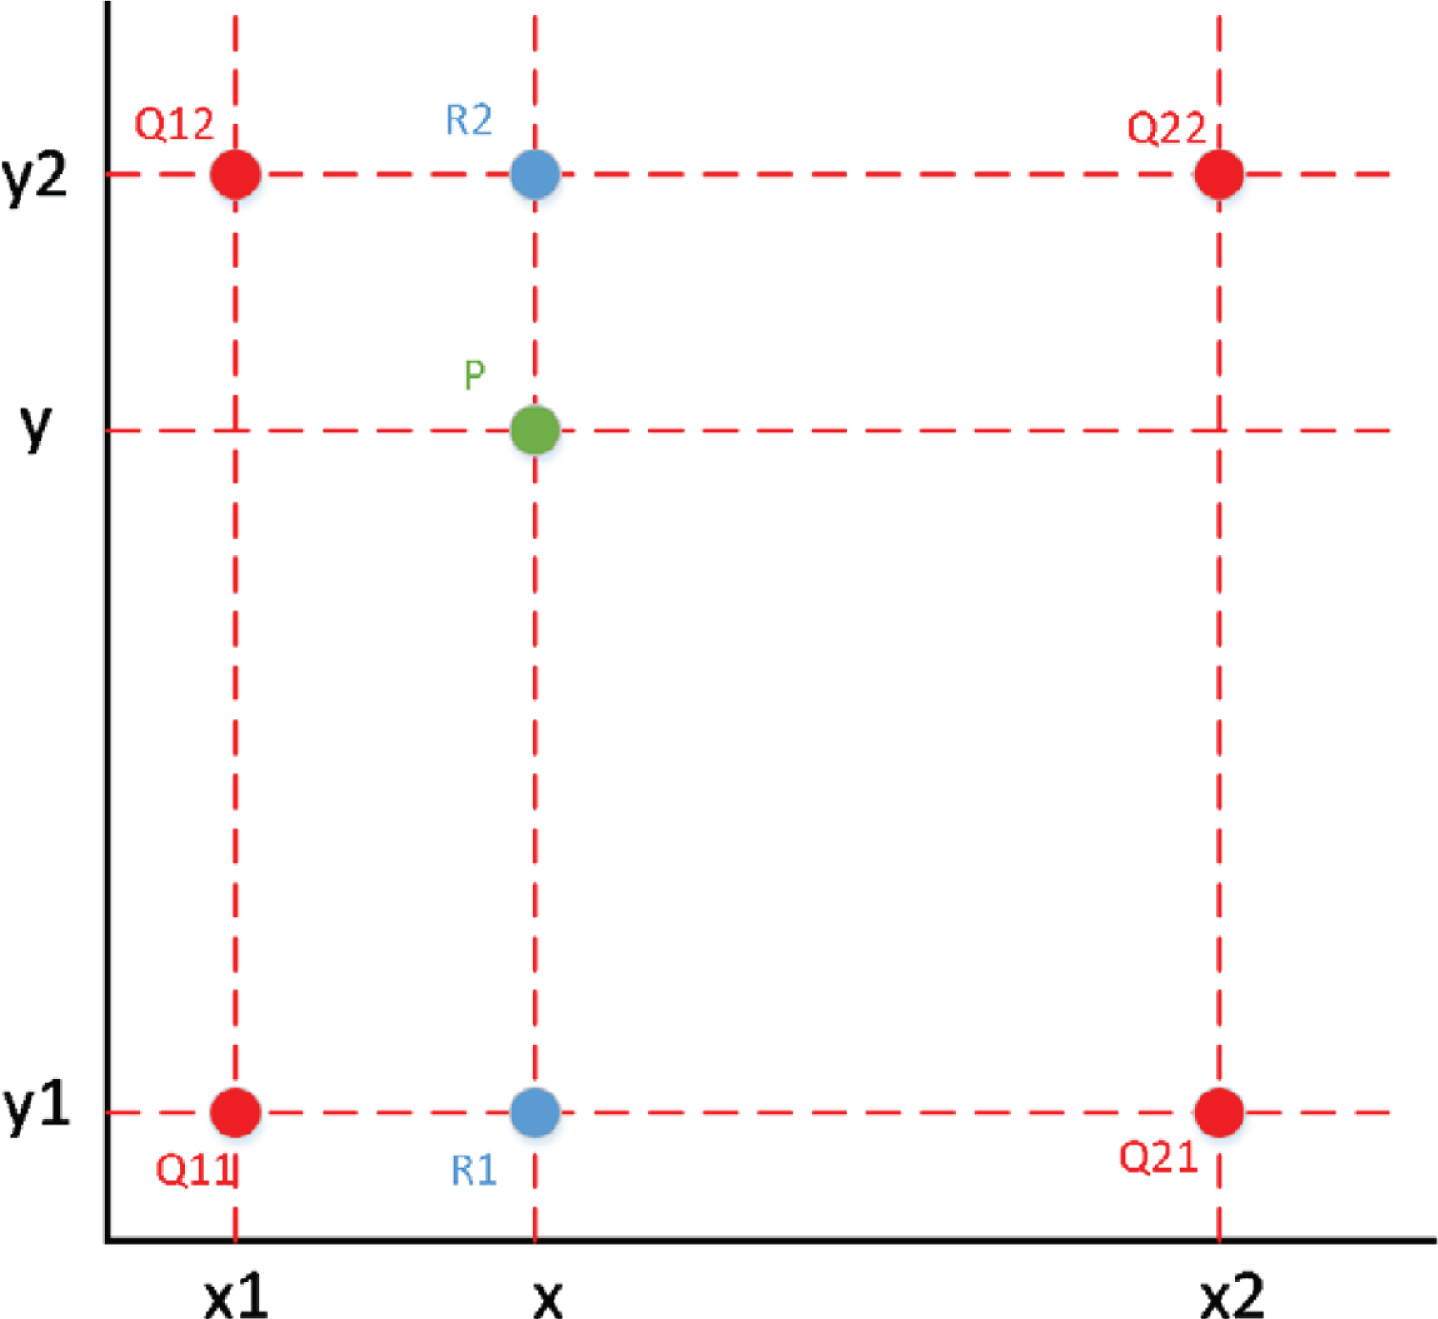
Schematic diagram of bilinear interpolation.
First, linear interpolation is performed in the x-direction to obtain [12–14]:
Then linear interpolation is performed in the y direction to obtain:
In the specific algorithm operation, ROI align does not just calculate the coordinate points on the boundary of the detection box, and then pool the floating-point coordinates, but adopts a more concise process, as shown in Fig. 4.
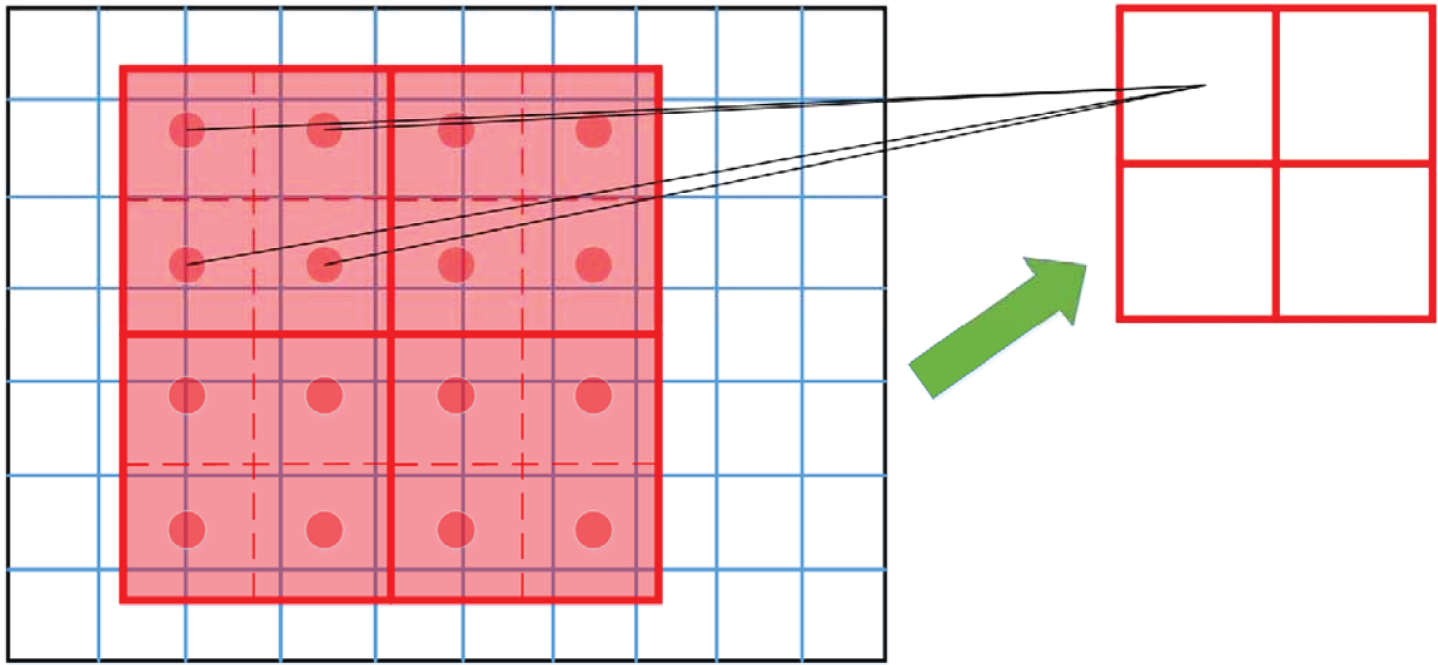
ROI align schematic.
The steps are: When traversing each detection frame, the boundary coordinates of floating-point numbers are not quantified. Each detection frame is divided into k×k sub units, and the boundary of each unit is not quantized. Only four fixed coordinate positions in each cell obtained in step (2) are selected, and the pixel values of four points are calculated by bilinear interpolation, and then pooled.
Specify the determination method of sampling point position in step (3): for example, if the number of sampling points is 1, the sampling point is the center point of the cell. If the number of sampling points is 4, it is the case shown in Fig. 4. Divide the unit into 4 sub areas on average, and then take the center points of the sub areas respectively. The coordinates of these center points are usually floating-point numbers, so the bilinear interpolation method is needed to obtain the pixel values. It is found that setting the sampling point to 4 will get the best performance, and even setting it directly to 1 will have little difference in performance.
The back propagation formula of ROI pooling is as follows:
In formula (4), xi represents the pixel point on the feature map before pooling, yrj represents the j point in the r candidate region after pooling, i* (r, j) represents the source of the pixel value of yrj (when pooling the maximum value, the coordinate of the point with the maximum pixel value), that is to say, only the point with the maximum pixel value finally adopts the gradient reverse transmission at xi. ROI-Align is similar to ROI-Pooling, but some modifications should be made during reverse propagation. First, in ROI-Align, xi *(r, j) is the coordinate position of a floating point number (this point is the sampling point selected by the network in the forward operation). In the characteristic diagram before pooling, each point with the abscissa and ordinate of xi *(r, j) less than 1 should accept the reverse propagation gradient of yrj corresponding to this point, so the reverse propagation formula of ROI-Align is as follows:
In formula (5), d(.) represents the distance between two points, Δw is the difference between xi and xi*(r, j) abscissa, and Δh is the difference between the two ordinates, that is, the coefficient of bilinear interpolation, multiplied by the original gradient.
RPN network uses a s*s sliding window to generate a n-dimension full connection feature on the convolution feature map of the classification network, and then generates a full connection layer of two branches after the n-dimension feature, as shown in Fig. 5.
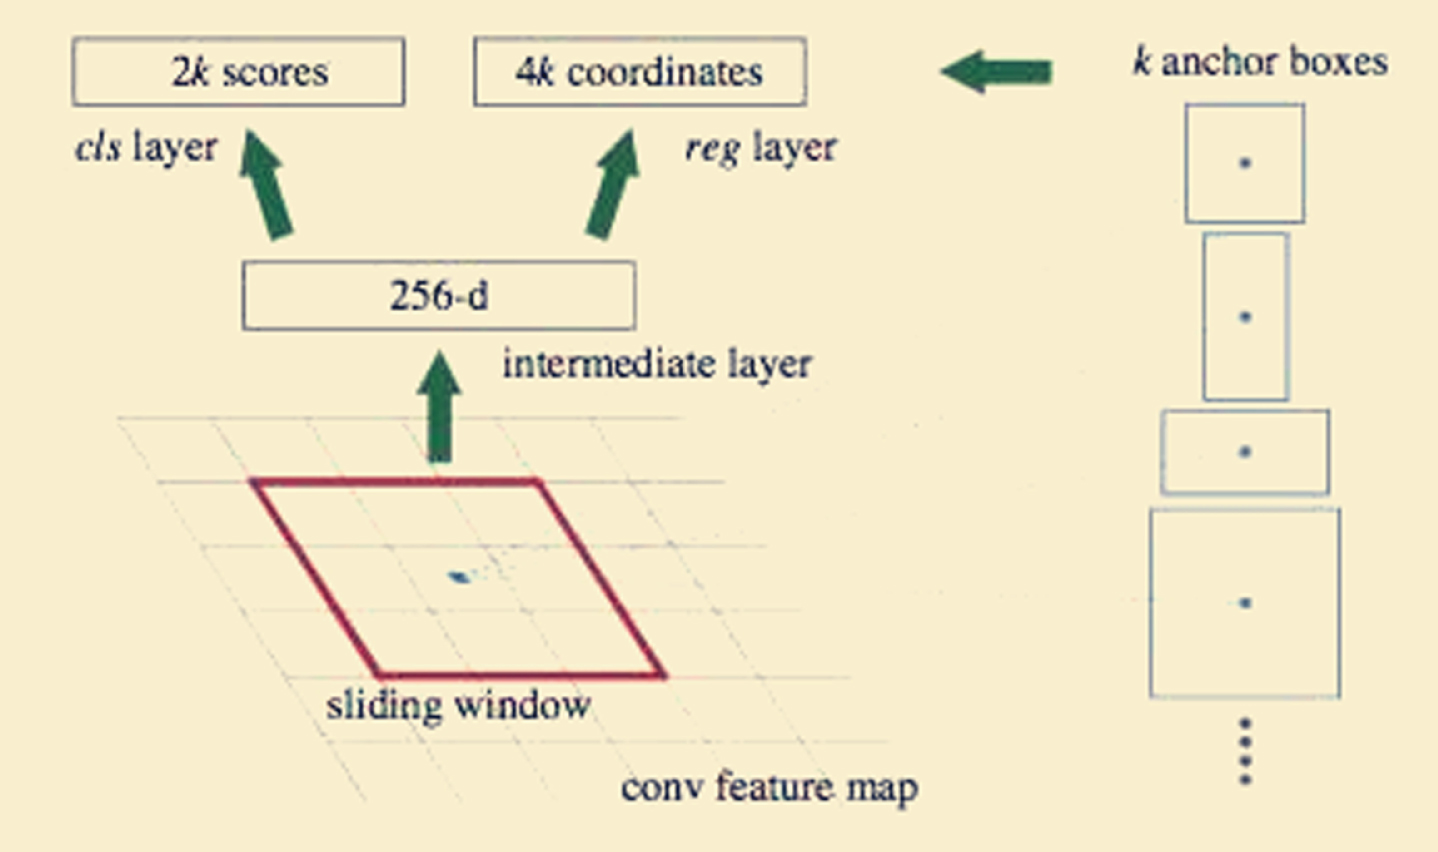
RPN network structure.
Firstly, each pixel generates K (in this paper, K is 9) anchor frames of different scales on the n-dimensional feature map, and each anchor frame is assigned a binary label (foreground and background). The anchor frame of the positive label is: the anchor frame with the highest overlapping with an actual target and the anchor frame with the overlapping area of any actual target greater than 0.7 times the total area. One of the target areas may be assigned positive labels to multiple anchor boxes. The anchor frame with a negative label (background) is the one with an overlap ratio of less than 0.3 times the total area of all real areas. The other anchor frames do not affect the training target, so the output dimension is 2×k dimension. Since each anchor frame has [x, y, w, h] corresponding to 4 offsets, there are 4×k regression parameters in total.
In addition, if all the anchor frames are used to train too much data, and not all the anchor frames are meaningful, 128 positive samples and 128 negative samples are randomly selected from the appropriate anchor frames for training.
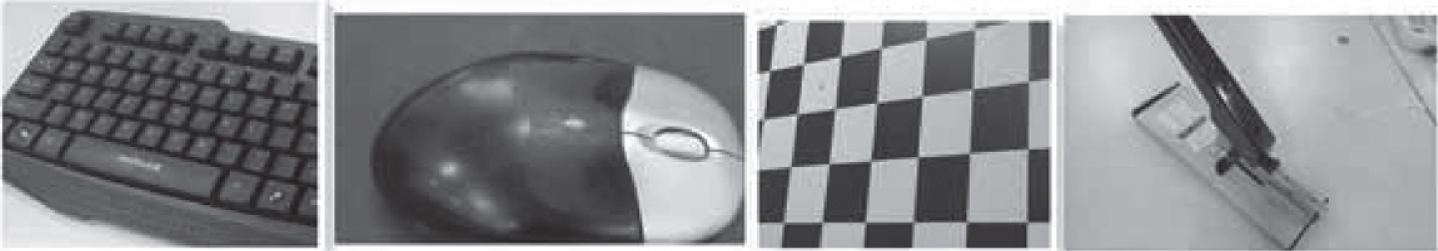
Some researchers put forward some target location methods based on deep learning, but these methods are far from mature. At present, a feasible method of target location is to combine the deep learning method with the traditional feature-based method. One is to extract the natural features (such as SIFT features) in the environment, but it is too dependent on the characteristics of the target itself and the environment to be used in all kinds of occasions. The other is to introduce artificial identification in the environment to assist in locating or identifying the target through the detection of artificial identification. Proper application of manual identification can significantly improve the practical level of the system. However, in the past, manual identification method was based on the traditional visual method to detect the identification, which has limited anti-interference ability. It is often necessary to design the identification to be eye-catching enough (such as black and white rings, corners, etc.) to ensure the success rate. However, excessively conspicuous identification affects the beautiful environment, is difficult to popularize, and has limited types of identification that can be designed, which is difficult to be used for classification of various targets.
If the manual identification can be incorporated without destroying the harmony of the environment, such as selecting decorative patterns or artistic patterns as the identification, the practicability of the system will be greatly improved. However, considering the complicated shape and limited size of the beautiful patterns, it is difficult for traditional visual methods to accurately identify the identification in a complex environment, and the in-depth study of this problem is just competent. As long as the sample set covers the identification in various situations such as different background environments, different angles, different distances and partial occlusion, the trained network will be able to detect the identification with high success rate.
Classified evaluation of patterns
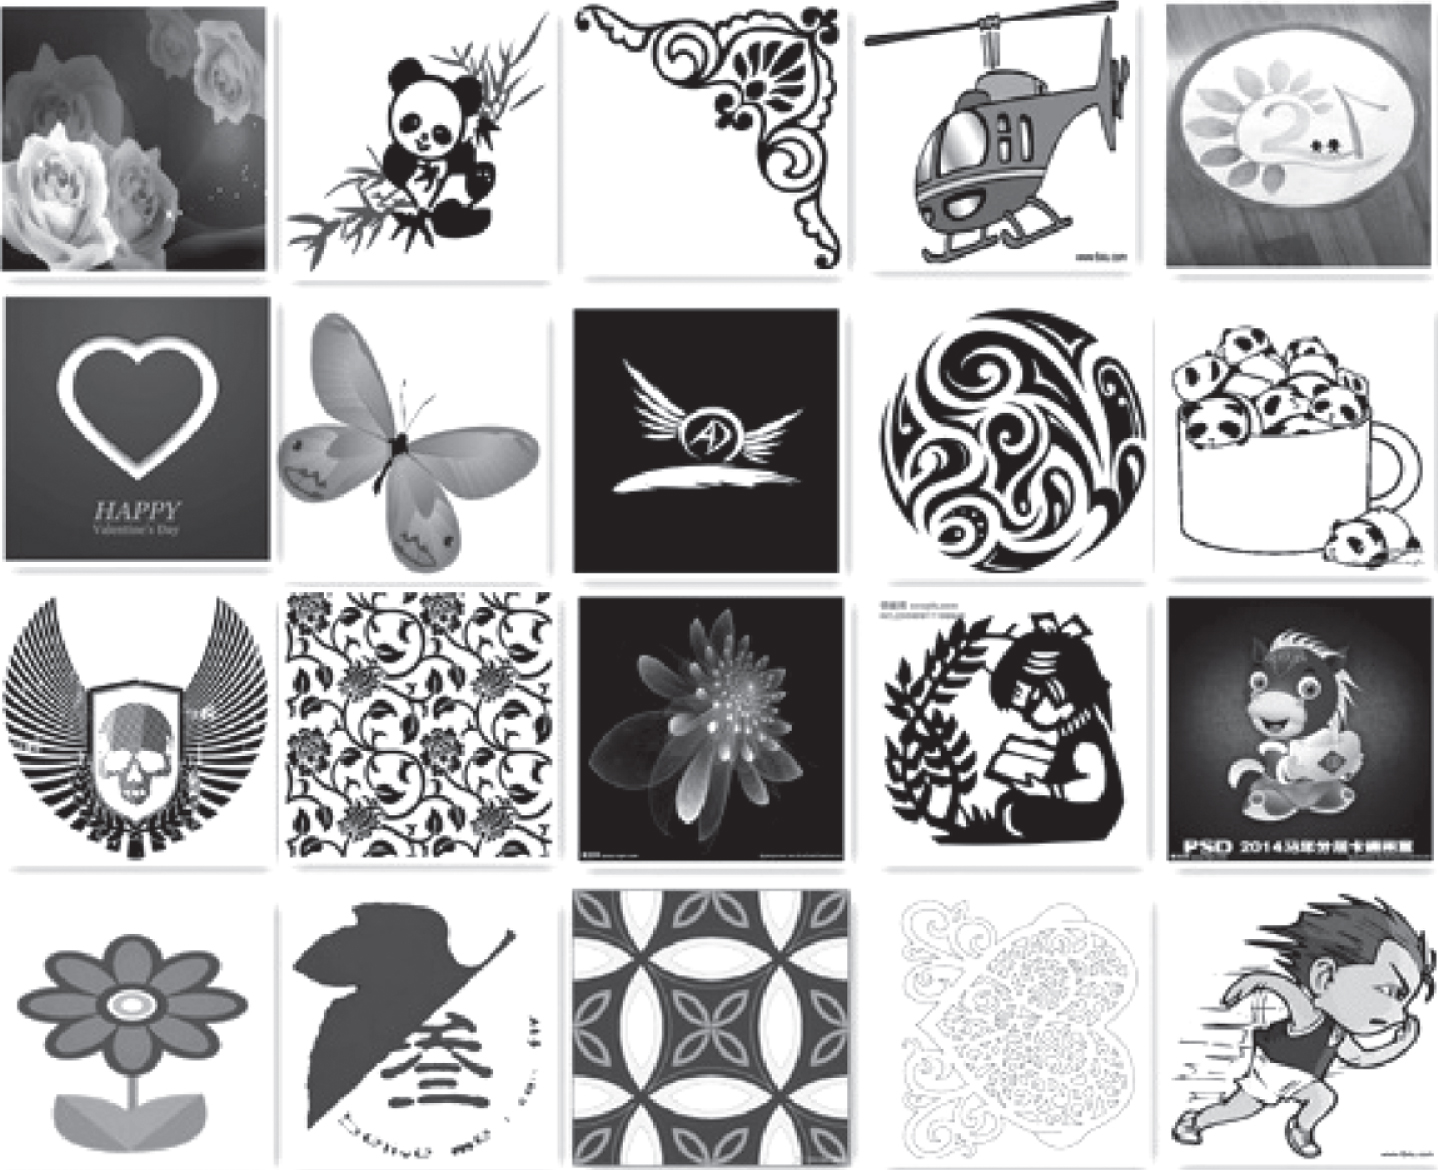
From websites such as Qijia.com, Baidu.com and Qianku.com, a total of 500 decorative patterns were downloaded using crawlers. The selecting result is shown in Fig. 6. The number of each row from left to right was 20, 42, 67, 84, 101, 124, 142, 168, 180, 205, 223, 242, 266, 289, 309, 324, 345, 364, 385, 407, 422, 449, 463, 481.
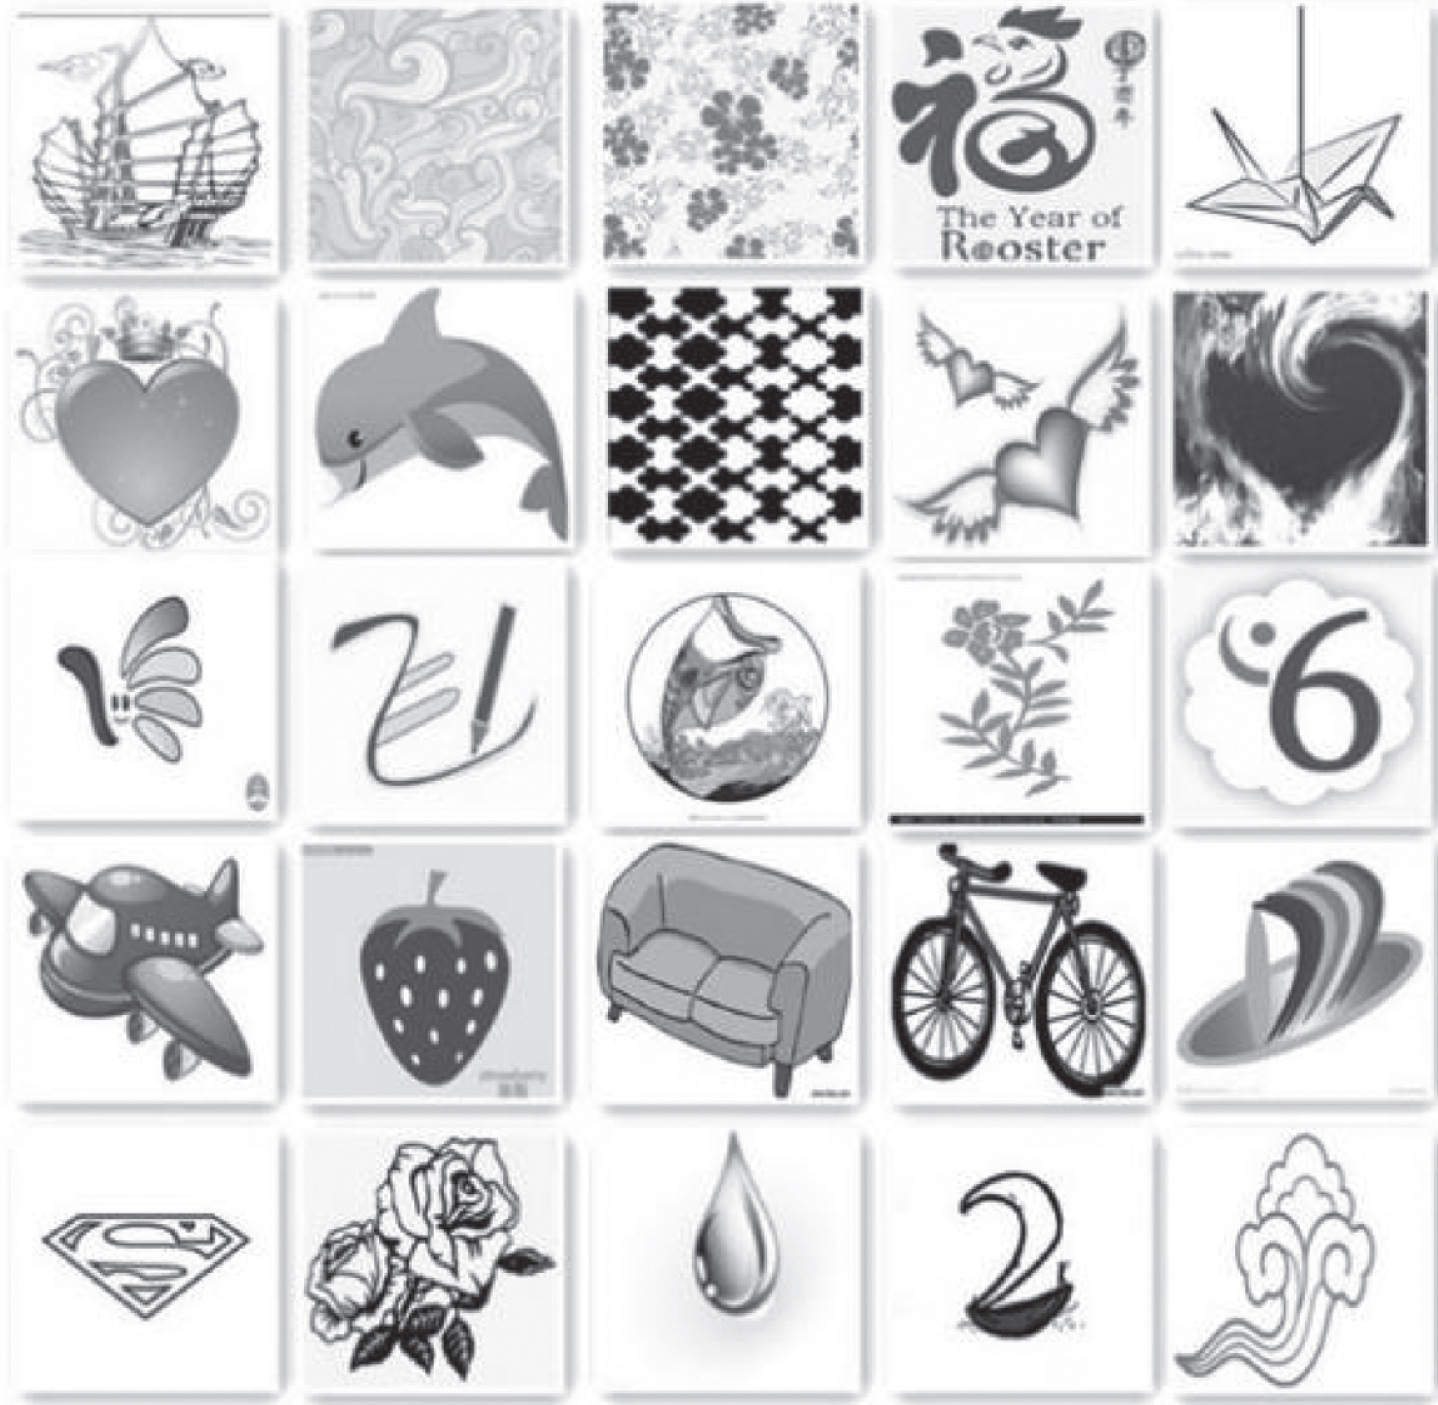
Initial decorative pattern.
In order to achieve effective pattern selection, the most effective method is to directly carry out large sample training experiments on the initial pattern set to obtain samples of all pattern sets placed in different environments, different backgrounds, various shooting angles, illumination changes, etc. After training, the part of the pattern with the highest statistical correct recognition rate is taken as the preferred pattern set, but such workload is too large to operate. In this paper, a feasible pattern optimization strategy is proposed. The idea is to design a quantitative measurement index for each pattern (called “classifiability” in this paper). The larger the index, the more easily it can be distinguished from other selected patterns and environmental targets when it is substituted into the depth network, and the index can work effectively in the case of small sample set.
Assuming that the target to be identified is divided into n classes, the final output layer of the network has n nodes, which respectively represent the probability that the image belongs to each class. This probability is obtained from the softmax regression of the full connection layer. The formula of the softmax regression is as follows:
Where Si is the final probability value of class i output, i is the output value of the desired class, and j is the output value of all classes. Take z1, z2 and z3 as examples to illustrate the output of sofamax function, where z1 = 3, z2 = 1, z3=–3, and the output result is shown in Fig. 7.
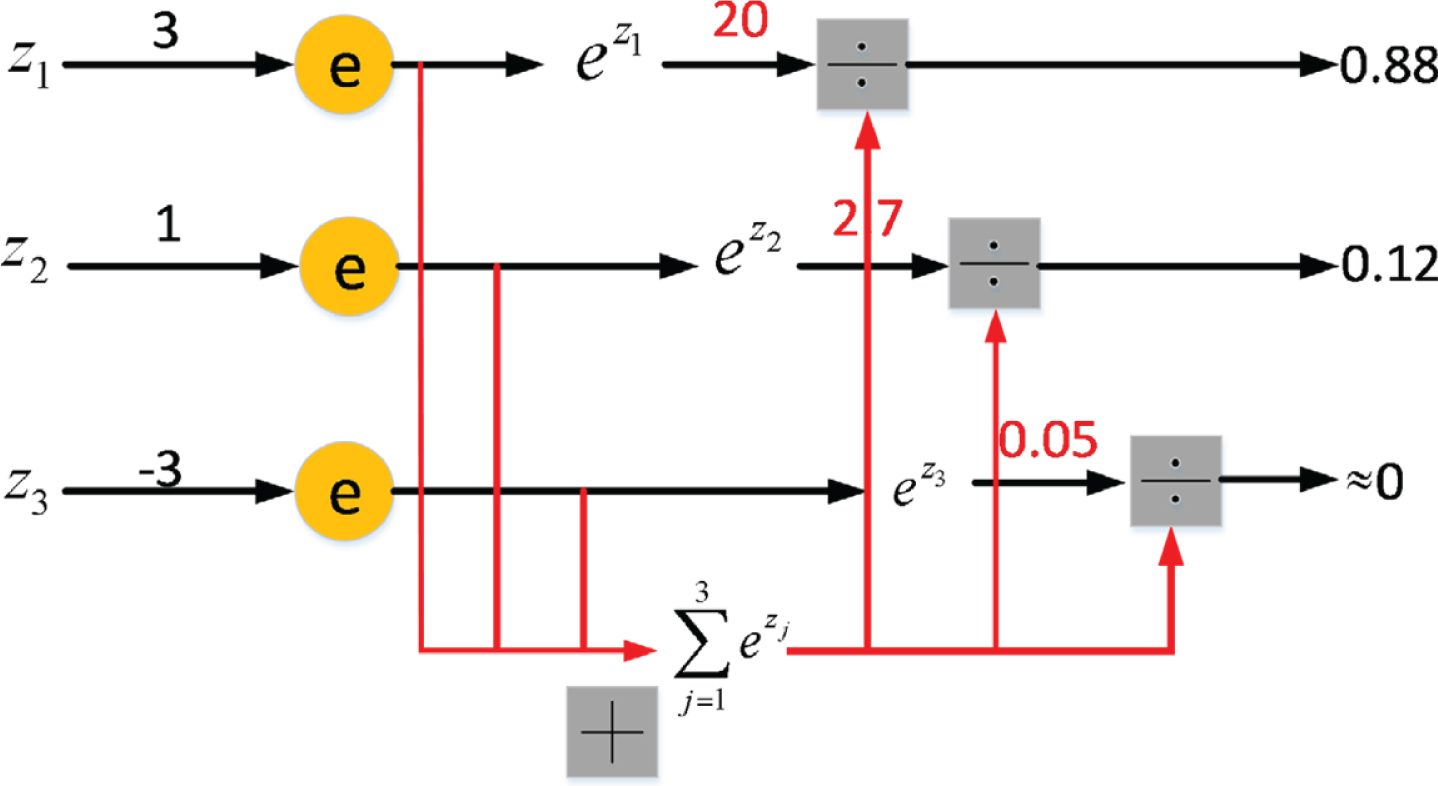
Schematic diagram of operation process of softmax function.
The advantage of using softmax function is that its loss function can reduce the problem of slow training compared with mean square error loss. At the same time, through softmax, the vector of full connection layer can get more significant normalized classification results, as shown in Fig. 8. However, this result is relatively discrete, and can not reflect the classification trend well.

Output result of softmax function.
In view of the above problems, this paper changes the output position of the network and uses the vector output before regression as the entry of the evaluation function, as shown in Fig. 9. And design the evaluation function. Assuming that the number of selected pattern set categories is n, the network includes N + 1 outputs, the first n ones correspond to the probability of each pattern, and the N + 1 represents the probability of background (non pattern area). Assuming that the actual category number of the current input sample is r, the design evaluation function is as follows:
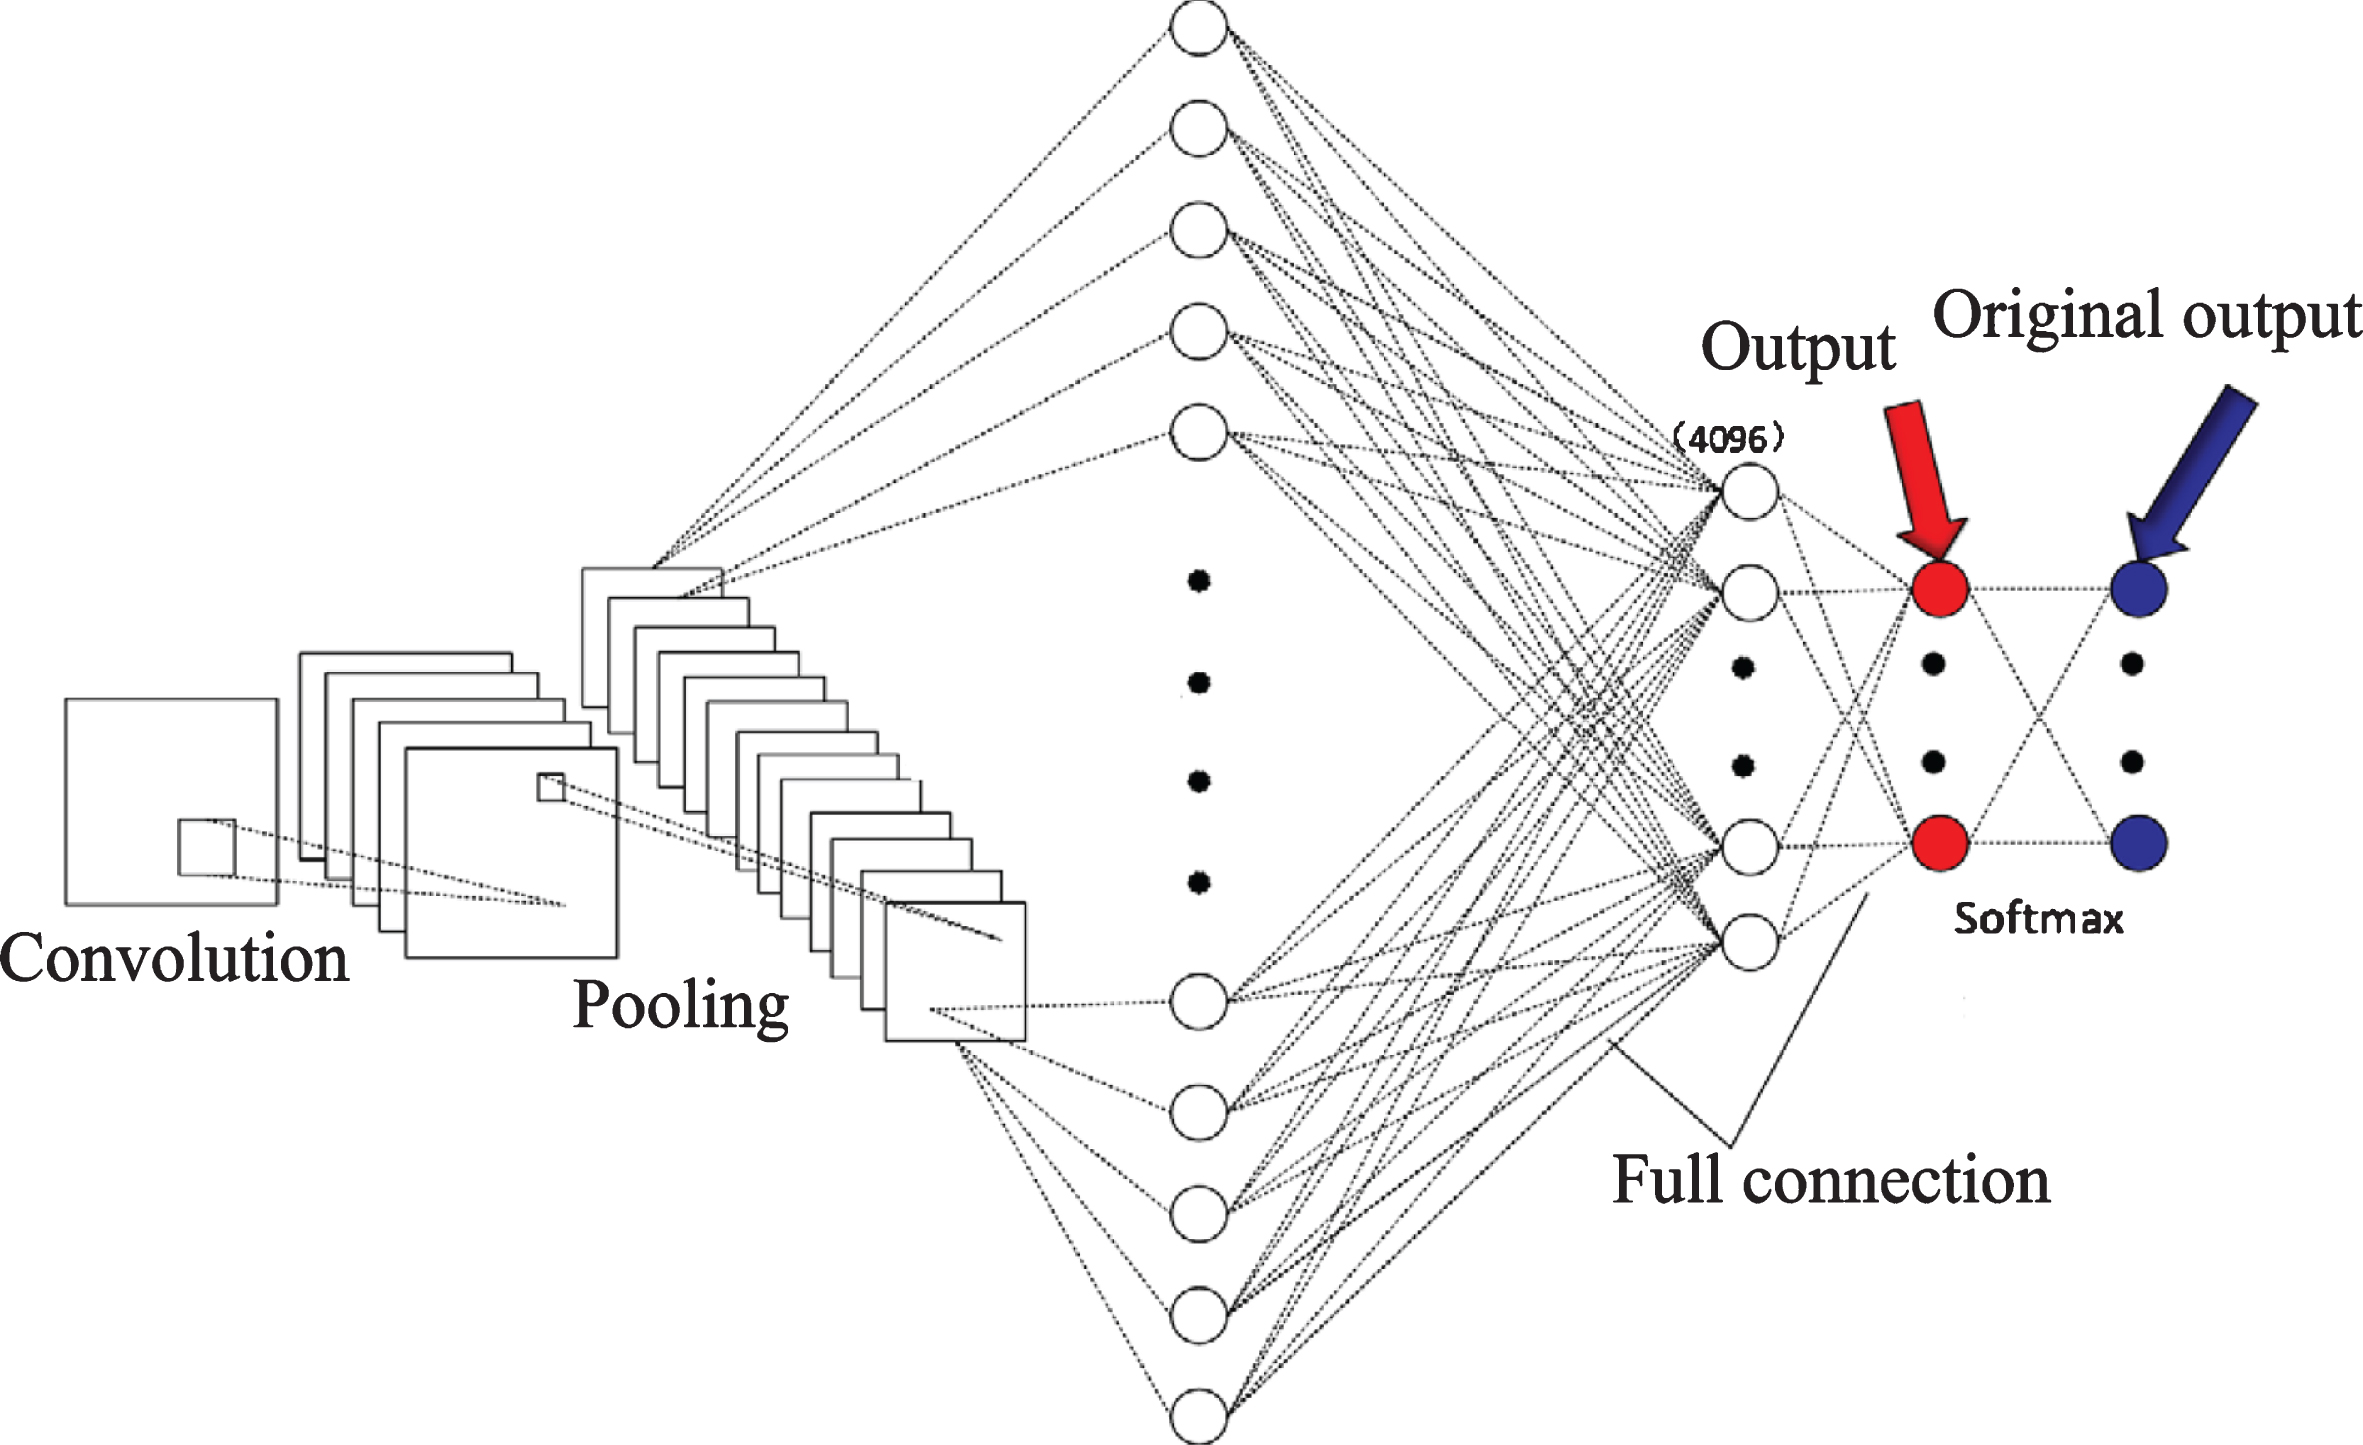
Output of evaluation function entry.
This evaluation function uses index operation to enlarge the probability score. The advantage of this evaluation is that it can evaluate which pattern is “better” for the same successful classification, and which pattern is “worse” for the same “failed” classification. In addition, it can also effectively suppress the background. When the training data is limited and the training times are insufficient, the classifiability of each pattern can still be evaluated.
In order to avoid directly taking a large number of samples of the original pattern set in various environmental states, this paper uses the simulation method to simulate the pictures in different shooting states to form a picture library.
Because the patterns are two-dimensional pictures, the process of picture simulation can be simplified. Only the perspective transformation of the plane where the pattern is located can simulate the effect of pattern shooting under different perspectives. In the simulation process, in addition to the perspective angle change, the image scale change, brightness change, background color change (common indoor scene colors such as walls and tables are selected for simulation) and other factors are also considered. The effect of some pictures in the simulated image library is shown in Fig. 10.
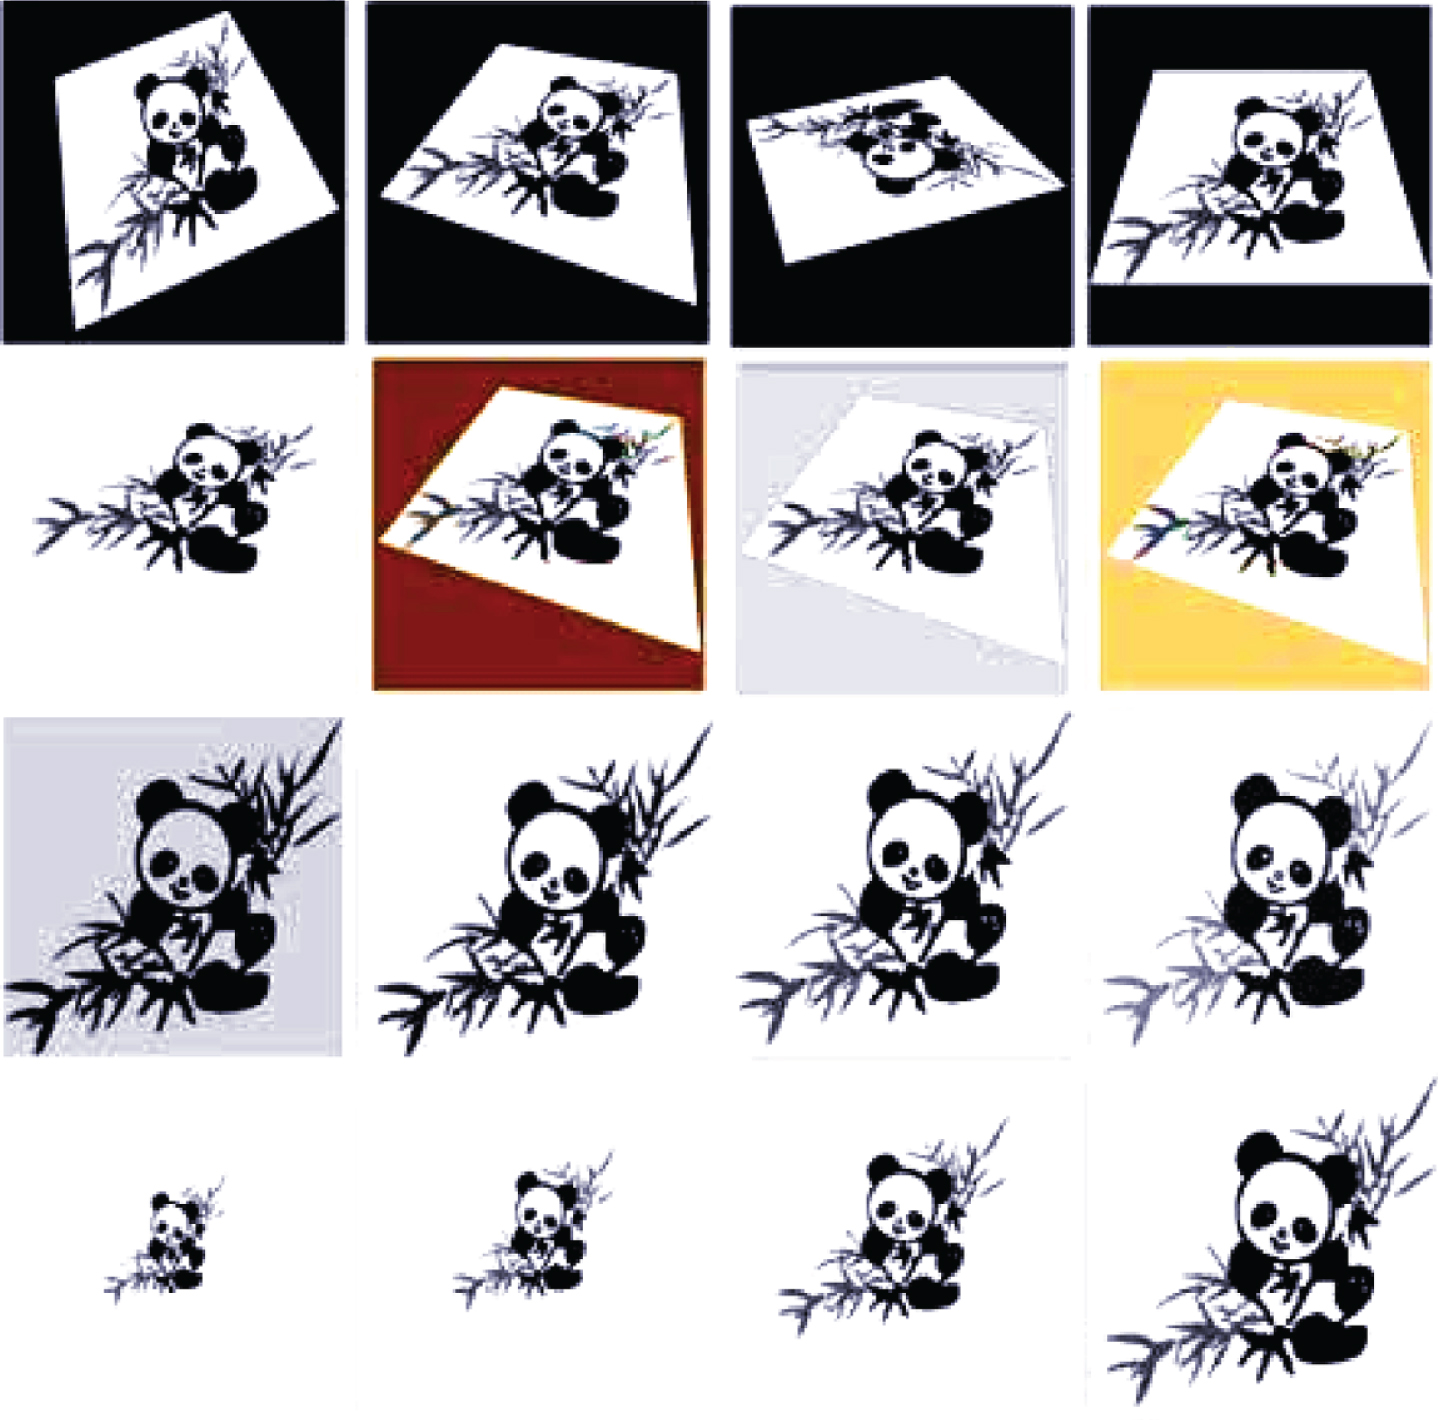
Picture library generated by simulation.
Random transformations such as stretching and angle rotation are carried out on the patterns, and then the transformed pictures are transformed into different brightness to obtain a training database of 500 patterns. In order to ensure that objects other than patterns are not recognized as patterns, the training set should contain 501 samples (the number of categories in the selected pattern set) to represent other objects or areas outside the pattern set. In this paper, pictures taken at different locations in the laboratory are selected as background pictures, and several position frames are randomly cut out for each picture as candidate backgrounds. Finally, the frames with objects are found through human screening, as shown in Fig. 11. All the selected backgrounds together form a background class, which is used as the 501st input convolution network. The background selected in this paper is mainly from the indoor environment of the laboratory. In practical application, different background samples can be selected according to different occasions.
Background sample.
Based on the evaluation method of pattern classifiability and the simulation picture database, the optimization of pattern set is realized. 150 different transformations are generated for each type of pattern simulation, and 300 pictures are selected for the background class. The resnet-50 network was trained by using pytorch, a deep learning framework. There were 501 kinds of patterns and backgrounds, 50000 times of training, and the learning rate was 0.001. Using the evaluation function in Section 3.1, 20 patterns with strong classifiability are selected as shown in Fig. 12, and the 20 patterns are numbered 001–020 in sequence.
20 patterns after optimization.
In order to compare and analyze the classificability of the optimized patterns, take the patterns 001,002,003,004 in Fig. 9 as an example (their numbers in the original 500 patterns are (133,149,166,176), and their classification feature histograms are shown in Fig. 13. it can be seen intuitively that the probability of correct classification is much higher than that of other categories. Figure 14 is the characteristic histogram of patterns 39, 112, 188 and 222 (non-preferred patterns), respectively. the probability of correct category is not sufficiently distinguished from the output probability of other categories (this will affect the anti-interference ability of the classification process in use).

Feature histograms of preferred patterns.
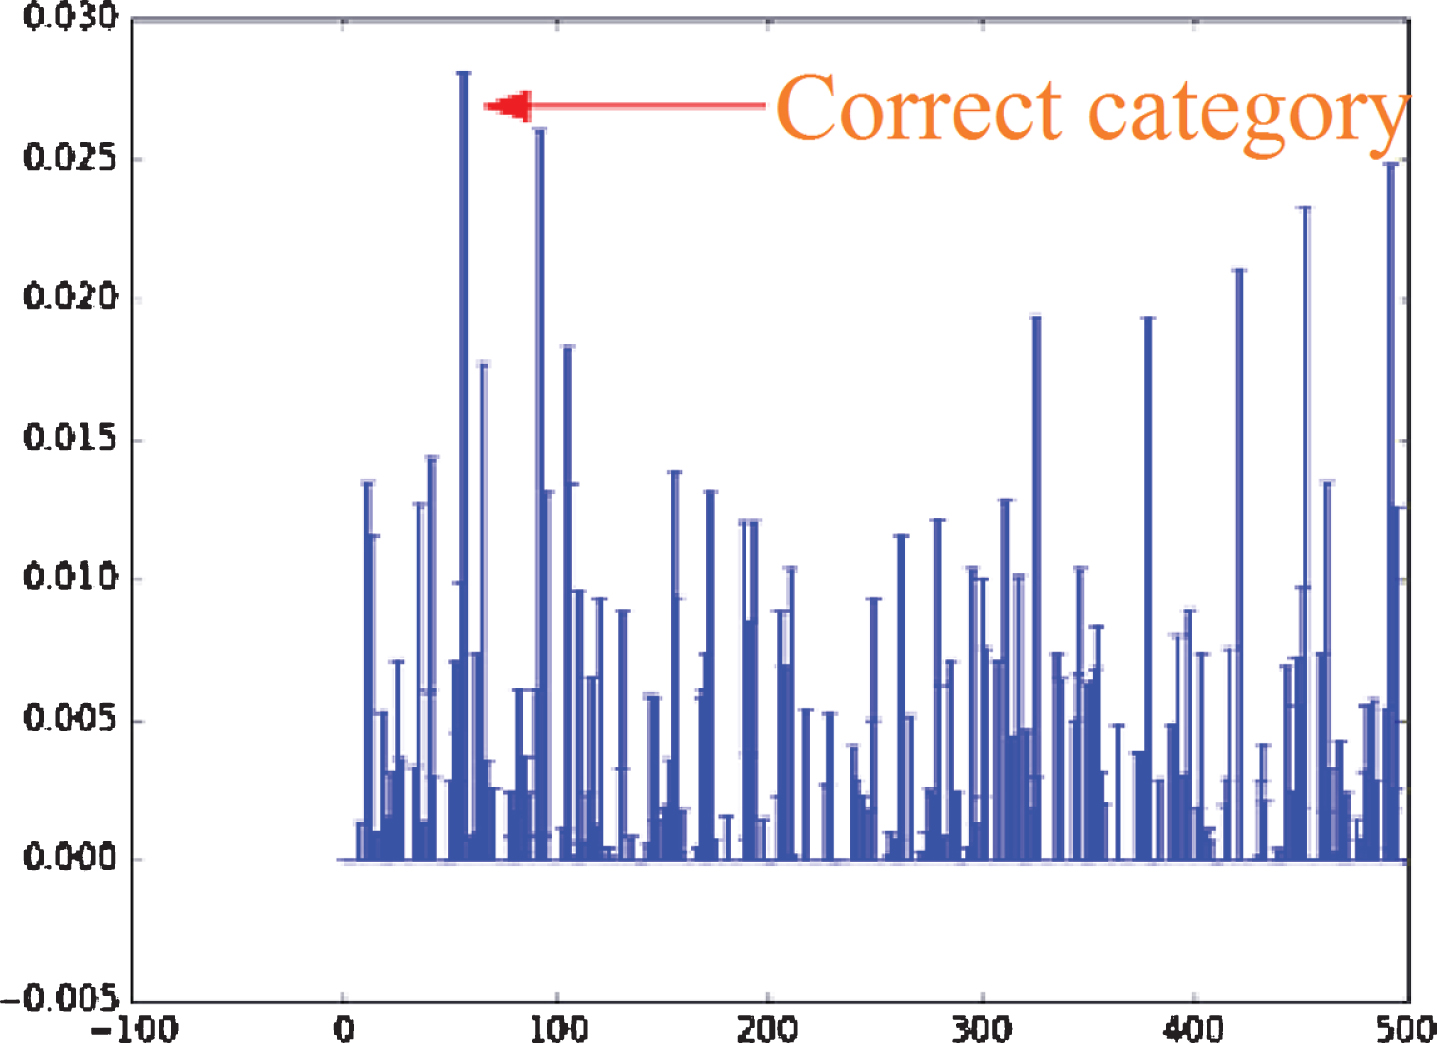
Feature histograms of non-preferred patterns.
Network training based on optimal pattern set
Based on the optimized 20 patterns, each position in the environment is placed and photographed in different states to form a training sample set (some samples are shown in Fig. 15). A total of 5000 sample images were taken, 4000 of which were selected as training sets, and another 1000 were test sets. The accuracy of training sets was 90.6%, and the accuracy of test sets was 85.7%.

Training sample set.
The 20 optimized patterns are mixed with other patterns. The pictures in different backgrounds and angles are taken to observe the false recognition.
Most of the patterns in the above figure can be correctly identified, but there are still mis-identification phenomena. A total of 30 groups of recognition experiments were carried out. The number of false detection of the preferred pattern and the non-preferred pattern is recorded in Table 1 respectively. It can be seen from the data in the table that the optimized pattern has higher recognition rate in complex environment.
Pattern recognition experiment table
Pattern recognition experiment table
Under the influence of COVID-19 epidemic, the pattern recognition of complex environment has been put forward higher request. In this paper, we use the method of adding human logo in the environment, through the design of the classifiability evaluation function for the pattern, the use of image transformation simulation data set, and the use of depth network pre-training evaluation methods, we select the pattern with high classifiability as the logo, using depth learning combined with auxiliary logo to achieve high longitude detection, recognition and positioning of objects in complex environment. Based on the strong recognition ability of deep learning, the auxiliary identification of this method can choose any complex pattern, and take into account the beauty of the environment.
Acknowledgment
This paper is supported by the Humanities and Social Sciences project of The Education Department of Henan Province titled “Feasibility study on the function replacement of traditional villages under the strategy of rural revitalization” (2019-ZZJH-564).