
Abstract
The results of data mining can be used to predict the physical health status of sports athletes and college sports students and provide physical fitness warnings, so that students can pay attention to physical health status and adjust their physical exercise status. Discrete Morse theory, as a powerful optimization theory, plays a big role in algorithm optimization. This paper combines data mining and discrete Morse theory to propose a grid clustering algorithm based on discrete Morse theory. Moreover, according to the theorem that the cell complex reaches the optimum when it has the smallest possible critical point, this study applies the concept of critical points in the discrete Morse theory to optimize the grid clustering process to obtain clustering results. In addition, this study uses the improved C4.5 algorithm to analyze the physical fitness assessment results and obtains a valuable analysis of the physical fitness assessment results.
Introduction
At present, sports, as an important item in the development of human civilization, has made great achievements. The higher, faster and stronger spirit of the Olympics is deeply rooted in the hearts of the people. The world events held by the individual federations, such as the World Cup of football and the World Championship of Basketball, have become common festivals for fans all over the world. As a developing country with one-fifth of the world’s population, China has become a veritable sports power through the unremitting efforts of several generations of sportsmen. It has become the norm for Chinese table tennis champions to take the Olympics, and the name of the diving dream team is well deserved, and the women ’s volleyball team won the World Cup and Olympic double champions, which has pushed Chinese sports to a whole new level. In addition, the upcoming 2022 Winter Olympics will once again focus the world’s attention on China. At present, China’s sports undertakings are at a critical stage of the transformation from a big sports country to a strong sports country [1]. However, as the professional basketball project most concerned by the broad masses of the people, the overall level has not achieved the ideal results achieved with the rapid development of Chinese sports, and gradually lost its dominance in Asian basketball [2], and the gap with the world’s advanced level is showing a trend.
With the progress and development of Internet technology and information technology, China’s research and application of data mining technology has achieved many results. However, in the process of professional athletes instructing athletes to train and compete, the application of data mining technology is still in the exploration stage. Xiangyang Xie believed that data mining technology is rarely used in sports, especially in the exploration stage in China. With the comprehensive information development of China’s sports undertakings, a large amount of data has been accumulated in full-name fitness, professional sports, sports industry, and sports scientific research and teaching. How to effectively use these data and discover information that is often overlooked but of great value has become an important mission for contemporary sports workers [3]. China’s sports field accumulates and continuously expands a large amount of data, so it is a very critical job for sports workers to analyze massive data and mine data value with the help of DM method. At present, the sports field has accumulated massive data, and the application of data mining technology in the sports field has very great prospects [4], which will play an increasingly important role. Using the research methods of sports statistics, Xinhui Zhao collated the research results and related literature of data mining in the field of sports science, and classified and summarized the documents according to different types of analysis management, training applications, sports scientific research, etc. In conclusion, it is found that the current data research data in the field of sports is relatively few for the establishment and application of databases in the field of sports, and it is more focused on simple theoretical analysis. Although the current research is not deep enough, it is gratifying that mining technology has been introduced into sports data analysis projects by some domestic experts and scholars. This phenomenon has important historical significance for us to use data mining technology to analyze sports data in the future, to promote the development of data mining technology in the field of sports, and to apply the analysis results to sports development decision-making and the orderly development of individual sports science.
Related work
This literature used data mining technology to construct mining models to analyze and analyze the sports activities and competition training of college students. Moreover, the literature has developed a scientific and feasible competition training system and used the system to generate teaching programs for daily teaching, which has received favorable comments from teachers and students [5]. With the help of K-Means fast clustering method in data mining, decision tree, CHAD decision tree, sequence association rules, Bayesian network and other means, the literature [6] analyzed the sports consumption structure and characteristics of urban residents, and built models based on relevant data. Moreover, this literature discriminates the characteristics of urban residents’ different sports consumption levels and discusses the relevance of urban residents’ sports consumption items, which provides a theoretical basis and reference value for other scholars to study the statistical regularity of urban residents’ sports consumption. The literature [7] analyzed the characteristics of tennis technical and tactical decision-making needs, used association to build a mining model, and took the data of the correlation between tennis technical and tactical points and hit points as a target to conduct a systematic study. Finally, it is concluded that there is a certain correlation between the points scored and the hitting point in the tennis game, which provides a powerful decision basis for the scheme of controlling different hitting points in the tennis game. The literature [8] built a blue flag technical and tactical analysis system centered on key actions, basketball technical characteristics, and tactical orientation with the help of data mining technology association analysis, Markov-based data mining analysis, and cluster analysis. The analysis result can guide basketball training and competition and has high practical value. The literature [9] analyzed the factors that affect the results of the game in table tennis and built an application model based on the Markov mining algorithm. Finally, it is concluded that in the table tennis competition, the key factors for winning the game are control to hold and control to attack, which is in line with the actual situation of the first world table tennis competition. The literature [10] used data mining association rule algorithm and combined table tennis skills and tactics prototype analysis system to write middleware of development library. This analysis tool has become an effective means to guide the analysis of table tennis techniques and tactics in the coal system, and it has enriched the selection of table tennis techniques and tactics. The literature [11] uses the data mining basketball game phenomenon to use association rules to display real-time live game data and analyze the scene to assist the coaches, which provides reference value and theoretical basis for the deployment strategy of coaches. After predicting the tactics the opponent will use next through data mining analysis methods, the team will be able to take appropriate countermeasures in advance and obtain a chance for the game. The literature [12] systematically analyzed the development status of the data mining analysis system of the dribble project, and constructed model design principles and studied the functional structure of evaluation. After weighing the analysis results of the volleyball actual data mining system, the scholar proposed that the competitive volleyball data mining system has the characteristics of compound functions, data sharing, simple modules, and convenient operation. Moreover, the system can reveal the characteristics of the second pass distribution in the volleyball game, the reasons for the card wheel and the relationship between the points difference and the winning and losing rate of the game, etc., and reflect the inherent regular information of the volleyball game. In addition, developed countries in Europe and America, as sports powers, have applied data mining technology to the operation of professional sports clubs. In particular, in the four major professional league clubs in the United States, data mining has become an indispensable technical and tactical analysis tool and plays an important role in training and competition. The literature [13] divided the half of the ball possession on the basketball court into different shooting areas and analyzed the shots in basketball games. Moreover, it used data mining technology to analyze the area where athletes shoot the best shots, thus providing advice for coaches on how to arrange the best players in the offense. The literature [14] proposed the concept of athlete efficiency value and used it to evaluate the athlete’s efficiency per minute. The literature [15] comprehensively considers other players on the basketball court, home and away, and other related factors. By comparing the efficiency of the club when the player is on the court and the efficiency of the club when the athlete is not on the court, it proposed a comprehensive efficiency value that evaluates the value that the athlete produces to the club, and corrects the comprehensive efficiency value. The literature [16] used scientific data mining techniques to organize and summarize the statistical data of baseball and proposed the “Win share” method to evaluate the contribution of athletes in the game, so as to reasonably measure the value of athletes to the club. In summary, experts and scholars have made some explorations and studies on the application of data mining in the operation and management of professional sports clubs, but the current research has the following deficiencies: (1) The application of data mining technology in the field of sports has been concentrated in theoretical research, but the application of specific research to improve the athletic ability of professional sports club athletes is obviously insufficient; (2) In the application of data mining to the improvement of sports ability of professional sports club athletes, most of the existing research results are in the shallower research stage such as data statistics, and there are few application studies on specific program measures, and the research results are generally practical.
Discrete data mining
Association rule mining is an important technique in data mining. It analyzes the characteristics of itemset and the relationship between them to extract the relevant and potential association rules existing in large databases. Moreover, it effectively finds a positive correlation between two seemingly unrelated things and applies it to production decisions, which is the driving force behind the development of association rule mining [17].
Association rule item set I ={ i1, i2, ⋯ , i m } is a set containing m different items. Among them, each transaction T contains an item set I to make T ⊆ I. After an item set X ⊆ I is given, the transaction T contains X only when X ⊆ T. The association rule is an implication X ⇒ T, where X ⊆ I, Y ⊆ I and X∩ Y = ∅. Among them, X and Y are called the pre-implication and post-implication of association rules, respectively [18].
A well-known example of association rules is that 90% of customers who bought hamburgers also bought Coke. 90% is the confidence of the association rule, which means that 90% of transactions containing X (hamburger) also contain Y (Coke). It can be seen that support and confidence are important concepts that are indispensable for describing association rules:
The probability of a transaction containing X and Y in the support transaction database D is calculated by the following formula [19]:
Confidence The percentage of transactions that contain both X and Y in transaction database D in transactions that contain X is calculated by the following formula:
In the formula, Support (*) represents the support degree of the item set * in the transaction database D, which is the probability of the transaction containing * in D.
From the definitions of support and confidence, it can be seen that the support of association rules measures the weight of the association relationship between item sets, while the confidence of association rules measures the degree of association between item sets [20]. The process of mining association rules is to find all association rules whose support is not less than the minimum support threshold and whose confidence is not less than the minimum confidence threshold, that is, the association rules that meet the following conditions:
Other concepts related to association rule mining:
Candidate n- item set: If the item set X contains n items, the item set X is called the candidate n- item set, and is recorded as C n [21];
Frequent n-item set: The n-item set with support greater than the minimum support threshold is called frequent n-item set and is denoted as L n .
Topological equivalence: If there is a continuous function f : X → Y and its inverse function f-1 : Y → X is also continuous, the space X and Y are said to be topologically equivalent or homeomorphic.
Cell (cell): When a p-dimensional cell α and an open sphere B ={ x ∈ R p : ∥ x ∥ < 1 } with dimension p are fixed to homeomorphism, the cell is denoted as α(p), which means a cell with dimension p.
CW-complex: A CW-complex is any topological space where there is a finite nested sequence ∅ ⊂ X0 ⊂ X1 ⊂ ⋯ ⊂ X n = X. Among them, for i = 0, 1, 2, ⋯ , n, X i is obtained by bonding a cell to X(i-1). Among them, X0 represents a 0-dimensional cell (vertex), and the bonding operation requires that all edges of the bonding cell should be bonded to X(i-1). For example, X ∪ f σ represents the result of bonding element σ to X, and f represents an equivalent relationship.
For example, a torus can be regarded as a cell complex, which is obtained by the following steps:
Hasse diagram: A Hasse diagram of a cell complex K is a directional pseudograph H:
Each node of H represents a cell of K;
The links connecting nodes in H represent the neighboring cells of K, and the source node of each link is the node with the highest dimension.
Figure 2 shows a Haas diagram of a cell complex K (triangle).

Construction of a torus containing 4 cells.

Hass diagram of cell complex K.
Manifold: A manifold is a topological space, and every point in the space has a neighbor homeomorphic to R n or R+ × Rn+1.
Homology groups: For each p, the p-dimensional homology group H
p
= Ker∂
p
/Im∂p+1 is obtained by equating two p- rings with only p- boundary different:
These homology groups are commutative and finitely generated (cell complexes are finite), so they can be written as
On a known cell complex, the discrete Morse function is a real mapping function. It assigns a larger value to each higher-dimensional cell, and it assigns a larger value to the lower-dimensional cell at most once. Its precise definition is as follows:
In other words, the cardinality of these two expressions is at most 1.
The discrete Morse function maps a single value for each simplex of the cell complex K instead of a continuous function on K. The definition of the discrete Morse function gives a basic principle for judging whether there is a discrete Morse function: In a cell complex, the number of cells with a higher dimensional function value lower than the function value of a lower dimensional cell connected to it is at most one. Conversely, the number of cells with a lower dimensional cell function value higher than the cell with a higher dimensional cell connected to it is at most one. Figure 3 shows an example of a discrete Morse function.
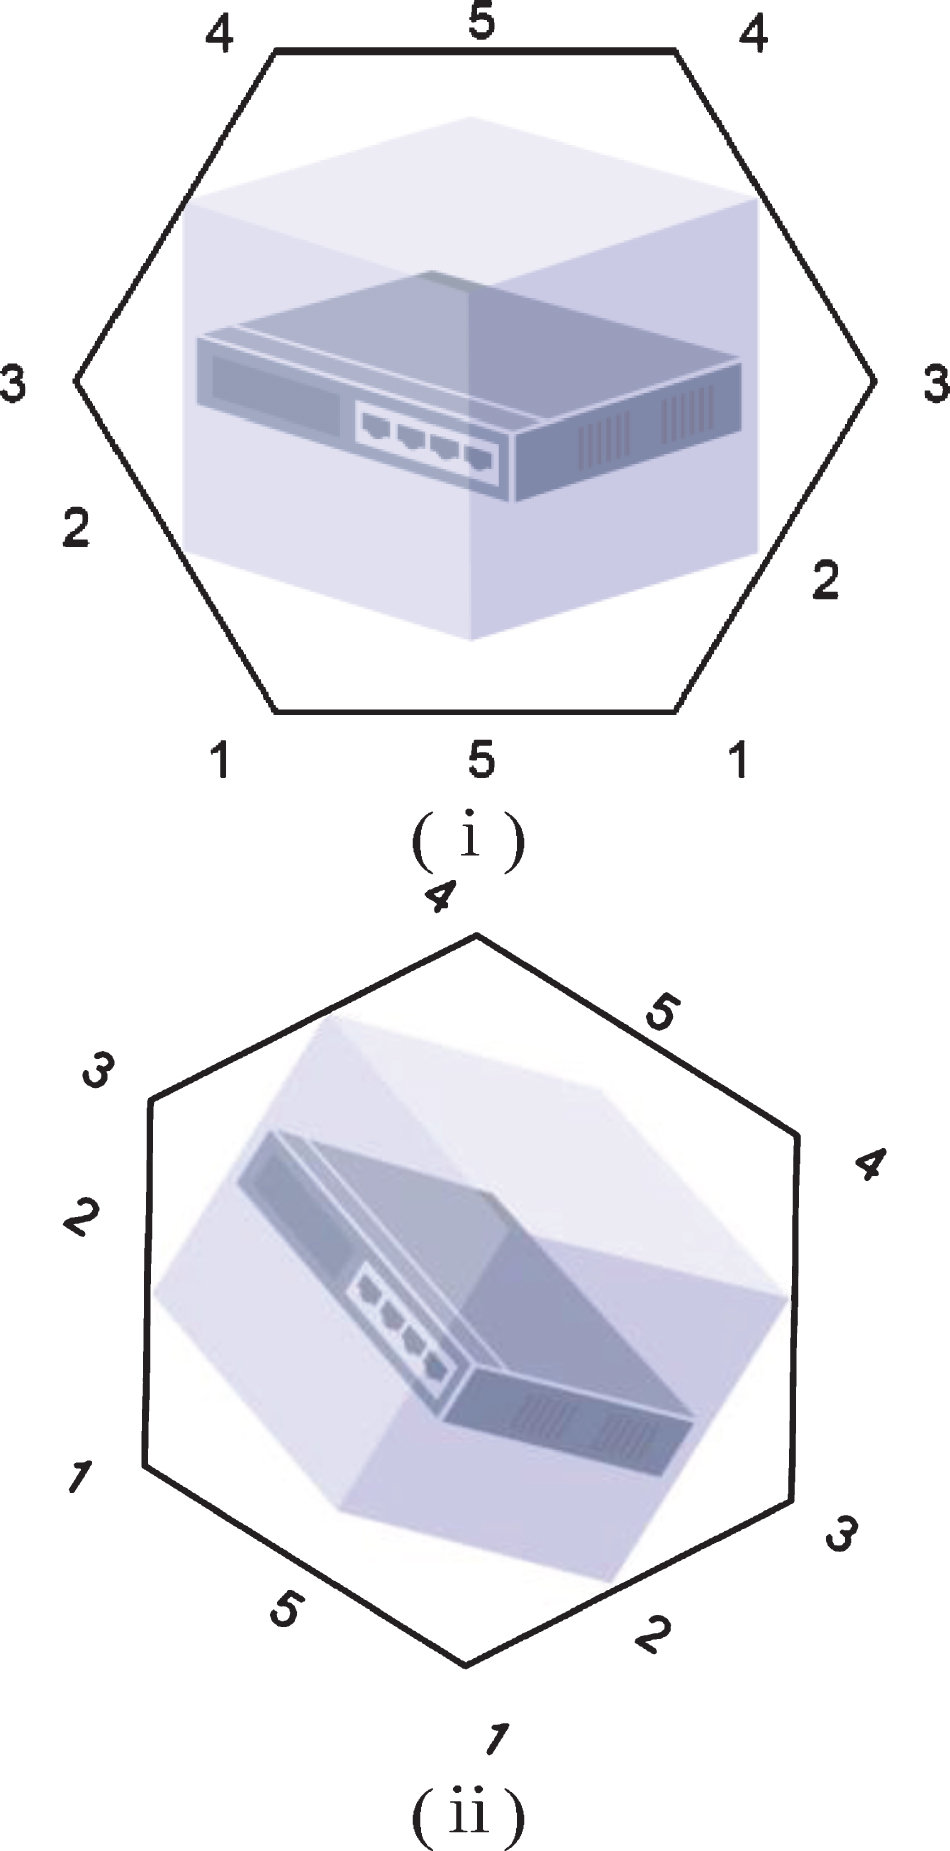
The function f defined on the element complex K.
According to the definition of the discrete Morse function, the function f represented by (i) in Fig. 3 is not a discrete Morse function, and the function represented by (ii) is a discrete Morse function. The reason is that the edge f-1 (0) in (i) has two vertices with smaller dimensions than it, but these two vertices have larger function values, which does not satisfy the second condition in the discrete Morse function. Similarly, the dimension of vertex f-1 (5) is lower than its two adjacent sides, but its function value is larger than that of its two adjacent sides, which violates the first condition in the discrete Morse function. However, the distribution of all function values in (ii) satisfies the two conditions of the discrete Morse function.
An important concept in the discrete Morse function is the critical cell. If the function value of a cell is larger than the function value of the lower dimensional cell and smaller than the function value of the higher dimensional cell, then the cell is called a critical cell. The specific definitions are as follows:
Critical cell A p-dimensional cell α(p) is critical if the following conditions are true:
The cell α is called the critical unit.
If K is a simple complex with the Morse function f, then for any unit α there is the following formula:
The discrete Morse function shows the topological information of the cell complex, and the Morse inequality proved by Morse clarifies more information about the topological properties. Morse inequalities include strong Morse inequalities and weak Morse inequalities.
Strong Morse inequalities For a given finite element complex K, any discrete Morse function f defined on it satisfies;
Among them, m p (f) represents the number of p-dimensional critical cells in the discrete Morse function f, and β p (k) represents the p-th Betty number in the cell complex K. The strong Morse inequality emphasizes that the Euler characteristic number of the element complex represented by the number of critical elements in the discrete Morse function is greater than or equal to the Euler characteristic number of the element complex represented by the Betty number. The Euler characteristic number is a topological invariant that represents the complex topology of the element. The Euler characteristic number of a two-dimensional polyhedron = the number of vertices-the number of edges + the number of faces.
Weak Morse inequalities (Weak Morse inequalities) For a given finite element complex K of dimension n, any discrete Morse functions above it satisfy:
Among them, χ (k) is the Euler characteristic and # p (k) is the number of K-dimensional units.
The weak Morse inequality shows that the Euler characteristic number of the element complex K can be expressed by the number of critical elements, Betty numbers, and the number of i-dimensional elements in K. Therefore, compared with the weak Morse inequality, the strong Morse inequality gives the topology information of the element complex K more strictly.
Information gain rate is an important concept in the C4.5 algorithm. When building a decision tree model, attribute selection is performed by calculating the information gain rate of each attribute. We set the data set collection to D, and the data sample in the data collection D to d, the data set D has m different class attributes, these class attributes have different values, and they are labeled Ci (i = l, 2,..., m). Therefore, the amount of classified information can be expressed by the following formula:
The proportion of C i is represented by p i , and p i can be calculated by C i /d. The reason for using a logarithmic function based on 2 in this study is that the information is encoded in binary.
We assume that one of the attributes is denoted as A, A has v different values, and these values can be expressed as {a1, a2, …, a
v
}. Therefore, the data set D can be divided into v different subsets by the A attribute, which is denoted as {D1, D2, …, D
v
}. Among them, D
j
(j = 1, 2, …, v) is represented as a set of samples with the same value a
j
(j = 1, 2, …, v) on the attribute A. We assume that c
ij
represents the total number of samples belonging to category C
i
in subset D
j
. The information entropy formula for calculating attribute A is as follows:
In the above formula,
In the above formula,
Therefore, the information gain of attribute A can be calculated by the following formula:
The entropy SplitInfo
A
(D) of the attribute A is calculated, and the calculation formula is as follows:
In the above formula, p
i
represents the proportion of the data whose attribute A is a
j
in the entire data set, which can be calculated by d
j
/d. Therefore, the information gain rate formula of the attribute A can be obtained, as shown in the following formula:
The strategy of the C4.5 decision tree classification algorithm is to calculate the information gain rate of all test attributes in the candidate data set, and use the attribute of the maximum information gain rate as the current division attribute, and finally complete the construction of the decision tree by iterating the above process.
The improved estimation process of the information gain rate is as follows:
If it is assumed that, for a two-dimensional random variable (X, Y), there is an expectation:
then this expectation is called the covariance of the random variable X and the random variable Y and is written as:
If the two-dimensional random variable (X, Y) is a discrete random variable, its probability distribution is
Then, the covariance of the random variable X and the random variable Y is:
If the two-dimensional random variable (X, Y) is a discrete random variable, its probability distribution is: All discrete.
Then, the covariance of the random variable X and the random variable Y is:
Through the study of mathematical expectations, we can know the nature of mathematical expectations. Then, we can use this to simplify the covariance, as follows
The relationship between the variance of the random variable and the covariance of the random variable is:
In particular, when the random variable X and the random variable Y are independent of each other, D (X + Y) = D (X) + D (Y) is the correlation coefficient between the random variable X and the random variable Y.
In the case where it is not easy to confuse, ρ XY can also be simply written as ρ. In particular, when ρ XY = 0, the random variable X is said to be uncorrelated with the random variable Y.
The C4.5 algorithm only considers the relevance of class attributes to test attributes but does not consider the relevance of each test attribute. When the correlation between the two attributes is strong, there will be a high degree of redundancy between the two attributes. The sum of the correlation coefficients of one test attribute and all other test attributes is calculated as follows:
ρ is the sum of the correlation coefficients of test attribute A and all other test attributes, and represents the correlation between test attribute A and all other test attributes, that is, the redundancy of test attribute A and all other attributes. F means all test attributes except the test attribute A, and f means an element of m, namely f ∈ F. The following formula represents the average correlation coefficient between test attribute A and all test attributes.
Since the selection test attribute standard of the C4.5 algorithm is the information gain rate, in order to balance the impact of other test attributes on the test attribute, this paper adds the average correlation coefficient between the test attribute A and other test attributes on the basis of the original information gain rate. When calculating the information gain rate for the test attribute A, the calculation formula of the improved information gain rate is as follows:
It can be seen from the above formula that the lower the correlation between the test attribute A and other test attributes, that is, the smaller the redundancy, the smaller the ρ, and the larger the information gain rate calculated. It can well solve the problem of high redundancy between attributes.
The improved algorithm is simplified and the final result is:
It can be seen from the above formula that there is no longer a logarithm operation in the calculation of the information gain rate of the improved C4.5 algorithm, and it is replaced by the addition operation, subtraction operation and division operation that are relatively easy to deal with by the computer, so the calculation efficiency of the C4.5 algorithm is greatly improved. At the same time, because the improved C4.5 algorithm not only considers the multi-value bias problem when calculating the information gain, but also considers the redundancy between attributes, the improved C4.5 algorithm can select a more reasonable attribute value.
The process of constructing a decision tree of the improved C4.5 decision tree generation algorithm is shown in Fig. 4. The process of the improved C4.5 algorithm is as follows:1)Data preprocessing includes continuous attribute discretization, missing values, filling and other links, and formula (27) is used to calculate the average redundancy of each attribute and other attributes. 2) The algorithm continuously selects test attributes, divides the training set, generates nodes, marks nodes, adds nodes to the decision tree, and finally outputs the results.3)When all the instances in the divided subset meet the following test conditions: all belong to the same class, or all have the same attribute value, or the number of instances is less than a certain threshold, the node is identified as a leaf node. Otherwise, the node is a non-leaf node and is identified as the selected test attribute.4)According to the calculation result of formula (27), the information gain rate of the test attribute is calculated, and the best test attribute is selected. Moreover, the algorithm is called recursively until the node is added to the decision tree. The specific improvement process is shown in Fig. 4.

C4.5 algorithm improvement process.
Data cleaning means that some special values in the data file that can affect the results of statistical analysis are processed. Therefore, the work of data cleaning includes: filling in missing data; processing noisy data to make it as smooth as possible; handling outliers; and solving inconsistencies. In the database of this research system, due to the large amount of data and the problem of data quality, some attributes in the data will have null values, and some attribute values will be incorrect. These problems can be solved by data cleaning technology. The pre-processed data obtained by the tester is shown in Tables 1 and 2.
Physical examination data of students after data cleaning (male)
Physical examination data of students after data cleaning (male)
Physical examination data of students after data cleaning (female)
According to the evaluation of the machine learning method in this article, the final score is obtained. The core of data conversion is to normalize the data. All continuous attributes are discretized, that is, the data of students’ physical health assessment are discretized. The results are shown in Tables 3 and 4, and the statistical diagrams are shown in Figs. 5 and 6.
Student physical examination score (male)
Student physical examination score (female)

Statistical diagram of students’ physical scores (male).

Statistical diagram of students’ physical scores (female).
The data source is the physical examination results of a college sports major. The data preparation is completed through five steps: data collection, data preprocessing, data integration, data cleaning, and data conversion. Moreover, the obtained data is used to construct a decision tree. Since the data includes male physical fitness evaluation data and female physical fitness evaluation data, two decision trees are generated: one is the male physical evaluation decision tree and the other is the female physical evaluation decision tree. Through the analysis of the two decision trees, it is found that the biggest factor affecting male is the vital capacity, and the biggest factor affecting female is the step test. Therefore, when improving the physical health of students, different measures should be formulated for male and female.
At present, computer networks have become very popular in universities. Using data mining technology, the establishment of a college sports performance management system can provide administrators, teachers, and students with sufficient information and quick query methods, complete teacher registration work, and perform statistics, analysis, and processing of data. Moreover, the decision tree can be used to realize data mining on the key links that affect the performance of learning sports. This study analyzes various decision tree algorithms, finds the algorithms that are specific to the characteristics of the Sun Sports system, and conducts in-depth learning and research, and finds suitable improvement methods to make the improved algorithms more accurate and efficient. After studying and comparing, it is found that the C4.5 algorithm can better meet the requirements. This study improves the algorithm from the following aspects: The one is to improve the discretization method and improve the efficiency of the algorithm. The second is to add correlation coefficients as parameters to make the selected test attributes more reasonable. The third is to simplify the improved information entropy calculation formula to further simplify the calculation and improve efficiency.