



Abstract
Text-to-voice conversion is the core technology of intelligent translation system and intelligent teaching system, which is of great significance to English teaching and expansion. However, there are certain problems with the characteristics of factors in the current text-to- voice conversion. In order to improve the efficiency of text-to- voice conversion, this study improves the traditional machine learning algorithm and proposes an improved model that combines statistical language, factor analysis, and support vector machines. Moreover, the model is constructed as a training module and a testing module. The model combines statistical methods and rule methods in a unified framework to make full use of English language features to achieve automatic conversion of letter strings and phonetic features. In addition, in order to meet the needs of English text-to- voice conversion, this study builds a framework model, this study analyzes the performance of the model, and designs a control experiment to compare the performance of the model. The research results show that the method proposed in this paper has a certain effect.
Introduction
With the growing maturity of voice recognition and voice synthesis technologies, natural voice processing has become a focal issue in the field of voice signal processing. The continuous upgrading of hardware chips makes it possible to process complex voice in real time. At present, the natural human-computer interaction interface has become the focus of voice technology research. In order to improve the naturalness of the human-computer interaction interface, speaker voice conversion technology is gradually developed. The purpose of speaker voice conversion is to modify the voice of one speaker (source speaker), so that the modified voice sounds like what another speaker (destination speaker) said. This modification requires changing the speaker characteristics contained in the voice and retaining the semantic information expressed by the voice. Researchers use speaker voice conversion technology to make machine voice with the characteristics of a specific speaker and make the application of voice technology more user-friendly [1].
As a frontier branch in the field of voice signal processing, speaker voice conversion technology is more difficult, but its research work has high value. The research of speaker voice conversion has made certain contributions to almost every field of voice signal processing, such as voice analysis, voice synthesis, voice recognition and speaker recognition. Specifically, its significance has the following aspects [2]: Speaker voice conversion inevitably requires a detailed analysis of the voice, such as studying the relationship between the changes in the parameters of the vocal source and the rhythmic characteristics of the voice, and studying the influence of the formant location, width and amplitude on the dialogue sound. This work is not only beneficial to voice synthesis, but also improves the naturalness of the text-to-voice system. Moreover, it may also promote the advancement of voice coding technology and will also improve the performance of voice enhancement systems. (2) The research on speaker normalization methods will promote speaker adaptation research in voice recognition. In modern voice recognition technology, a very important research topic is the voice recognition of non-specific speakers. When different speakers speak the same phoneme, due to differences in physiological parameters, the acoustic parameters of voice are not the same. One of the purposes of studying speaker voice conversion is to make the acoustic parameters of the source voice and the acoustic parameters of the destination voice as consistent as possible. (3) It is helpful to promote the development of speaker recognition technology. Speaker recognition does not pay attention to the semantic content of the voice signal but hopes to mine the speaker characteristics in the voice signal to achieve the speaker identification and recognition. Through the study of speaker voice conversion, the semantic information in the voice signal can be separated from the speaker information, which is helpful to find important features that affect speaker recognition [3]. In summary, speaker voice conversion technology has important research value. Fortunately, through the continuous efforts of researchers in phonetics, the technology has been developed to some extent.
Related work
The literature [4] proposed a relatively mature speaker voice conversion system. The system uses vector quantization technology and uses the codebook to represent the spectral characteristics of different speakers to train the speaker’s voice to establish the mapping relationship between the spectral envelope, energy and pitch frequency between different speakers. After that, the voice parameters are converted through codebook mapping, and finally the converted voice is synthesized with a linear predictive synthesizer. The literature [5] proposed a similar method, and it only replaced the codebook mapping with a multi-layer neural network for the conversion model. As a result, the quality of the converted voice has been greatly improved, and this inspiring result has promoted the further study of the speaker’s voice conversion. The literature [6] proposed to replace the linear predictive synthesizer with the pitch synchronous superposition algorithm to convert the residual signal. In this method, pitch synchronization and superposition techniques are used to align and convert the excitation signals in time, and the method of multiple linear regression and dynamic frequency rounding is used to convert the spectral envelope. Since the limitation of the traditional linear predictive synthesizer is broken, the quality of the voice converted by this method has been further improved. The literature [7] proposed to use the harmonic plus noise model to convert the time length and pitch frequency. The system uses the Gaussian mixture model to classify the speaker feature parameter space and estimates the mixed linear transfer function according to the principle of minimum mean square error. The feature parameter trajectory converted by this method is continuous, so it is more effective than the feature parameter conversion by vector quantization.
In recent years, there have been many excellent software of text-to-voice conversion, such as: InterPhonic of IFLYTEK, Microsoft ’s Mi-crosoft Voice SDK, Jietong Huasheng voice synthesis software and so on. These can better realize the function of outputting voice in real time after inputting text. Moreover, the clarity and intelligibility of Chinese voice synthesized by this voice synthesis software can reach a high level. However, due to technical limitations, there are still some deficiencies when synthesizing Chinese voice, such as the lack of different age characteristics, different gender characteristics and the expression of tone, speed, tone, and lack of personal emotional color and language style [8]. With the development of technology and the advancement of voice synthesis technology, people try to add various subtle, complex, different emotions and language styles to the synthesized voice to improve the naturalness of the synthesized voice, enhance the expressiveness of the voice, and then promote the development of human-computer interaction. In order to express the style and emotion of the speaker, the tone, speed, tone, etc. of the synthesized voice should all exhibit certain characteristics. This requires a deep analysis and research on Chinese rhythm and rhythm based on a large number of research results on Chinese rhythm, rhythm and intonation, so as to reflect the expressive power of voice in synthesis and enhance the naturalness of synthesized voice [9]. There are many research methods around improving voice performance. For example, literature [10] proposed expressive voice acoustic modeling based on neural network. The modeling method uses the context parameters and the emotion label PAD value of emotional voice as input parameters and uses the acoustic features of emotional voice as output parameters and uses the STRAIGHT algorithm to modify the acoustic features of neutral voice to obtain converted emotional voice. The literature [11] proposed a PSOLA-based Chinese-to-voice conversion system that changes the pitch and length of words to adjust the prosody at the word level and sentence level to achieve high definition and naturalness. The literature [12] uses a grammar and operation to obtain the mode adjustment of the entire text from the emotional color and style color attributes of each word. Furthermore, through the mode adjustment, the literature obtained the corresponding reference values of pitch. Finally, through this reference value, the literature adjusted the voice rate and scale of the synthesized voice, thereby making the synthesized voice smoother and more natural, enriching the expressive power of the synthesized voice, and improving the quality of voice synthesis. Some studies have suggested that Chinese stress is closely related to parameters such as pitch and duration of voice [13]. Moreover, the pause reflects the tightness of the connection between syllables and between syllables and silent segments [14]. In addition, the voice rate can be achieved by adjusting the delay time according to different information frames [15]. The literature [16] proposes to use the prosody features of Mandarin Chinese, the method of dynamically synthesizing patterns and the time-domain pitch synchronization overlay method (TD-PSOLA) to modify both time and fundamental frequency scales, which can achieve higher-quality prosody voice synthesis. The literature [17] proposed an improved method for smooth transition between voice units and a combination method of words on the basis of word segmentation for the problem of insufficient natural degree of voice s f (O|W, L, Λ) ynthesis. Moreover, it analyzed the law of tone processing in voice synthesis, and finally applied these methods and laws to Chinese text-to-voice conversion and obtains a relatively good conversion effect. The literature [18] collected news simulcast voices and established a corpus to synthesize high-quality voices with personal characteristics of news anchors.
Application of statistical language model in language recognition
For the phoneme recognition result of a voice, in order to determine which language it belongs to, we can judge it according to the maximum likelihood estimation (MLE), and it is defined as [19]:
Among them, O represents this segment of voice, and Λ represents the acoustic model. refers to the probability of obtaining the phoneme sequence W in the case of voice segment O in language L and acoustic model Λ. Meanwhile, P (W|L) represents the probability of occurrence of the phoneme sequence W in a certain language L.
In the case of using the best phoneme sequence output,
is used to replace possible paths. Since the same phoneme recognizer is used, f (O|W, L, Λ) is independent of language L. Finally, Equation (1) is simplified to:
Statistical language model is a general term. The two models commonly used in language recognition are N-gram grammar language model and binary decision tree model.
The N-gram language model is the most widely used language model. In the field of voice recognition, it is mainly used to predict the next occurrence of a word given a known sequence of words, which can greatly improve the accuracy of voice recognition. Moreover, inspired by voice recognition, people naturally introduce the N-gram language model into language recognition, which is mainly used to calculate the occurrence probability of a given phoneme sequence in a language. The main idea of the N-gram language model is to use an N - 1-order Markov process to approximate the generation process of the symbol sequence. For example, for sequence W* = w1w2 ⋯ w T , the probability is:
Among them, the history before w i is denoted by h i = w1w2 ⋯ wi-1. The last step of the equation is to use the Markov process to approximate that w i is only related to the preceding N - 1 symbols, which can greatly simplify the calculation. In practical applications, the logarithm of the formula is usually taken, and the multiplication is converted to addition. In language recognition, depending on the size of the training corpus, a 3-gram language model or a 4-gram language model is usually used. In general, the more training corpus, the higher the order of the language model obtained by training (usually no more than 4), and the better the language recognition performance.
To train an N-gram language model is to estimate the posterior probability P (w
i
|wi-N+1wi-N+2 ⋯ wi-1). Among them, the simplest and most commonly used method is to use maximum likelihood estimation (Maximum Likelihood Estimation, MLE)
It can be seen that the calculation is extremely simple, and it is only necessary to count the number of occurrences of different collocations in the training corpus. If the phoneme set contains V phonemes, then the N-gram language model has V N parameters that need to be estimated.
If the order of the language model can be dynamically determined according to the distribution of actual data and the same language model can also contain different orders. Then, the above two problems can be effectively solved. Therefore, a binary decision tree model was introduced.
In the N-gram language model, the probability of w
i
appearing later can be predicted according to N - 1 historical phonemes h
i
= w1w2 ⋯ wi-1. Each phoneme in wi-N+1wi-N+2 ⋯ wi-1 is called a predictor, for a total of N - 1 predictors. Figure 1 is a schematic diagram of a binary decision tree, which consists of three parts: Internal nodes (corresponding to circles in the figure). When asking a binary question to a predictor, such as “whether the value of a predictor is in a certain phoneme subset”, the system only needs to answer “yes / no”. Leaf node (corresponding to the ellipse in the figure). It stores the probability that the leaf is followed by each phoneme. Branch. It refers to a path to a child node (internal node or leaf node) obtained by answering the question raised by the internal node.

Schematic diagram of the binary decision tree.
After a historical phoneme string h i = w1w2 ⋯ wi-1 is given, the probability of being followed by w i can be calculated by the following steps: starting from the root node, the questions on internal nodes are answered. Then, according to the value of the corresponding predictor, the algorithm goes to the corresponding child node, and this process is repeated until the algorithm goes to a leaf node to find the probability of the predicted w i stored in the leaf node.
The binary decision tree model is used to calculate the logarithmic form of Equation (4):
l i is the corresponding leaf node on the binary decision tree found according to the value of w i ’s predictor, and P (w i |l i ) is the probability of w i appearing behind this leaf.
For phone voice, phoneme recognizers based on the NN/HMM architecture are more suitable. Although the performance of the phoneme recognizer of the GMM/HMM architecture in language recognition is slightly worse, some technologies are still very desirable. For example, some adaptive or feature transformation techniques are used to eliminate the influence of speakers and channels: based on GMM/HMM-based language recognition in the system, WadeShen proposed to adopt
The training set is x = { x
i
} , i = 1, 2, 3, ⋯ , n, x
i
represents a sample instance, x
i
∈ R
D
, and D represents the feature dimensions of the sample. The corresponding covariance matrix is
Among them, A is the sample mean, and the corresponding principal component can be obtained by performing eigenvalue decomposition on the covariance matrix. Meanwhile, the first principal component is the eigenvector associated with the largest eigenvalue, and so on.
In order to verify that in a language recognition system based on phoneme recognition, for a specific voice segment, the phoneme recognition NIST provides the LDCCallFriendCD1 number.
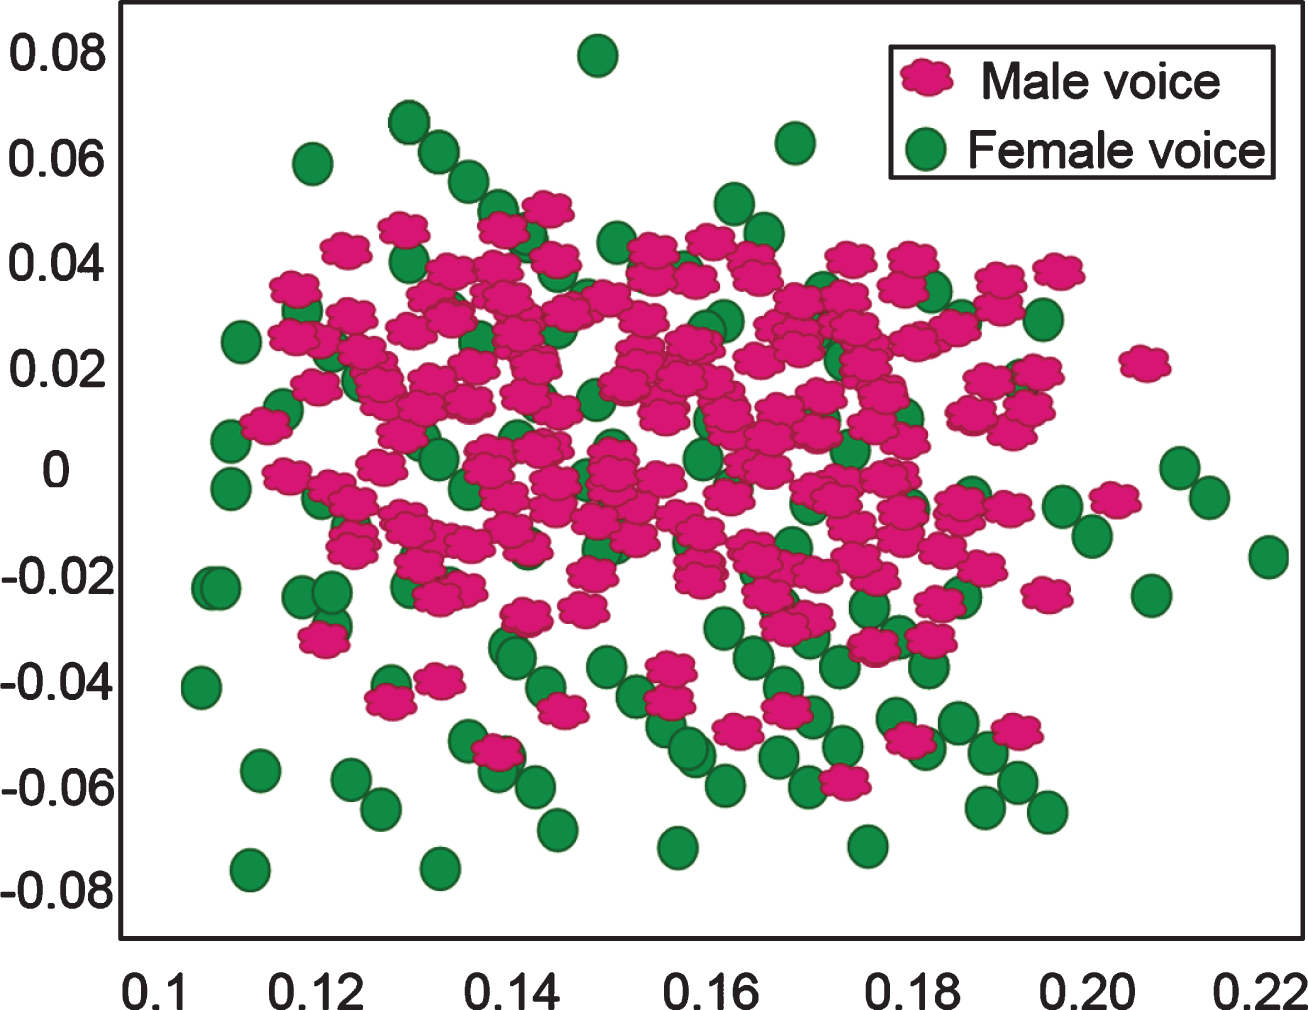
According to the analysis, the English part contains 10 conversation-style phone recordings, each conversation lasts 5-30 minutes, and contains 20 speakers and various channels. Moreover, these voices are cut into 851 small segments, each effective voice length is not Less than 30 s. These features are analyzed by principal components, the first two-dimensional principal components are taken, and the scatter plot is drawn as shown in Fig. 2.
Two-dimensional representation of voice.
It can be seen from Fig. 2 that the first component depicts the difference between male and female voices, which shows that our existing phoneme recognizer fails to remove the influence of noise such as speaker channels; At the same time, it also illustrates the possibility of modeling such noise, and then the necessity of removing the influence of noise..
The mathematical model of factor analysis is described as follows:
or
Among them, x is the observation vector, μ is the mean vector, F is the common factor and is an unobservable hidden variable, which subject to N (0, 1) distribution. Matrix A is called the factor load matrix, which reflects the relationship between the observed variable and the factor. Meanwhile, ɛ is the special factor or noise factor, which indicates the part that cannot be contained by the previous s hidden factors. It is generally assumed that ɛ follows the normal distribution N (0, ψ).
At present, language recognition research is mainly aimed at telephone channel voice, so the difference between speaker and channel is the main factor affecting the performance of language recognition.
For an GMM - UBM acoustic model with a model mixing number of m and a feature vector of d dimension, it can be considered that each Gaussian component reflects a specific pronunciation. In this way, for the u-th sentence of the language L, each frame can be allocated by calculating the state occupancy rate of each frame relative to each Gaussian component and calculating the state occupancy rate of each frame relative to each Gaussian component. For the c-th Gaussian, the mean M
uc
(L) of all the frames assigned to this Gaussian is calculated. At the same time, it can be considered that M
uc
(L) represents the characteristics of a particular pronunciation in this sentence. The matching degree of M
uc
(L) and the c-th Gaussian component reflects the matching degree of the acoustic feature of the specific pronunciation in this sentence to the corresponding Gaussian component in the GMM - UBM acoustic model, which can be measured by its likelihood:
Among them, M uc (L) is the d-dimensional column vector, μ c is the mean of the c-th Gaussian, and ∑ c is the covariance matrix of the c-th Gaussian, which is a diagonal matrix of d × d. It can be seen that the value of p (M uc (L)) is determined by M uc (L) - μ c . In other words, M uc (L) - μ c reflects the influence of noise on this particular pronunciation.
In order to reflect the influence of noise on all m pronunciations, we put all m M
uc
(L) - μ
c
into a d × m-dimensional supervector M
uc
(L) - M (L). If it is assumed that the influence of noise can be described by a lower-dimensional noise space, then M
u
(L) can be expressed as
Λ is the noise load matrix, which reflects the influence of the noise subspace on the characteristic parameters, and X u (L) is the noise factor, which follows the N (0, 1) distribution.
In a language recognition system based on word graph output, noise also affects how well the acoustic features match the phoneme model in the phoneme recognizer. However, due to the complexity of the decoding process, we cannot directly describe how well the acoustic features corresponding to a phoneme in a certain segment of voice match the corresponding phoneme model.
Table p (w|l) shows the probability of the path W in the word graph 1, and this can be seen as a representation of the degree of matching between the acoustic features of the phonemes present in the voice and the phoneme model: the higher the degree of matching, the greater the p (w|l), The lower the matching degree, on the contrary, the smaller the p (w|l), the higher the matching degree. Therefore, the N - Gram probability obtained from the word graph statistics reflects the influence of the above matching degree.
For the output of the word graph of a voice in language L (numbered as the u-th sentence), we construct the following vector representation in factor analysis
Compared with the vector representation of bagofN - Gram, it mainly uses the logarithmic form.
Since there are speaker and channel differences in each voice, we assume that the feature vector represented by (13) is obtained by adding a bias to the feature vector of the corresponding language. Specifically, for the feature vector M
u
(L) of the voice in the u-th sentence of language L, it is expressed as:
Among them, M (L) is the mean value of the feature vectors of all training corpora by language L. Λ represents the noise space and is used to describe the distribution of noise in low dimensions, which is represented by the matrix of m × s. Meanwhile, m is the dimension of the feature vector, and s is the dimension of the noise space Number. X u (L) is the noise factor, which is the s-dimensional vector projected from M u (L) to the noise space Λ and conforms to the N (0, 1) distribution, ɛ u (L) represents the residual, which conforms to the N (0, ψ) distribution.
For language L, there are U (L) sentences of voice M1 (L) , M2 (L) , ⋯ , MU(L) (L), and the corresponding noise factor is X1 (L) , X2 (L) , ⋯ , XU(L) (L). Then, the likelihood of all sentences is
Parameter (Λ, Ψ) is estimated using MLE criterion to maximize the likelihood of all training data:
The parameter estimation uses the EM algorithm, which estimates the implicit variable X i (L) from the initial value of parameter (Λ, Ψ) or the value of the previous iteration and the training data. Then, the new parameter (Λ, Ψ) value is estimated based on the implicit variable X i (L) and the training data, and iteratively repeated until convergence. The specific algorithm steps are as follows:
1) Initial parameter model: Initial Λ is randomly generated, M (L) is the feature vector of all training corpora from language L is the feature vector of all training corpora from language L, and Ψ is initially the variance of all training corpora;
2) E (expectation): According to the last iteration result of the model parameter (Λ, Ψ) and the training data, the first-order and second-order statistics of the noise factor X
i
(L) of each sentence are estimated by maximizing the likelihood function:
3) M (maximization): The new parameter (Λ, Ψ) is updated according to the estimated first and second order statistics of the noise factor X i (L):
4) Steps 2) to 3) are repeated until the algorithm converges. Generally, the algorithm can end after 3-4 iterations.
For a test sentence, we hope to remove the noise-affected part of its feature vector and retain its language information. The specific formula is as follows:
The noise factor is obtained by formula (16). Since the test does not know the language to which it belongs, M (L) is replaced by the mean value of the feature vectors of all training corpora.
In order to verify the effectiveness of the factor analysis method proposed in this paper, we test on NISTLRE2007 and experiment on PRLM. At the same time, the training data uses LDCCallFriendCD1 data, OHSU and some new language training data in the 2007 test. The noise space Λ is also estimated from these training data, and the number of noise factors is 10. bag ofN - Gram features are obtained from word graph statistics and smoothed by UBM.
3 - gramPRLM is adopted to perform training and testing. Because the system PRLM has sufficient training data when training the language model, it is considered to be speaker channel independent and the system only compensates for the development and test sets. The experimental results in each case are shown in Table 1.
Comparison of NISTLRT2007 factor analysis method and baseline system experimental results
It can be seen from Table 1 that the factor analysis method is effective for long-term testing, and the system performance is improved by 17.8% relative to the 30sPRLM baseline system. However, it is not much improved for the 10 s test, and the performance of the 3 s test is slightly reduced. There are two main reasons for this situation: because the noise factor training process uses 30 s long voice, the training and test do not match during short-term voice testing. Meanwhile, it is difficult to extract the speaker channel information contained in the short-term voice and estimate the reliability, so that the performance improvement is not large and may even have a counter-productive effect.
When Introducing support vector machines into the language recognition task based on phoneme layer information, it must meet the following two requirements:
1) The Kernel function can measure the similarity of two voices
2) The kernel function should be easy to calculate and store
The structure of the kernel function is derived from the perspective of measuring the similarity of two voice segments. First, we need to select appropriate features to describe a piece of voice, ang we use the “ bag ofN - Grams” method and draw on the idea of bag of words in text classification. If it is assumed that the phoneme sequence W represents a possible path (phoneme sequence) in the word graph 1, the probability that the corresponding N - Gramd
i
appears is
Among them, count (d
i
|W) represents the number of times a certain N - Gramd
i
appears in the sequence W, and p (W|l) represents the probability of the path W in the word graph l. When putting the probability of all N - Grams into a vector, we can get the “ bag ofN - Grams” feature vector S:
Next, we will discuss how to measure the similarity between two sentences. If the word graph structures corresponding to two specific voice segments are assumed to be l1 and l2, then the similarity between l1 and l2 can be expressed as:
Among them, p (d
i
|all) represents the probability of d
i
appearing in the entire training corpus. When the value of x of the logarithmic function log(x) is around 1, we can make a first-order approximation log(x) ≈ x - 1. At this time, formula (25) can be approximated as
After removing the constant term, the similarity of the two voices can be finally expressed as
The higher the score, the more similar the N - Gram combination that appears in the two voice segments, that is, the two voice segments are more similar and more likely to belong to the same language.
We observe the expression of the kernel function, and we can see that it weights the probability of each N - Gram appearing first, and then calculates the inner product of the weighted vector. The reason for this is that the distribution of N - Gram is very uneven and the probability of some N - Gram appearing is far greater than the probability of others N - Gram appearing. Therefore, if we do not use weighting but simply use the “ bag ofN - Grams” vector to calculate the inner product, the size of the inner product will be controlled by N - Gram with a higher probability of occurrence. At this time, the information contained in the lower probability N - Gram will not be reflected, which reduces the accuracy. Therefore, the role of weighting is to adjust the influence of each N - Gram to as far as possible make the distinguishing information contained in each N - Gram reflected.
Table 2 shows the performance of the third order SVM on LRE07, and the N - Gram statistic is obtained from Lattice statistics. The kernel function takes the form of formula (22). The SVM training uses the Torch SVM toolkit, and the training strategy uses 1 VS others. Meanwhile, the training set corpus contains 22,231 voices, and the effective voice length of each segment is not less than 30 s. We can see that the long-term (30 s) performance of the SVM model is better than the 3-gram language model, while the performance on the 10 s and 3 s is slightly worse. The reason is that when the training set uses 30 s of voice as a sample, the test duration is short, and there is a problem of mismatch. Due to the use of two different training strategies, there is a strong complementarity between the two models. Especially in the 30 s, the two models have a considerable improvement over a single system.
Comparison of the performance of the third order SVM and 3 - Gram language model of LRE07
The experimental system is composed of two parts: training and testing. The composition of the system is shown in Fig. 3. In the training stage, the features of the words are first extracted from the corpus, and after the feature selection, the iterative algorithm is used to learn the weights of the features. In the test phase, feature extraction is first performed, and then the probability of the sound being converted into each word in the context is calculated and the result of the phonetic conversion is obtained.

Structure diagram of phonetic conversion.
The block diagram of the text-to-voice conversion system is shown in Fig. 4. The text-to-voice conversion system generally includes three core parts: text analysis part, prosody control part and voice synthesis part. Among them, the problems that need to be solved in the text analysis stage are: the removal of unrecognizable symbols in the input text, the word segmentation, the determination of the syntactic structure, the disambiguation of polyphonic characters, the recognition of numbers, years, and abbreviations. The quality of the prosody control module has a great impact on the quality of the final synthesized voice. This module mainly enables the voice to be better controlled in terms of intonation, pause, stress, and speed of voice, thereby improving the naturalness of the synthesized voice. The voice synthesis module uses the corresponding voice synthesis methods according to the results of text analysis and prosody analysis, such as formant parameter synthesis method, waveform stitching synthesis method, unit selection voice synthesis method, etc., and finally synthesizes voice. This subject focuses on the study of prosody control modules to improve the quality of synthesized voice.

Block diagram of text-to-voice conversion system.
After the system is built, the performance of the system is identified, and the performance is identified through 40 sets of data. In this study, the deep learning model is used as a comparative model to analyze the performance of the research model. The deep learning model is named DL, and the research model is named PML. First, a comparative analysis of the text-to-voice conversion speed is performed. The comparison results are shown in Fig. 5 and Table 3.

Comparison diagram of text to language conversion speed.
Comparison table of text-to-language conversion speed
As shown in Fig. 5 and Table 3, in the comparison of text-to-voice conversion speed, this research method has a certain advantage in recognition speed compared with the deep learning model. Moreover, the time required for the text-to-voice conversion of this research model is only half of that of the deep learning model. Next, a comparison of the accuracy of text-to-voice conversion is conducted.
As can be seen from Fig. 6 and Table 4, the model proposed in this study is distributed between 85% -95% in the accuracy of text-to-voice conversion. This accuracy rate has a practical basis for application to the system. However, the recognition accuracy of the deep model is only about 60%. Therefore, the model proposed in this study is superior in the accuracy of text-to-voice conversion.

Comparison diagram of accuracy of text-to-language conversion.
Comparison table of accuracy of text-to-language conversion
The process of converting English letters into phonemes has a wide range of applications, and it is also used in teaching and intelligent text recognition. Based on this, this study analyzes the application of improved machine learning algorithms in the process of converting English letters into phonemes. This research system consists of two parts: training and testing. In the training phase, first extract the features of words from the corpus, and after the feature selection, use an iterative algorithm to learn the weights of the features. In the test phase, feature extraction is first performed, and then the probability of the sound being converted into each character in the context is calculated, and the result of the conversion of the phonetic is obtained. The text-to-voice conversion system generally includes three core parts: text analysis part, prosody control part and voice synthesis part. The voice synthesis module uses the corresponding voice synthesis methods according to the results of text analysis and prosody analysis, such as formant parameter synthesis method, waveform stitching synthesis method, unit selection voice synthesis method, etc., and finally synthesizes voice. Finally, the performance analysis of the research model proposed in this paper is carried out through comparative experiments. The research results show that this algorithm has good performance and can be applied to practice.