
Abstract
The unintentional electromagnetic (EM) emission of computer monitors may cause the leakage of image information displayed on the monitor. Detection of EM information leakage risk is significant for the information security of the monitor. The traditional detection method is to verify EM information leakage by reconstructing an image from EM emission. The detection method based on image reconstruction has limitations: adequate signal sampling rate, accurate synchronization signal, and dependence on operational experience. In this paper, we analyze the principle of image information leakage and propose an innovative detection method based on Convolutional Neural Network (CNN). This method can identify the image information in EM emission to verify the EM information leakage risk of the monitor. It overcomes the limitations of the traditional method with machine learning. This is a new attempt in the field of EM information leakage detection. Experimental results show that it is more adaptable and reliable in complex detection environment.
Keywords
Introduction
EM emission can be generated in the process of operating an electronic device according to the principle of electromagnetism. For electronic devices, the emission is unintentional and inevitable. It has been proved that EM emission can cause information leakage from the electronic device. This specific information leakage caused by unintentional EM emission is called EM information leakage. The information leaked out by the EM emission is defined as EM information. EM information leakage is imperceptible, often is ignored. However, it threatens the information security of the device. The monitor is the main output unit in human-computer interaction, and its EM emission will lead to direct information leakage. Video information can be reproduced from the EM emission signal of computer monitors including LCD [1] and CRT [2]. Comparing the two kinds of monitors, the LCD monitors with less EM emission are no more difficult to reproduce the image displayed than the CRT monitors with large EM emission intensity. This indicates that weak EM emission leakage can still threaten the information security of various monitors. With the improvement in instrument precision and the decrease of instrument cost, EM leakage signals will be captured more easily. Some researchers have used portable EM devices to steal the screen images of tablets in public space [3, 4]. These works suggest that EM information leakage can occur over longer distances and in more complex environments. The image information on the computer monitor can even leak out from the conducted emission of the power line [5]. It shows that there are various ways of EM information leakage. The EM information can be leaked not only by the direct emission but also through the conduction coupling.
Therefore, the threat of EM information security of computer monitors is increasing. To cope with the increasing risk of EM information leakage, it is necessary to study the detection method to find the EM security weak point in computer monitors. EM information leakage detection is the basis of EM information protection. It can promote the development of EM information security technology.
Since van Eck’s experiment [6], researchers have taken the way of image reconstruction to obtain leaked image information [7–11]. The image reconstruction is by far the most commonly used method to verify the EM information leakage risk of computer monitors. While it requires strict conditions, sampling accuracy, and synchronization signals, which will be described in detail in Section 2. These two conditions are not easy to be fulfilled. And the image reconstruction work is mainly achieved by manual operation, depending on the operator’s observation and experience. Therefore, it is difficult to standardize the image reconstruction based detection method.
In this paper, we propose an EM information leakage detection method for computer monitors without image reconstruction. We use CNN to extract the features of image information from the frequency spectrum to verify the leaked image. Our method can overcome the limitation of image reconstruction and indicate the EM information leakage risk of computer monitors efficiently. It is more adaptable and reliable in a complex detection environment. It provides a new way that has never been found in the literature for EM information leakage detection.
The rest of the paper is organized as follows. The principle of EM information leakage from computer monitors and the method of reconstructing leaked images are reviewed in Section 2. In Section 3, we introduce the neural network structure for the detection method. In Section 4, the experiments and results are described in detail. In Section 5, we compare the proposed method with other detection methods. Finally, we summarize the conclusion and discuss future work in Section 6.
EM information leakage from computer monitor
The computer monitor displays images by progressive scanning, as shown in Fig. 1. The image to be displayed is encoded and then inputted into the monitor in the form of a sequence. The sequence of the image coding consists of two kinds of signals: effective image signal and synchronization signal. The image signals constitute the visible image, which is displayed in the active area shown in Fig. 1. The synchronization signals, including frame synchronization and line synchronization, are used to decompose the one-dimensional (1D) coding sequence and reshape it to a two-dimensional (2D) image. The synchronization signals will not be displayed, just in the hidden area. The monitor divides the sequence into images according to the frame synchronization signals and displays an image line by line according to the line synchronization signals.
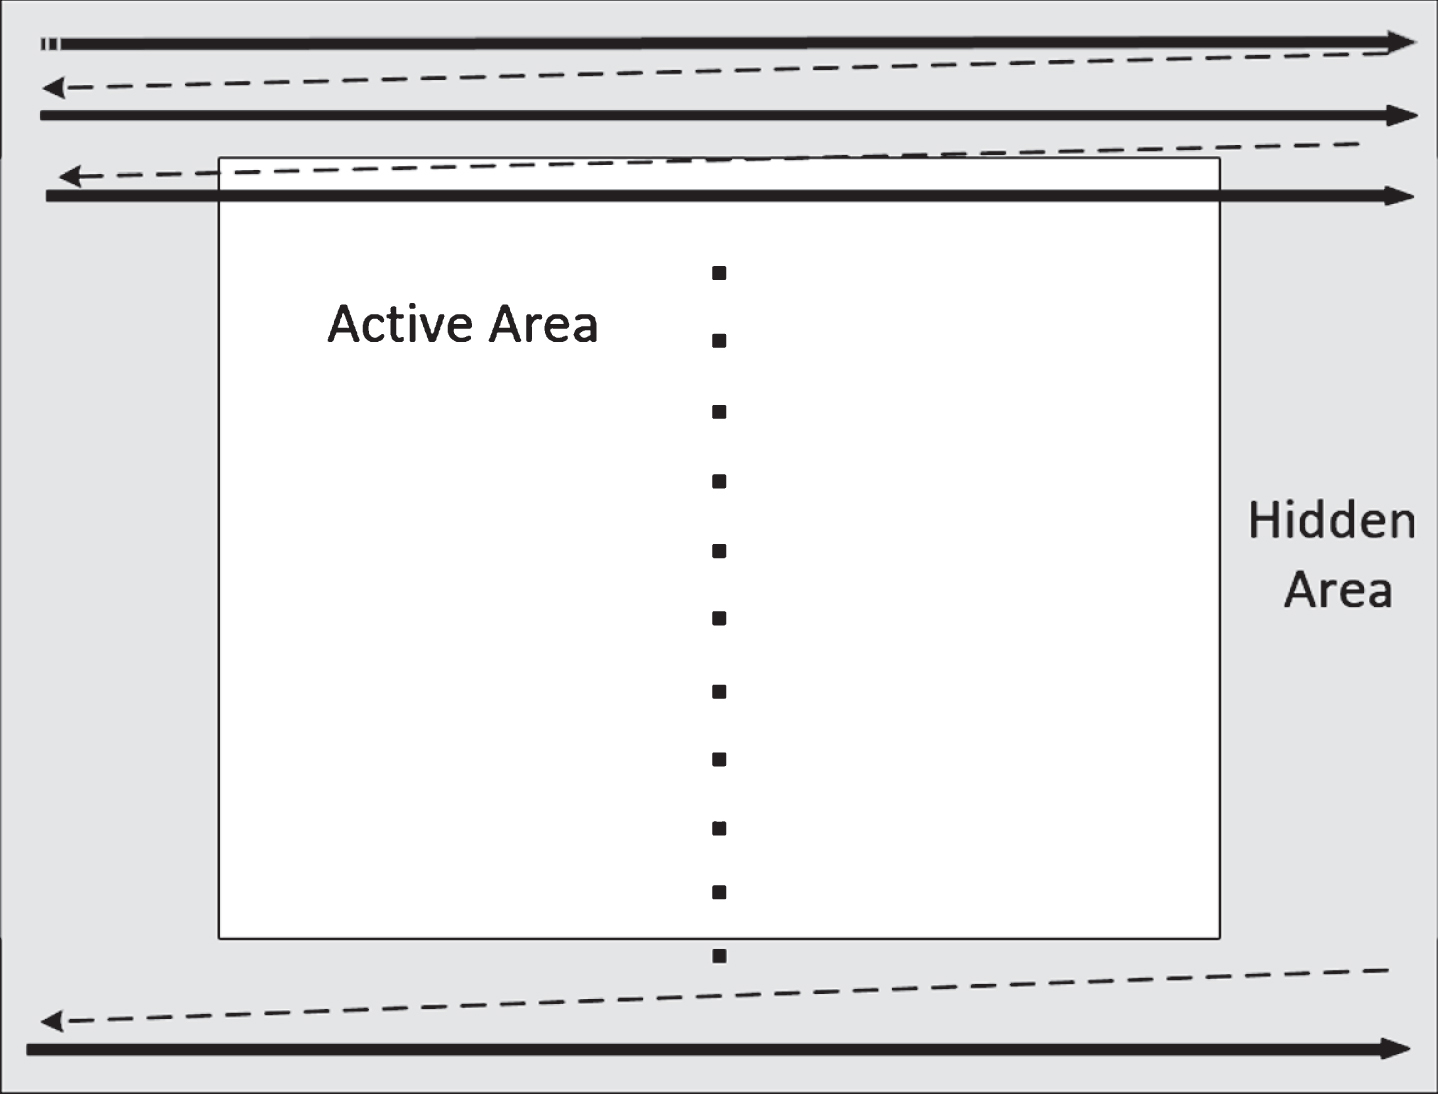
Diagram of computer monitor displays images.
The EM emission, which can be intercepted, is generated when the image coding sequence is inputted into the monitor. Corresponding to the image coding sequence, the intercepted EM emission is also represented as a signal sequence. The EM emission comes not only from effective image signals in the active area but also from the synchronization signals in the hidden area. Therefore, for the detection of image information leakage, it is necessary to extract the image information from the leaked EM signals. To distinguish the image content, in the traditional method, the image must be reconstructed line by line from the leakage signals based on the principle of the display. Figure 2 shows the principle of displaying an image on the monitor and the method of reconstructing the image from the EM leakage.

Flow diagram of image display and reconstruction.
To reconstruct the image from the captured EM emission, two key conditions are required: adequate sampling rate and accurate synchronization signal. For example, a display resolution is 1920×1080@60 Hz, which means that the active area of the monitor is 1920×1080 pixels and the refresh rate of the screen is 60 Hz. The refresh rate is frame synchronization frequency. According to VESA and Industry Standards and Guidelines for Computer Display Monitor Timing [12], the total area, including active area and hidden area, will reach 2200×1125 pixels, which is listed in Table 1. And the pixel clock frequency is 148.5 MHz accordingly. According to Nyquist Theorem [13], to restore the image on the screen from EM emission signals, the sampling rate of the EM signals is required to be more than twice the pixel clock frequency. For the above example, the sampling frequency should be more than 300 MHz. Therefore, the precision of signal detection equipment must match the display resolution. Since the collected EM signal is the 1D time series, it is necessary to get the synchronization signal to reconstruct the 2D image. For example, the theoretical value of the line synchronization frequency is 67.5 kHz according to the VESA standard. However, due to the precision error of detection equipment and the interference of environmental noise, the actual value of the synchronization frequency about the unintentional EM leakage does not strictly match the theoretical value. For this reason, it is always needed to adjust the value of the synchronization signal until the correct image is reconstructed. If not adjusted properly, the image will be distorted and in most cases completely unrecognizable [14, 15]. Manual operation is needed during the reconstruction process, and the result is easy to be influenced by individuals.
Detail parameters from the VESA monitor timing standard
Thus it can be seen that there are limitations of the detection method based on image reconstruction. The detection equipment must have enough sampling precision to ensure that the sufficient pixel information could be captured. Even if sufficient image pixel data is obtained, the image cannot be reconstructed without the guidance of an accurate synchronization signal. Moreover, the detection result is easily influenced by the experience of operators.
Therefore, we explored a method to extract image features from EM leakage signals to recognize the image. This method does not need image reconstruction and overcomes the limitations of the traditional detection method.
Deep Learning (DL) is an important part of artificial intelligence technologies [16]. CNN [17, 18] is a typical DL algorithm. Its unique convolution processing and pooling ability can extract the advanced features of data without complex pre-processing. It can obtain the hierarchical features of the target through the network. CNN has been proved to have a good performance in the field of image recognition [19–23] and signal detection [24–27]. EM information leakage of computer monitors can be regarded as unintentional EM emission carrying image information. What we want to find is the image hidden in the EM signal. Then, we take the advantages of CNN in the image and signal analysis to identify the image information in EM emission, to achieve the purpose of detecting the EM information leakage risk of the monitor.
In our algorithm, EM information leakage samples are represented in the form of a spectrum. The data used for image reconstruction are signal sequences collected in the time domain. As we know, there is a 2D image hidden in the 1D time-domain signal. It is hard to extract the 2D image features without the guidance of the synchronization signal. So we transform the collected time-domain signal into a frequency spectrum. The means of transformation is the Fast Fourier Transform (FFT) [28]:
Where X (k) is the transformed spectrum sequence in the frequency domain, x(n) is the original signal sequence in the time domain, N is the length of the sequence. This is because the spectrum can enhance the periodic and frequency features of the signal. The EM emission signal of the image contains abundant periodic and frequency features: the synchronization signal is an obvious periodic signal, and the spatial characteristics of the image can also be mapped to the frequency domain. These features and other unknown features are extracted and learned by CNN and become the basis for identifying image content. In the experiments, we segmented the original signal and performed FFT separately to form a 2D spectrum adapted to CNN.
The CNN of the method contains two convolution layers, one max-pooling layer, and one fully connected layer, as shown in Fig. 3. The input of the network is the spectrum of the EM signal sample, and the output is the classification of the EM leak information.

CNN architecture for EM information leakage detection.
The parameters of each layer on CNN are listed in Table 2. The input into each layer is a tensor, which is composed of a three-dimensional vector. The dimensions of tensors include the EM feature channel number C, the EM feature matrix size M×N. The kernel size is the size of the window for convolution or pooling operations. The stride is the step size of the sliding window for each dimension of the input tensor. The classification of the samples is output after the fully-connection layer. The number of classification can be set artificially.
Parameters of CNN architecture
The function of the convolution layer is to extract the features of EM samples. The 2D convolution operation slides the window of convolution kernel to extract the local features of the input tensor orderly:
Where l indexes the layers of the network, X (l) and X (l + 1) are the input and output feature matrix in the lth layer, respectively. Then, W (l) is the weight matrix which includes 2D convolution kernel, B (l) is the 1D bias vectors.
We use the Rectified Linear Units (ReLU) [23–29] as an activation function, as shown in (3). It helps to restrain the overfitting of deep learning. Compare with the previous sigmoid and tanh function, the ReLU activation function could alleviate the vanishing gradient problem and improve the learning speed of the neural networks.
Combining the conv2D and the ReLU, the operation can be expressed as the following formula:
Furthermore, we take the dropout [30] operation to prevent the neural network from overfitting, as shown in (5) and (6).
Where xi,j(l) is an element of the X(l) that is indexed by I,j. For the dropout, RI,j(l) is an independent Bernoulli random variable with probability p of being 1, and it has the same shape as xi,j(l). With the probability p, xi,j(l) is kept and scaled up by 1/p to output x*i,j(l) independently, otherwise it is dropped which means x*i,j(l) outputs 0. In our work, p is set as 0.5.
In the max-pooling layer, a K×H window is used for down-sampling with the stride of S×T. The max element in each K×H block is kept, as shown in (7). After the max-pooling, the size of the output is thinned to 1/ S×T.
Stochastic Gradient Descent (SGD) is applied for optimization to update the weight parameter of the network. The loss function is softmax cross-entropy. The batch size is set to 100. The learning rate is initialized to 0.001.
In our detection work, the object of detection is the computer monitor. The purpose of detection is to confirm whether there is a risk of EM information leakage.
We designed three experiments to verify the performance of the algorithm for detecting EM information leakage.
The first experiment is to identify the existence of EM leakage from the computer monitor with our method. Compared to the shutdown or standby state of the monitor, the EM leakage of the monitor in the working state will cause obvious emission changes. If these emission changes are detected, EM leakage can be determined.
However, EM leakage does not mean that there must be a leakage of information. The detection of EM leakage can only indicate that the monitor is working. Because of the variety of images displayed on the working monitor, it is not sufficient to threaten the information security of the monitor if simply knowing the monitor is working but unable to distinguish the images displayed. The emission changes that lead to the EM information leakage are much more subtle than the EM leakage. It is necessary to identify the image information from the EM leakage to determine the EM information leakage risk of the monitor.
Therefore, we design the second experiment to identify different image information hidden in the EM leakage. The experiment can be considered as a kind of injection detection. We preset eight images as standard injection displayed on the monitor. If each injected image can be identified from its EM emission, it means that the EM emission can cause the image information leakage. We also have tried to use other machine learning algorithms for classification detection. In this experiment, we compared the performance of our algorithm with other common machine learning algorithms.
Moreover, a third experiment is designed to verify the identification ability of the proposed method on complex images. The computer monitor under test is set to display a wide range of images that are more complex than the second experiment. Testing uses the images not in the training dataset to demonstrate the ability of CNN to identify more useful images from EM emission signals.
Instrumentation
The unintentional EM emission signal in the detection experiments was collected in a normal indoor environment without shielding measures. Figure 4 shows the experimental setup which consists of a signal detector and a signal receiver. The signal detector is a TEMPEST current monitoring probe. The detector can capture the EM emission from the VGA cable which connected the working monitor. The signal receiver (NI PXIe-5162) is used to sampling and save the signals radiated from the monitor.
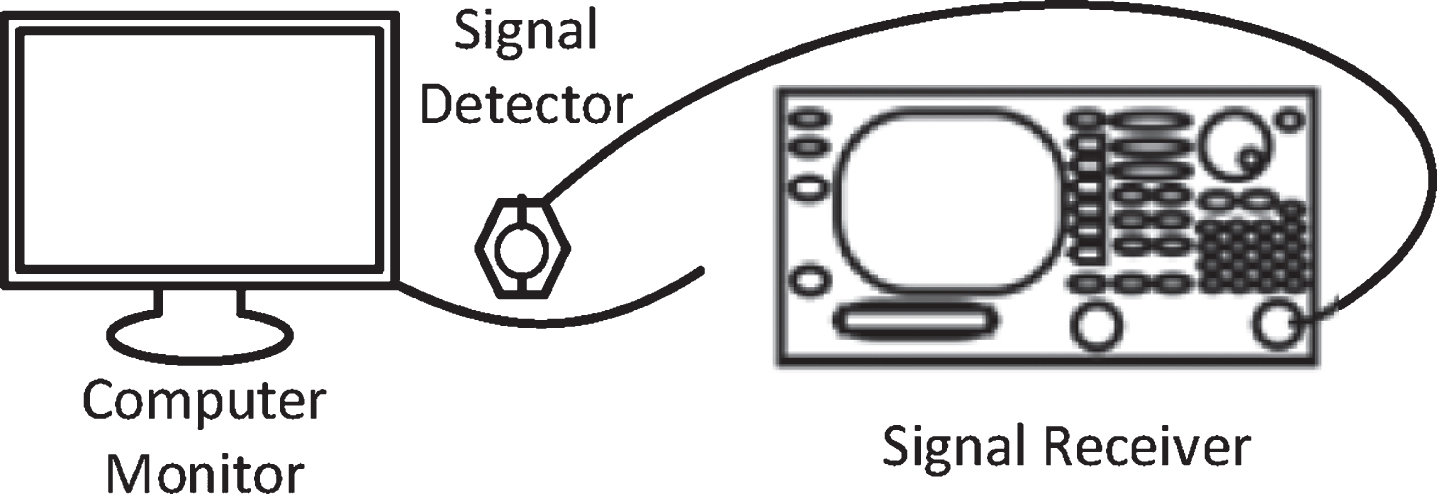
Experiment setup.
We collected more than one hundred thousand leakage signal samples from the EM emission of working computer monitors and over six thousand samples from the background noise of sleeping computers. The leakage samples are the EM signals emitted by the computer monitor when it is displaying a certain image.
For the first and second experiments, we operated the monitor to display eight different images separately and collected the corresponding EM emission signals. The images used are shown in Fig. 5. Some examples of EM leakage signals in the time domain are shown in Fig. 6, which were collected in the time domain with 1280×720 image resolution and 1.25 GS/s sampling rate. Although these signal graphs look similar, they contain different image information.
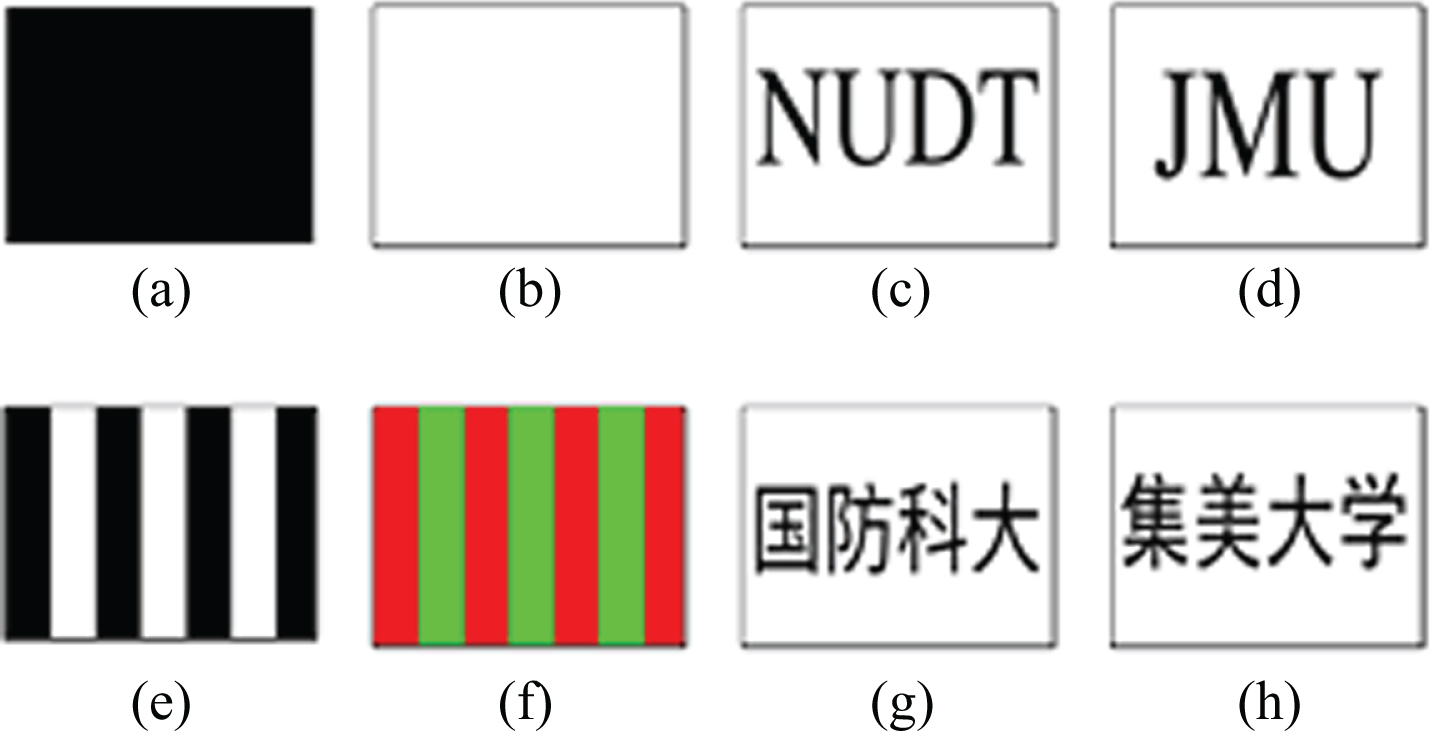
Test images. (a) Black. (b) White. (c) English characters 1. (d) English characters 2. (e) Black and white stripes. (f) Red and green stripes. (g) Chinese characters 1. (h) Chinese characters 2.

EM leakage signals in the time domain. (a) Black. (b) White. (c) English characters 1. (d) English characters 2. (e) Black and white stripes. (f) Red and green stripes. (g) Chinese characters 1. (h) Chinese characters 2.
Not all leakage signals can be used to reconstruct the original image. Only if the sampling accuracy is high enough, it is possible to reconstruct the image based on known synchronization signal frequency. Most of the signal samples in our dataset are unable to reconstruct images, but they still contain distinguishable information. Once the information in the EM signal is identified, it means information leakage.
All the signal samples were preprocessed before use. They have been transformed into the spectrum by FFT. We also tried to input the time domain sample directly into CNN for detection. As a result, the accuracy of detection decreased obviously without preprocessing. The experiment results are consistent with the analysis in Section 3. In the time domain, the 2D spatial features of the image have been broken and scattered over the 1D noisy time series. Therefore, the performance of detecting time-domain signals is poor.
To verify detection performance further, each image was displayed at different resolutions and the leak signals were collected at various sampling rates. It should be noted that the Signal-to-Noise Ratio (SNR) of EM information leakage signals is originally quite low. The normal detection environment is an EM shielding chamber, where the interference of environmental noise is minimal. We have collected samples in a complex unshielded environment, which further reduced the SNR and increased the difficulty of identification. The details of the signals from each image were recorded in Table 3. The EM information leakage samples of these images and the background noise samples constitute the experimental data set, as shown in Table 4.
Details of signals from each image
Composition of dataset
1) EM leakage
The first experiment is to detect the occurrence of EM leakage. As we know, there is unintentional EM leakage when computers and monitors are working. Therefore, the EM signal samples collected from the working monitors possibly contain the image information. On the contrary, there is no image information leakage in the EM emission signals generated by computers and monitors in the dormant state, only background noise. We collected 6,728 background noise samples without image information. The background noise samples are taken as one class, and all the 106,656 EM leakage samples from the eight images are taken as another class, as shown in Table 4. Then we tried a binary classification with our method. In this experiment, the accuracy of the classification was mostly over 99%. By comparing Figs. 6 and 7, it can be seen that the amplitude of the noise is much lower than the leakage signals. So it is reasonable for the experiment to achieve such high accuracy. This preliminary result indicates that our method can identify the existence of EM leakage.

Noise sample in the time domain.
However, identifying the EM leakage from the monitor cannot confirm the risk of information leakage. The EM leakage just means that the working monitor is emitting different EM emission from the non-working state, and these can be identified. In this experiment, the identification of EM leakage has been achieved by distinguishing the signals in Fig. 7 and Fig. 6. This only confirms that the monitor is working and does not prove that the loss of information on the monitor. Because this experiment did not identify the different content displayed on the working monitor. If the relationship between the signals in Fig. 6 and the image information in Fig. 5 can be distinguished, which means that the information displayed on the working monitor can be recognized, then the information leakage of the monitor can be proved. Since the differences among the EM signals in Fig. 6 are tiny, it is much more difficult to identify the information leakage caused by them than to identify the EM leakage.
2) EM information leakage
The second experiment is to verify the EM information leakage from the monitor by classifying the image information hidden in the EM emission. This experiment will further verify the ability of our method. Eight images were selected as test images for injection detection. The eight images come from four types: stripes, single color, English characters, and Chinese characters, as shown in Table 5. These four types are the most common types of images displayed on the monitor. In this experiment, we implemented the eight class classification with five cross-validations. The training data and testing data are from the eight images in Table 4, excluding the background noise. The details of the samples have been introduced in the previous section.
Image type
The accuracies of the five cross-validations are shown in Table 6. The results of the five experiments show little fluctuation, with an average accuracy of 96.58%. This indicates the overall performance of our algorithm.
Accuracy of the classification
We illustrate the performance of detecting each image separately by precision and recall rate, as listed in Table 7. The results came from the five cross-validations. We recorded the averages and fluctuation ranges of the accuracy and recall rate for each image. The experiment results show that our algorithm can identify different image contents from the EM leakage signals well. The successful classification of EM leakage signals of eight images can verify the EM information leakage risk of the monitor.
Precision and recall of the classification
The details of detecting each image are recorded in the confusion matrix in Table 8.
Confusion matrix
We also tried to adjust the batch size to get an improvement in performance. The previous experiment took a batch size of 100. We conducted comparative experiments by gradually reducing and increasing the batch size. For our experiments, as illustrated in Fig. 8, a batch size of about 300 is optimal for performance; the accuracy can be increased by 0.89 percentage points relative to the batch size of 100.

Effect of different batch size on the accuracy.
We also tried other machine learning algorithms and conducted comparative experiments. We have tried to use Multilayer Perceptron (MLP) and Naive Bayes (NB) to detect EM leakage information. We compared the detection effect of MLP, NB, and CNN algorithm introduced in this paper. The experiment was designed to distinguish EM emission signals leaked from two different displaying images. The two images for the experiment are Fig. 5 (d) and (e). The three algorithms shared the same data set: the training set consists of 7,975 samples from image (d) and 8,023 samples from image (e); the test set consists of 5,357 samples from image (d) and 5,309 samples from image (e). The results of the experiment were plotted as relative operating characteristic (ROC) curves, as shown in Fig. 9. It can be seen that, for the current experimental data set, the proposed CNN-based EM information detection method is superior to the other two algorithms. Moreover, we compared with AlexNet and GoogleNet on the same data set. The accuracy of our method is 99.62%, which is close to GoogleNet’s 99.56%, better than AlexNet’s 98.47%.
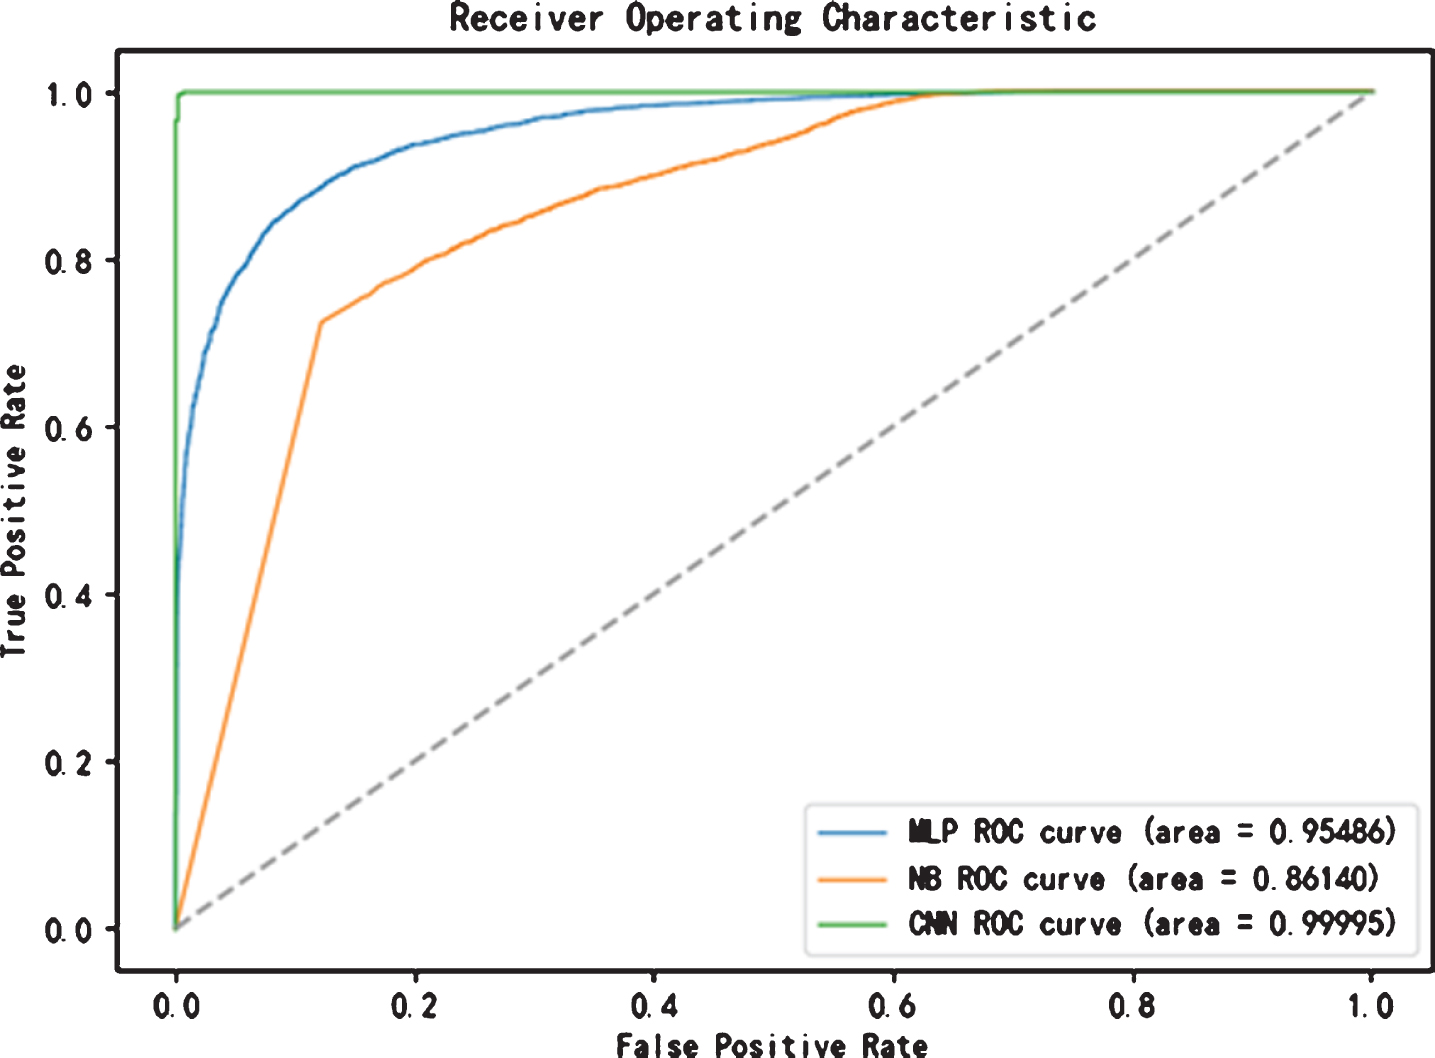
ROC of MLP, NB, and CNN to detect EM leakage information.
3) Identify complex images
The third experiment is to identify complex images that have not been trained. We selected two categories of complex real images from the CIFAR-10 dataset: airplane and cat. Ten test images are selected from each category, as shown in Figs. 10 and 11. Each image was magnified to the full screen and displayed on the monitor at a resolution of 640*480@60 Hz, and 1,271 EM leakage samples were collected for each image with a sampling rate of 208 MS/s.

Airplane images.

Cat images.
We have conducted ten cross-verifications, each time selecting the samples of one airplane image and one cat image as the testing set and the rest as the training set. It ensures that the testing images have not been trained. The experimental results in Table 9 show that our method has good performance in most cases. Because the testing images are more complex and unknown, the recognition performance is weaker than the previous experiment. We think that the performance will continue to improve by enhancing the training image set.
Performance of the identifying complex images
In general, the experiment has proved that our method can detect complex image information leakage from the unintentional EM emission of the monitor.
Compare with image reconstruction
The proposed method overcomes the limitation of image reconstruction: synchronization signal, sampling rate, and manual operation. It can adapt to the complex detection environment and be operable in practice.
We detected the information leakage of images with different resolutions. The samples of the images in the second experiment are from two resolutions: 1280×720 and 1920×1080. It indicates that detecting image information leakage by our method is not limited by the resolution. Compared with image reconstruction, it is not necessary to get the synchronization signal in advance. Also, the detection process is completed by the machine, which reduces the uncertain influence caused by manual operation.
The signal samples for the experiments were collected with different sampling rates. Some of the samples are with low sampling rates, such as 1 MS/s and 2 MS/s in Table 3. It is impossible to reproduce the image from the signals collected with such low sampling rates according to the analysis in Section 2. However, the image contents can still be recognized by our method. The reason is that there is information redundancy in the image. Even if the sampling rate or resolution is reduced, many features of the image content are still retained. It is not necessary to obtain all the pixels completely, and the image content features can be extracted from the down-sampling signals by our method. That can reduce the cost of detecting instruments.
Using the traditional image reconstruction method, reconstructed images are usually distorted. The distortion is inevitable and unpredictable in practice, which is caused by the error of manual operation and detection environment. The distortion of the reconstructed image shall be ignored when distinguishing the leaked image information. Therefore, after image reconstruction, additional image processing is often required to improve image quality. However, our method does not need to deal with that at all.
In detection practice, the image reconstruction method is affected by environmental noise, limited by detecting instruments, and influenced by the experience of operators. The detection process of image reconstruction is difficult to be standardized. By contrast, our method is more operable, is more suitable for standardized detection, and can adapt to a more complex detection environment.
Compare with other detection methods
Researchers have also proposed some detection methods that can determine whether there is information leakage or not without reconstructing the image.
D. Sun proposed a method to detect the text information leakage from the monitor based on the ‘text-space-text’ characteristic [31]. The method can distinguish whether there is text information leakage or not. However, the method is only valid for multi-line texts, not for single-line texts and non-text images.
In our previous work, we also have proposed a detection method by looking for the synchronization signal of computer monitors [32]. However, this method can only detect the resolution state of the working monitor and cannot completely confirm the leakage of image information.
The above two detection methods are both to verify information leakage by looking for specific characteristics of EM signals. They are to prove the leakage of image information rather than to obtain the information of the image. They avoid reconstructing images, but both have shortcomings in the detection range.
The method proposed in this paper can distinguish multiple types of the image without reconstructing the image. The detection range is superior to other methods. The experiment results show that the performance of detecting deferent types of images is well. It illustrates that our method can adapt to detect complex image content hidden in EM emission. To verify the risk of EM information leakage.
Conclusion
The unintentional EM emission generated by computer monitors can cause image information leakage. We proposed a CNN based method for detecting the risk of EM information leakage. Considering the characteristics of image information and the principle of monitor emission, we transformed the EM signals carrying image information into the frequency spectrum for the preprocessing. We used CNN to extract image features from the leaked EM spectrum. Compared with the traditional means, our method can detect image information leakage with different resolutions and various sampling rates simultaneously. It is executed by the machine, avoiding the inconvenience and uncertainty of manual image reconstruction. The experiment results show that the method is effective for detecting multiple types of images. Our work provides a new way for EM information leakage detection. Judging from the relevant literature and reports, no one has attempted to do so.
In future studies, we plan to carry out experiments in a more complex EM environment with different receiving devices to improve the adaptability of the method. Moreover, we will attempt to establish a standardized detection procedure based on this method.
Footnotes
Acknowledgments
This work was supported by the National Natural Science Foundation of China under Grant 61672335 and Guangdong province digital signal and image processing technology key laboratory.