
Abstract
The manual evaluation method to evaluate the effect of physical education teaching is tedious, and it will have a large error when the amount of data is large. In order to improve the efficiency of physical education evaluation, this article uses artificial intelligence for data analysis and uses machine vision to identify the teaching process to assist teachers in physical education. In order to reduce the calibration error of the parameters and obtain more accurate camera imaging geometric parameters, this paper adopts the method of averaging multiple sample points to determine the calibration parameters of the camera. In addition, this study builds system function modules according to actual needs and verifies system performance through experimental teaching methods. The research results show that the model proposed in this paper has a certain practical effect.
Introduction
There are many factors influencing the process of physical education. If artificial intelligence and machine vision can be used to assist the development of physical education activities, the effect of physical education can be effectively improved, and a complete teaching evaluation system can be provided for the physical education process [1].
Sports is an important means to promote the healthy growth of students and develop good fitness habits. In the current actual physical education classroom teaching, teachers ignore the students’ real state of the classroom and teachers only go to class according to the curriculum standards. Moreover, the content of the course standard is aimed at all students, and it ignores the students’ actual conditions and individual differences. Therefore, individual students cannot understand and master the knowledge points in the first place. In addition, the technical skills of sports movements are highly technical and detailed, and the technical demonstrations of teachers are too general and not detailed enough. Furthermore, each student’s physical quality is uneven, and their personal comprehension abilities are also different, and their abilities to accept in the teaching process are also different [2]. The content of physical education is inextricably linked, so some students should be further developed on the basis of learning. There is a certain lag in the traditional teaching design, which makes the students’ interest in learning low, and the training process is based on the subject, and the student’s subjectivity is not fully exerted. Therefore, it is difficult to present the best teaching effect, and there will always be some students who cannot meet the teaching goal and fail to achieve the teaching goal. At the same time, it also caused some students to be unable to raise interest in learning during the learning process and created rebellious learning emotions and disliked normalized physical education, which caused the students’ bodies to not be effectively exercised. Teaching activities are composed of different factors, including elements such as teaching content, goals, strategies, processes, and evaluation. According to a certain relationship, these factors are combined to form a teaching design. Teaching design should not only focus on students’ learning, but also on teachers’ teaching methods [3].
Related work
The media should follow basic education theories in education and teaching. Educational practice activities are very rich, and educational theory is summed up from educational practice. The educational theory summarized from the practical process is extremely vigorous, which can in turn guide the teaching practice. Video has always been superior to other teaching media, and it is an indispensable important role in the process of educational informatization. At present, the Ministry of Education, schools at all levels, teachers and various education industry companies are committed to the realization of education informatization, and the development of video in education informatization also needs a living theory to guide [4]. Literature [5] studies the tower of experience theory, educational communication theory, educational media theory, and constructivist learning theory and humanistic learning theory that are closely related to the teaching model.
Teaching media is a bridge connecting teachers and learners in the teaching system and a tool for educational information dissemination [6]. Educational media has the dual function of teaching materials and teaching media at the same time. It is not only the carrier of teaching content, but also the task of closely integrating teachers and students [7]. The teaching effect of teachers combining various media in daily teaching is better than the teaching effect of using a single media. The combination of various media in the combined media makes its superiority fully exerted [8].
The teaching process led by the teacher is the process of transmitting information from the source, and the process of receiving information from the sink is the process of autonomous learning of students [9]. The basic principles of education are the cornerstones necessary for the smooth execution of education and teaching. Following the basic principles will not suppress the creativity of excellent teachers, and following the basic principles will not conflict with innovative thinking [10].
The literature [11] pointed out that video teaching is a teaching method in multimedia combination teaching, the most commonly used method of multimedia teaching, and an important part of multimedia teaching. The use of video teaching can solve the incomplete demonstration of technical movements in traditional physical education, and the unclear expression of difficult movements and joints. This is a visual image teaching method that breaks through time, space, age, gender and macro.
Repeating literature [12] pointed out that video teaching is a kind of teaching method in multimedia combined teaching, which is the transition from traditional teaching methods to wisdom teaching methods. The literature [13] pointed out that for many years, when students took technical classes, they all learned the technical actions through the explanation and demonstration of the teacher alone. This model has been inherited for many years. When a teacher makes a demonstration action, the teacher must show the most correct action, which puts forward higher requirements on the teacher’s technical level and demonstration ability. The literature [14] pointed out that sports is the most stressful proprioception, and the use of multimedia technology can enable students to intuitively understand and form the correct technical concept. The literature [15] stated that the development of the information age has a profound impact on human learning. In modern information technology, multimedia can help physical education teachers establish a structured, dynamic, and visual representation of physical education content. The literature [16] used multimedia teaching methods to divide test students into experimental groups and control groups and used a variety of three-dimensional combination forms such as video recording, courseware, videography and teacher demonstrations to allow students to learn technology during the interactive process of watching and practicing. In addition, the multimedia combination teaching method is used in tennis basic technology teaching to make the teaching more intuitive, scientific and efficient, which is conducive to mobilizing the enthusiasm of students and helping students form correct sports action concepts. Various applications related to data mining techniques were analyzed [17]. C-means clustering algorithm techniques were utilised for cluster selection for segmentation using images. [18]. An investigation analytics for resource division and its impact energy and evaluation of processors [19]. IoT based hybrid artificial model deployed for prediction of diseases and analysis of symptoms in healthcare sector.
Visual measurement and positioning algorithm of checker silkworm cocoon
The position and calibration accuracy of the camera relative to the world coordinate system directly affect the positioning accuracy of machine vision. The vision system involves three coordinate systems: the world coordinate system (X w , Y w , Z w ), the camera coordinate system (X c , Y c , Z c ), and the image coordinate system (u, v). When acquiring an image, a coordinate system is established at the center of the optical axis of the camera. The Z c -axis direction is parallel to the optical axis, and the direction from the lens to the scene is taken as the positive direction, and the X c -direction takes the direction in which the image coordinates increase horizontally. The origin O w of the scene coordinates selects the intersection point of the center line of the optical axis and the scene plane, the Z w -axis direction is the same as the Z c -axis direction, and the X w -axis direction is the same as the X c -axis direction. The acquisition principle is shown in Fig. 1 [20].

Monocular two-dimensional visual measurement coordinate system.
The imaging model where all scenes are projected onto the imaging plane through the center point of the optical axis of the camera is called the pinhole model (Xu De, 2016). Under this model, if the coordinate of the scene point in the camera coordinate system is (x
c
, y
c
, z
c
) and the coordinate of the imaging point in the imaging plane is (x2, y2, z2), then the relationship between the two coordinates is shown in formula (1) [21].
In the formula:
f–the focal length of the camera, and f = z2.
The camera’s internal parameter model describes the relationship between scene points and image points. The image on the imaging plane is enlarged to obtain a digital image, and the imaging point (x2, y2) on the imaging plane is converted into an image point (u, v). The image coordinate of the center point of the optical axis at the intersection of the imaging plane is marked as (u0, v0), as shown in the following formula [19].
In the formula:
α x –the magnification factor from the imaging plane to the image plane in the X axis direction;
α y –the magnification factor from the imaging plane to the image plane in the Y axis direction.
Formula (1) is substituted into formula (2) and rewritten into matrix form to obtain formula (3):
In the formula:
k x = α x f–the magnification factor in the X axis direction;
k y = α y f–the magnification factor in the Y axis direction;
M in –the internal parameter matrix.
The formula (3) contains 4 model parameters, so the formula (3) model is called the four-parameter model of the camera.
The external parameter model of the camera is the description of the scene coordinate system in the camera coordinates. As shown in Fig. 2, the representation of coordinate system O w X w Y w Z w in coordinate system O c X c Y c Z c constitutes the external parameter matrix of the camera, as shown in equation (4) [22].
System function module diagram.
Among them:
In the formula:
n–The direction vector of the X w axis in the camera coordinate system O c X c Y c Z c ;
o–The direction vector of the Y w axis in the camera coordinate system O c X c Y c Z c ;
a–The direction vector of the Z w axis in the camera coordinate system O c X c Y c Z c ;
The conversion relationship between world coordinates and image coordinates is shown in equation (6) [23].
For the monocular two-dimensional vision measurement system shown in Fig. 1,
The internal parameter adopts a four-parameter camera model. For two points and on the working plane, from formula (4) and formula (7), formula (8) [24–27] can be obtained.
In the formula:
k x –the magnification factor in the X axis direction.
k y –the magnification factor in the Y axis direction.
The calculation formula of k
xd
and k
yd
is shown in the following formula.
Among them,
In the formula:
k xd –the calibrated camera parameter;
k yd –the calibrated camera parameter;
(u1, v1)–the image coordinates of point p1;
(u2, v2)–the image coordinates of point p2;
Therefore, only need to determine the distance between the two points in the world coordinates and the corresponding distance in the image coordinates, the camera imaging geometric parameters can be calculated by formula (9).
The camera used in this article is basically distortion-free in the camera plane, so this article directly uses the above method to calibrate the camera. In order to reduce the calibration error of the parameters and obtain more accurate geometric parameters of the camera imaging, a method of averaging multiple sample points can be used to determine the calibration parameters of the camera. The method is as follows: the sample points of the i group are collected, each group of points contains 2 coordinate points pi1 and pi2, the world coordinates are pi1 (xi1, yi1, 0) and pi2 (xi2, yi2, 0), and the corresponding image coordinates are (ui1, vi1) and (ui2, vi2). Then, k
xd
of i number and k
yd
of i number can be obtained from formula (9), then the i-th k
xd
is denoted as k
xdi
, and the i-th k
yd
is denoted as k
ydi
. Then the average value of k
xd
and k
yd
is shown in the following formula:
If the image coordinate of the k-th silkworm cocoon center point is C
ck
(u
k
, v
k
) and the image coordinate corresponding to the world coordinate origin is O
c
(u0, v0), then the world coordinate C
wk
(x
wk
, y
wk
) of the k-th silkworm cocoon is as follows.
The Euclidean distance between the actual coordinates of the feature points and the calibration coordinates is used as the calibration deviation D. The calibration deviation D is shown in the following formula.
In the formula,
(X i , Y i )–the actual coordinate value;
(x i , y i )–the calibration coordinate value.
The image coordinate system uses the first pixel in the upper left corner of the image as the origin, and the world coordinate system uses the center point of the first silkworm cocoon in the upper left corner of the image as the origin. On the square grid, 10 central points of silkworm cocoons are used as known points, and the spatial coordinates (X i , Y i ), (i = 1, 2, ⋯ , 10) of 10 known central points of silkworm cocoons are respectively measured using vernier calipers. After determining the coordinate (u i , v i ), (i = 1, 2, ⋯ , 10) of the 10 silkworm cocoon center points on the image, the calibration coordinates (x i , y i ), (i = 1, 2, ⋯ , 10) of 10 known points are calculated by formula (11) respectively, and the calibration deviations of the calibration coordinates of the 10 silkworm cocoon center points and the world coordinates are calculated by formula (12) respectively.
The hyper parameter adjustment of the CNN model can be understood as an optimization problem of an unknown function f (x) in the known parameter space X. Among the methods for solving optimization problems, Bayesian Optimization (Bayesian Optimization) is a very effective optimization algorithm. Aiming at the hyper parameter optimization problem of CNN model, this paper studies the Bayesian optimization algorithm based on Gaussian process and improves it.
We assume that the multi-dimensional space of the hyper parameters of the CNN model M is X, the dimensions in X correspond to the number of hyper parameters, and the domain value space of the hyper parameter x1, ⋯ , x
n
is X1, ⋯ , X
n
, that is X ∈ X1 × ⋯ × X
n
. A set of hyper parameters x and a set of training data set D are given. The goal of hyper parameter optimization is to find the optimal set of hyper parameters x* in the parameter value space X, so that the objective function f of the model M on the data set D obtains the optimal value. The mathematical expression is shown in formula (13).
Bayesian optimization derives from Bayes’ theorem, as shown in the following formula. When the relevant data E is known, the posterior probability P (M|E) of a model M is proportional to the probability P of the observed data E under the known model M multiplied by the prior probability P (M) of the model M (Nicholls, 1971).
The basic principle of Bayesian optimization is to combine the prior distribution of the function f (x) and the sample information to obtain the posterior distribution of the function, and then use the posterior information to infer where the function f (x) obtains the maximum value. The selection of the next set of hyper parameter combinations x needs to be selected according to a certain criterion. The standard is usually represented by a utility function u, also known as acquisition function. The function u is used to select the next sampling position to maximize the expected utility.
The statistical characteristics of the Gaussian process are completely determined by its mean function m : x → R and covariance function k : x × x → R (Zhang Hao, 2018). If a function f (x) follows the Gaussian process distribution, it is expressed as follows.
The Gaussian process differs from the ordinary Gaussian distribution in that the probability density function f (x) corresponding to any x is no longer a scalar but a normal distribution function. This function reflects the probability distribution of the value of f (x). For the convenience of calculation, it is generally assumed that the mean function of the Gaussian process is m (x) = 0, and the covariance function takes the exponential square function as shown in the following formula.
In the formula, σ l is the length scale factor, σ f is the signal standard deviation, and θ is the kernel parameter vector.
When the values of x i and x j are close, the function value is close to 1, otherwise, the function value is close to 0. The function reflects that when the two sampling points are close to each other, the mutual influence is greater, and the correlation is stronger. However, when the distance is far, the correlation between them becomes weaker.
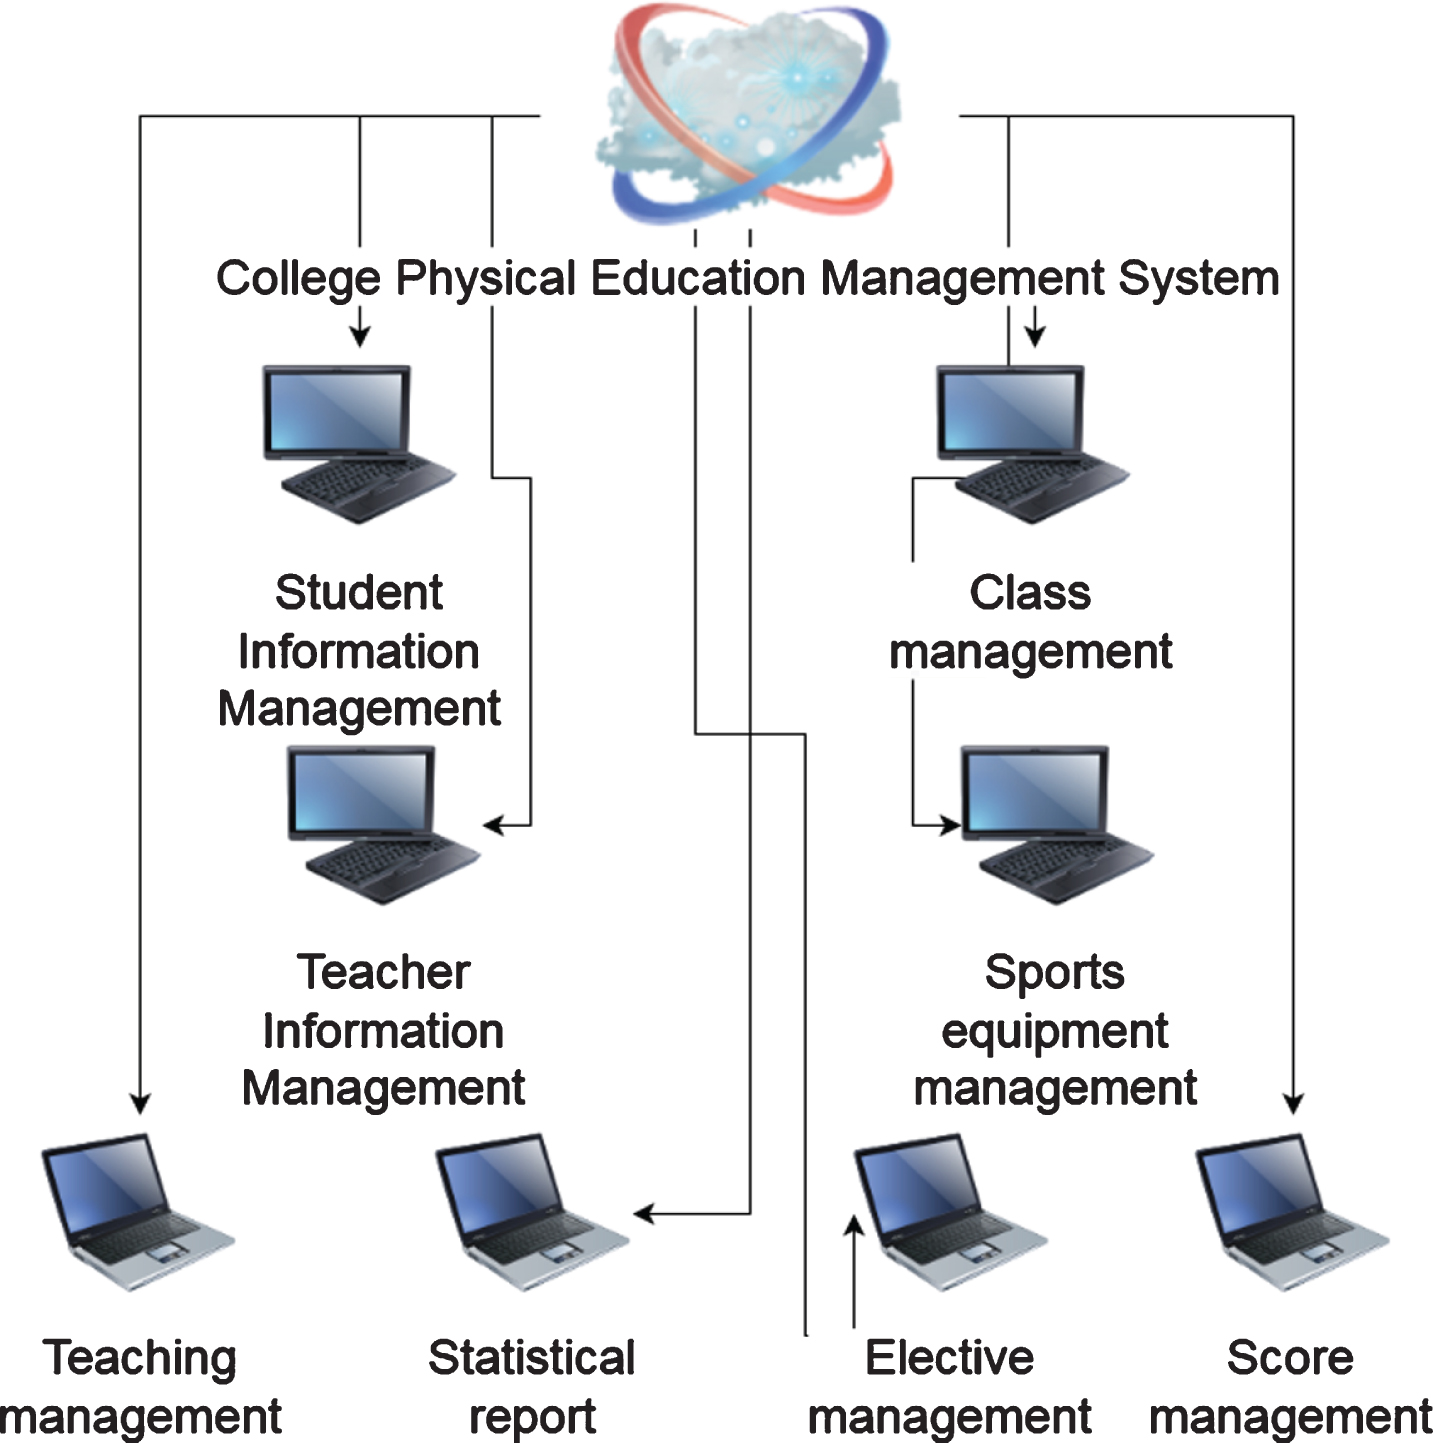
In general, the university’s physical education management system is mainly divided into ten modules, including student management, teacher management, class management, teaching evaluation management, course selection management, sports equipment management, course management, performance management, report management and system management. The functional block diagram of the university sports education management system is shown in Fig. 2.
In terms of network security, in order to ensure that the information in the company’s database is not obtained by others by illegal means, the researchers put the database on the intranet and set up a DMZ zone. At the same time, researchers use double-layer heterogeneous firewalls and intrusion detection mechanisms to prevent security risks. At the same time, the researchers set up a firewall and intrusion detection system outside the switch to prevent network users from giving third parties a chance of illegal attacks due to improper operation. The details of the network topology design of the educational management system are shown in Fig. 3.

Design diagram of the network topology.
In the student basic information management function, only administrators can modify the basic items of student information and other operations, and also have data import and export functions. The specific function diagram is shown in Fig. 4.

Student information management module.
The external administrator can manage the sports equipment. It mainly includes adding, querying, modifying and deleting sports equipment. The administrator clicks “add sports equipment” to add the corresponding sports equipment information, and automatically finds the data for proofreading. The specific content is shown in Fig. 5.

Sports equipment management module diagram.
The strategy of combining the scanning and accessing data in the active circulation mode under normal conditions and the active sending data under abnormal conditions can not only ensure the smooth operation of the system without data jamming, but also detect abnormal points in a timely and effective manner, which improves the efficiency of the system operation. The principle block diagram is shown in Fig. 6:

Network transmission block diagram.
The project management module mainly includes the functions of viewing project, adding project, modifying project, deleting project, importing project and exporting project. The project management flow chart is shown in Fig. 7.

Project management flow chart.
After constructing the above physical education effect evaluation model, this study analyzes and evaluates the model evaluation effect, and mainly compares the results of the model constructed in this paper and manual scoring. The manual scoring results are more accurate. If the model constructed in this paper is consistent with the results of manual scoring, it indicates that the model constructed in this paper performs well. This study evaluates the physical education of students in a certain class. The results are shown in Table 1 and Fig. 8.
Statistical table of physical education evaluation

Statistical diagram of physical education evaluation.
It can be seen from the above chart that the system constructed in this paper is consistent with the result of manual evaluation in teaching evaluation results, so it can be considered that the physical education evaluation system constructed in this paper has practical effects. After that, the system performance is studied on the basis of the above analysis. The system performance is mainly achieved from the reaction speed of the system operation. It is verified through 100 sets of data. If there is a problem with the data processing speed as the number of sets increases, it indicates that the model has problems. With the increase of groups, the change of reaction speed of system constructed in this paper is shown in Fig. 2.
As shown in Fig. 9, the red line indicates the trend line of the speed of data processing by the system, and there is no obvious fluctuation in the trend line. It can be seen from this that the system has good performance in data processing and the response speed is below 70 ms, so the system can meet the actual needs.

Statistical diagram of reaction speed when the system processes data.
Statistical table of reaction speed when the system processes data
Artificial intelligence and machine vision assist the development of physical education activities, which can effectively improve the effect of physical education and provide a complete teaching evaluation system for the physical education process. The camera used in this article is basically distortion-free in the camera plane, so this article directly uses the above method to calibrate the camera. Without the above method. In order to reduce the calibration error of the parameters and obtain more accurate geometric parameters of the camera imaging, a method of averaging multiple sample points can be used to determine the calibration parameters of the camera. The school sports education management system is generally divided into ten modules, including student management, teacher management, class management, teaching evaluation management, course selection management, sports equipment management, course management, performance management, report management and system management. After constructing the evaluation model of physical education effect, this study analyzes and evaluates the evaluation effect of the model, and mainly compares the results of the model constructed in this paper and the manual scoring. The research results show that the model constructed in this paper is consistent with the manual scoring results, indicating that the model constructed in this paper has good performance, and the model has a fast response speed and stable system. It can be seen from this that the system model constructed in this paper has a certain effect.