
Abstract
With the development of information technology and the reduction of storage equipment costs, a large number of databases have been able to create and store massive amounts of data. How to use this data to provide guidance and advice for business decisions is a difficult problem that decision analysis systems need to solve. This paper designs a new multi-dimensional heterogeneous network information model, defines the binary relational meta-path in the heterogeneous network and the n-ary relational meta-path, and studies the relationship of these meta-paths as a new way to guide network aggregation. An intelligent emergency decision support system based on the GIS platform and the concept of the plan library was established. The system adopts the method of artificial intelligence and GIS technology to complete the management, analysis and processing of map space data, and realizes the rapid and automatic generation of emergency decision-making. Finally, through experiments on large-scale real and simulated data, it is verified that the system can effectively and efficiently analyze large-scale multi-dimensional heterogeneous networks.
Keywords
Introduction
With the development of computer technology, enterprises have accumulated a large amount of data based on their own business. Faced with these massive data, how to effectively extract information has become a difficult problem in decision management. In recent years, the rapid development of the Internet has driven the arrival of the era of big data [1]. The massive data scale has also brought enormous challenges to the storage, management and analysis of data. Traditional databases and online transaction processing technologies are no longer sufficient for existing analytical needs [2]. The space intelligent decision support system is used to solve the emergency protection problem of emergencies, and the decision-making basis for space-related decision-making is generated for the auxiliary decision-making, and combined with the relevant emergency handling plan and the previous procedures and experience, the computer automatically generates an emergency decision-making plan [3, 4]. It can help decision-makers make full use of all kinds of useful information, organize and dispatch all aspects of forces in a timely and efficient manner, and maximize the safety of people’s lives and property.
The information model as the representation of data is the basis for multidimensional analysis by OLAP [5]. The traditional OLAP information models mainly include star model, snowflake model and fact constellation model, but these information models are designed for table data, and can not effectively analyze multi-dimensional network data [6]. Multidimensional heterogeneous networks contain multiple types of entities. Each type of entity has multiple dimensional attributes and different types of entities form multiple associations. Existing Graph OLAP information models are not sufficient to support large-scale multidimensional heterogeneous network decisions [7, 8]. The traditional graph-based partitioning algorithms include the Kernighan-Lin algorithm and the spectral grading method based on the Laplace graph eigenvalues [9]. Through the characteristics of the integrated clustering algorithm and the spectral grading method, the related scholars proposed a clustering algorithm combining spectral grading [10, 11]. The GN algorithm is based on the splitting idea of the edge-intermediate, which makes the community structure clear by finding the edges between the communities and removing them [12]. In order to improve the shortcomings of the GN algorithm, the researchers have improved it and proposed a layer-based hierarchical splitting algorithm [13]. It is not based on the edge median to determine the edge to be removed, but use the EC coefficient as a new reference. In addition, there is an algorithm that uses the information center degree as an index, and an edge-based dissimilarity index algorithm, which are all edge-based community discovery algorithms [14]. In addition, there is an algorithm based on the idea of extreme value optimization, which is a search method for calculating the optimal value of modularity [15]. In recent years, overlapping technology has gained wide attention with its research purposes closer to practical applications [16]. Researchers have suggested that finding overlapping communities is like finding k groups in a social network [17]. Because the group is a very tightly connected part of the network, it can be seen as an extreme form of community. Beginning with Gergely Palla, many researchers have proposed new cluster-based community discovery algorithms, such as a hierarchical overlapping community discovery algorithm based on merging similar maximal groups [18]. At the same time, there is a method based on GN algorithm that can discover overlapping communities [19]. By splitting a node with a high degree of mediation into multiple copies under certain conditions, they used the traditional algorithm for overlapping discovery. Although the technology of complex networks has been extensively studied, there are still some unsolved basic problems [20]. For example, the performance of many algorithms is superior, but the amount of computation is still huge.
In this paper, a new large-scale multidimensional heterogeneous information network model is proposed for the traditional multidimensional network model. Due to the diversity of the types of nodes, the network model is more complex and has more potential features than the traditional multi-dimensional network model. Secondly, the relationship between geographic information system, intelligent decision support system and spatial decision support system is introduced in detail. Through the analysis of the advantages and disadvantages of the decision support system of GIS and decision support system, the spatial intelligent decision support system is proposed for decision support. Through the research on intelligent decision-making reasoning technology, the reasoning method used in this system is discussed. The specific implementation method of the main technology of the space launch emergency support system is put forward. The architecture and hardware software platform of the system are introduced. A specific integration scheme for each component of the system is proposed. A solution to the problems involved in data acquisition is proposed. The algorithms and implementation methods of the main technologies in the emergency decision-making process are expounded. The spatial intelligent decision system was tested by DBLP dataset and simulation dataset. The experiment consisted of a validity analysis experiment and an efficiency analysis experiment. The effectiveness analysis experiment verifies the validity of the model for multidimensional heterogeneous network analysis by multidimensional analysis of DBLP data sets. The efficiency analysis experiment verifies the effectiveness and efficiency of the system for large-scale multidimensional heterogeneous network data processing analysis through the performance experiment of solid hypercube, the efficiency experiment of dimensional cube and the performance experiment of attribute conversion operation.
The rest of this article is organized as follows. Section 2 discusses the large-scale multidimensional heterogeneous information network model and spatial intelligent decision system, followed by the design and main technology implementation of the space emergency intelligent decision system in Section 3. Section 4 carries out simulation experiments and shows the results of the simulation experiments. Section 5 summarizes the main contents of the full paper and future research directions.
Large-scale multidimensional heterogeneous information network model and spatial intelligent decision system
Data warehouse
The architecture of the data warehouse is shown in Fig. 1.

Three-tier data warehouse structure.
The bottom layer is the data warehouse server, which usually uses a relational operation database. This part forms a unified format and has a consistent naming identifier by extracting data, cleaning data, transforming data, and loading data from multiple heterogeneous data sources. Data is physically separated into different operational databases and does not support modification of loaded data, so the data warehouse does not require transaction processing, recovery rollback and high concurrency control. In this layer, there is also a metabase, and the metadata defines the data warehouse object. In general, it contains operational metadata, data about system performance, algorithms for summarization, descriptions of data warehouse structures, mappings from operating environments to data warehouses, and business metadata.
The top layer is the front-end tool layer, which provides users with relevant functions for query reporting, decision analysis, and data mining (association, clustering, classification, forecasting, etc.).
For similar traditional information models, Graph OLAP needs to establish a Graph Cube model to correlate between multidimensional networks and data warehouses. In many realistic networks, such as research cooperation networks and social networks, nodes often have more than one entity. By abstracting the real network into a multi-dimensional heterogeneous network, it is possible to obtain more information than the traditional information network.
Multi-dimensional heterogeneous networks can abstract and describe heterogeneous networks of complex multi-dimensional attributes, and do not limit the size of the model network and the number of node types, so that large-scale multi-dimensional heterogeneous networks can be described. Next, based on this model, Graph OLAP modeling and analysis of large-scale multi-dimensional heterogeneous networks will be carried out to verify that the model supports large-scale networks.
In multi-dimensional heterogeneous networks, due to the variety of nodes, it is more complex than traditional multi-dimensional networks, which means that there are more features that can be explored and analyzed. If traditional multi-dimensional network analysis methods are used, it is not enough to comprehensively analyze and mine multi-dimensional heterogeneous networks. The multidimensional network is shown in Fig. 2.

Multidimensional network.
The intelligent decision support system has a huge knowledge system, which can complete the representation and reasoning of knowledge to serve decision-making.
The language system is the sum of all the language capabilities of the decision maker, including the language in which the data is retrieved by the user or model and the language in which the user operates the computer. The decision-making user’s statements, command expressions, etc. are used to describe the decision-making problem, and the programming program runs on the computer to obtain the auxiliary decision-making information.
The knowledge system is the knowledge of the problem domain. In addition to the most basic data records, knowledge also includes a regular description of the problem domain. This description can be expressed in a quantitative manner as a mathematical model or other form of model. With the development of artificial intelligence, the regular knowledge of the problem domain is described in a qualitative way, such as expressed as a generative rule. In other words, data, models, and rules can be thought of as different manifestations of knowledge.
The problem processing system is the core of the decision support system. Its functions include: information collection, problem identification, model generation and problem solving. The structure of the intelligent decision support system is shown in Fig. 3.
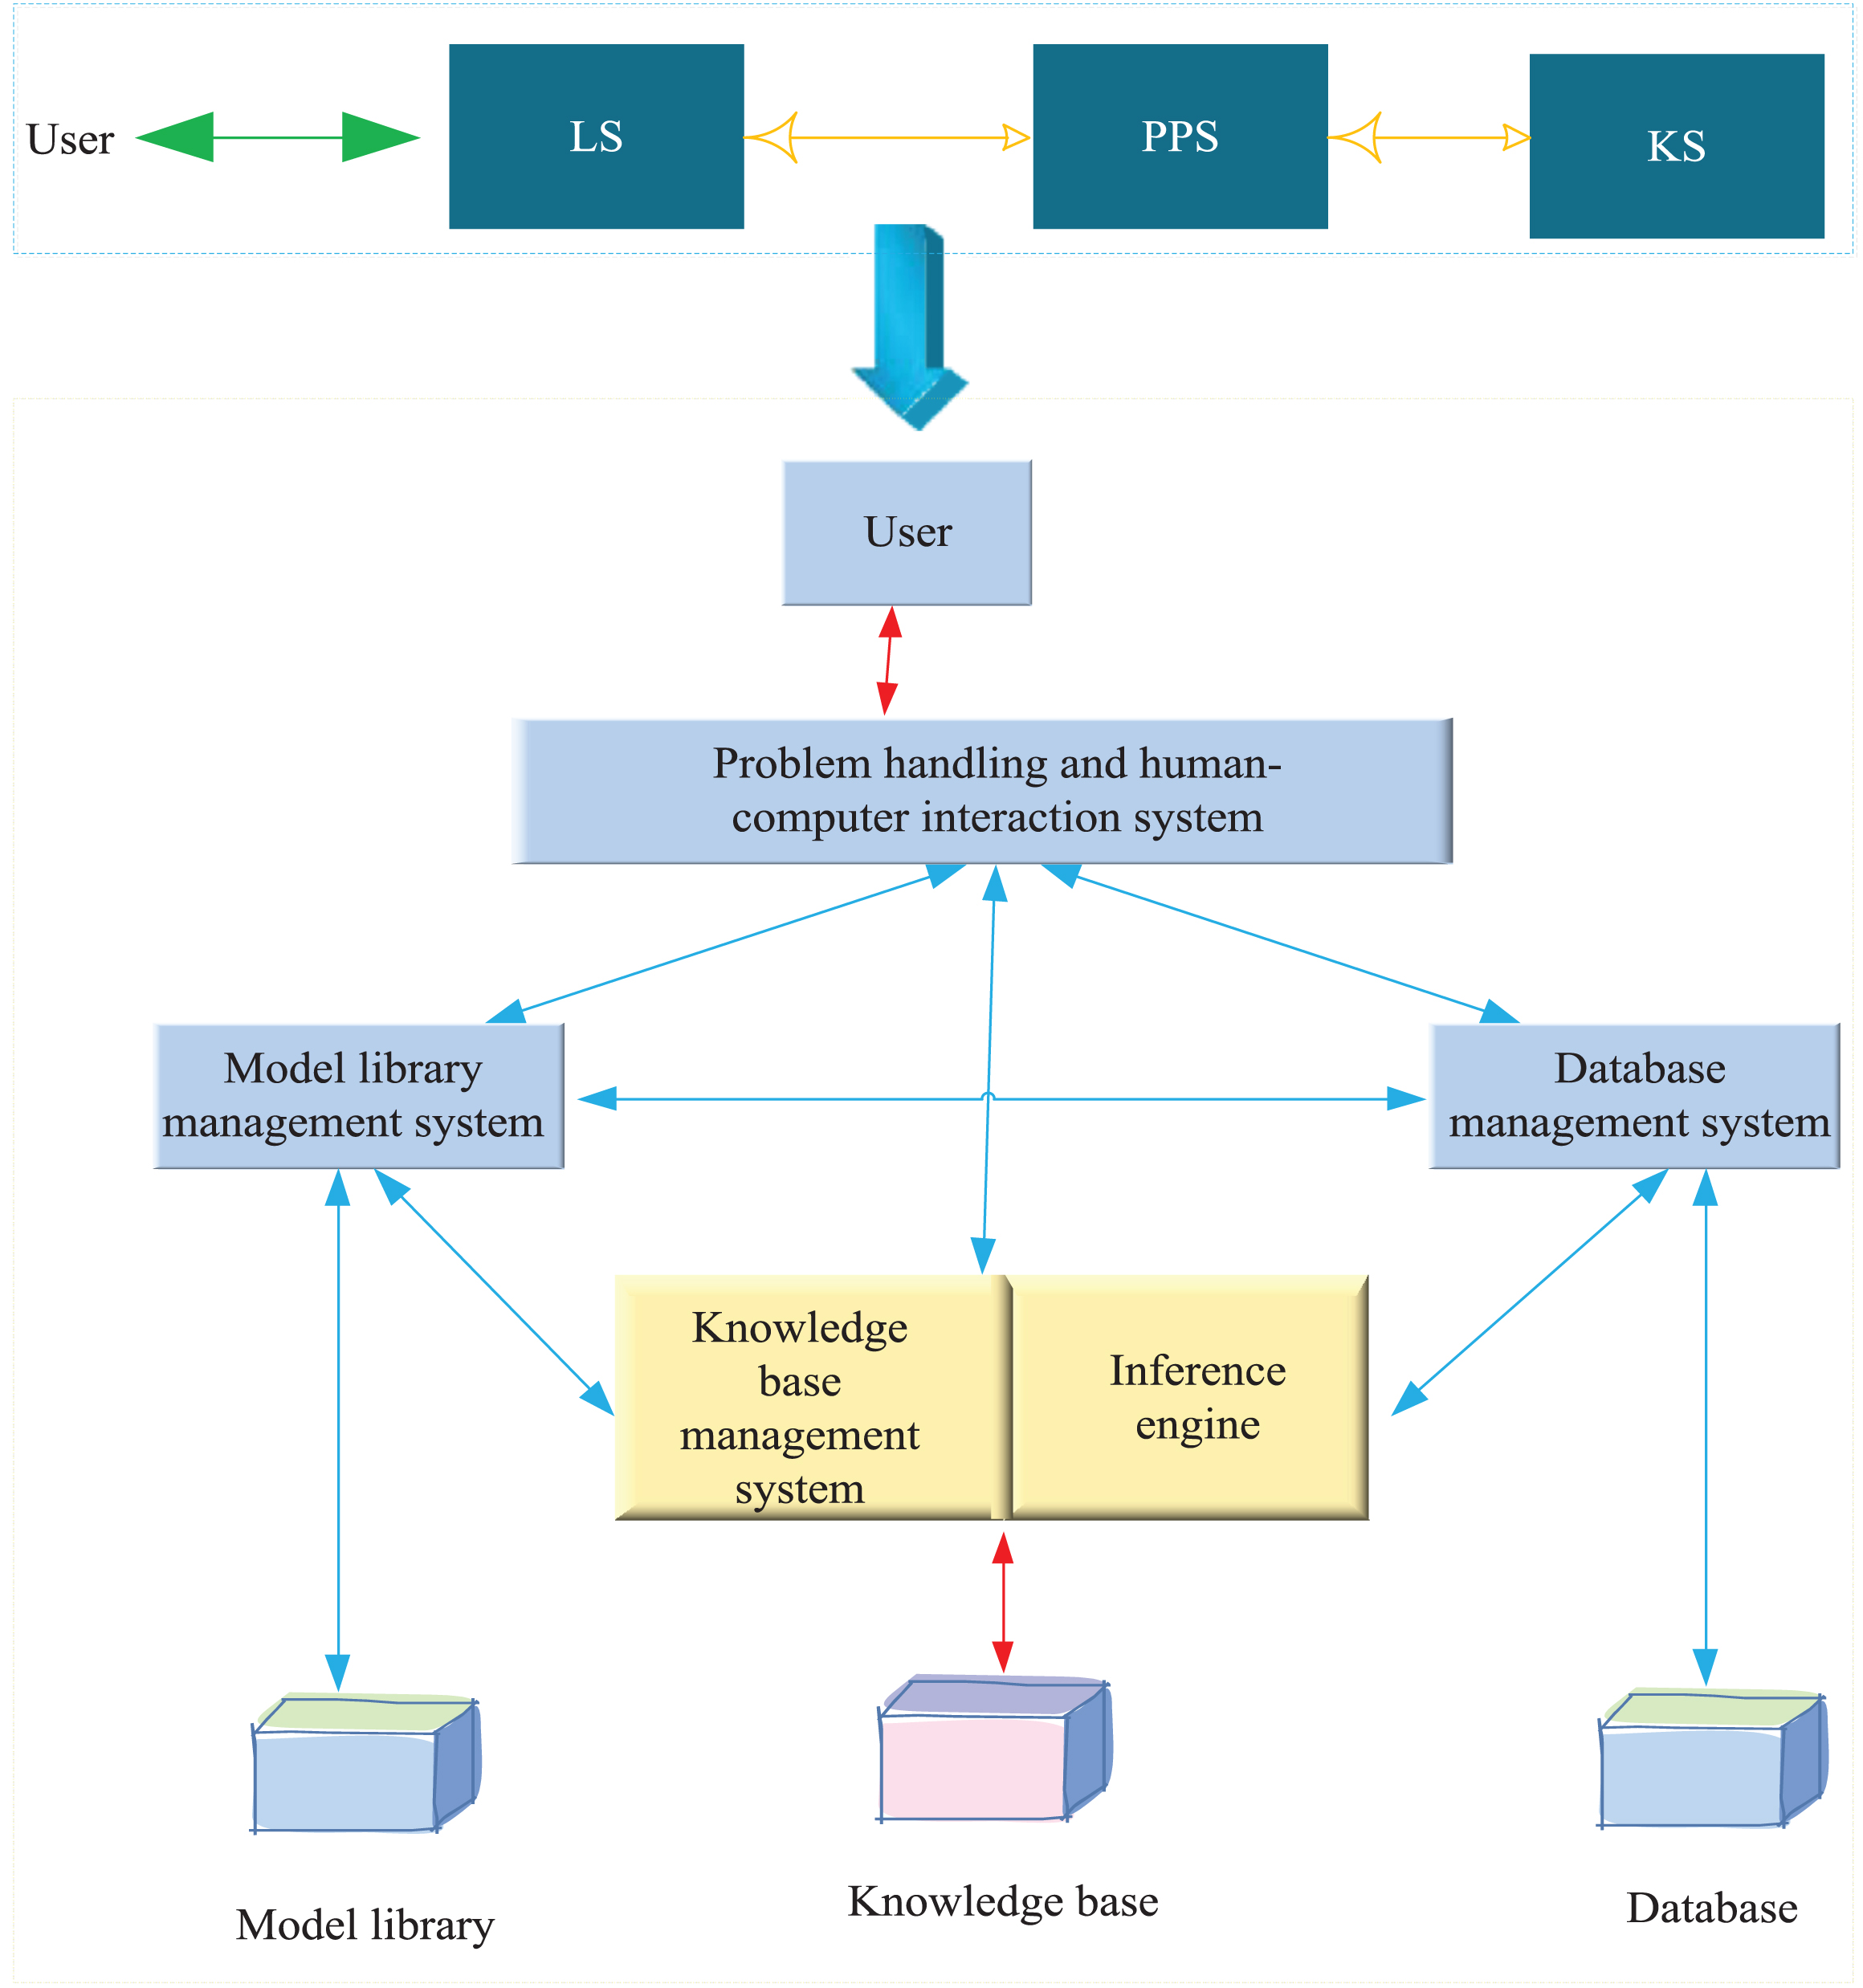
IDSS basic structure.
It is not difficult to see from the structural diagram that the intelligent decision support system fully exploits the characteristics of the expert system to solve the qualitative analysis problem in the form of knowledge reasoning, and also plays the role of the decision support system to solve the quantitative analysis problem. The organic combination of analysis and quantitative analysis makes the ability to solve problems greatly improved and the scope is greatly expanded.
The architecture of spatial intelligent decision system is obtained by integrating GIS module based on IDSS architecture. The integration relationship between them and the workflow of reasoning are shown in Fig. 4.

SIDSS integrated structure.
As can be seen from Fig. 4, the integration of IDSS and GIS is an important part of establishing SIDSS. The inference engine firstly describes the new problem. Based on these characteristics, it retrieves similar cases from the case base, compares the similarities and differences between the old case and the new case, and adjusts the old case to obtain a solution to the new problem.
GIS is a spatial information system that collects, stores, manages, analyzes, and inputs and outputs spatial data and attribute data based on computer graphics and database technology under the support of computer software and hardware environment. One of the core functions of GIS is the expression of spatial analysis query and visualization. It can combine geographical location and related attributes, and display it to users accurately, realistically and graphically according to actual needs. At the same time, it can analyze the business models and development trends that are invisible in the database in a classic and expert way, providing users with a new means of decision-making.
IDSS is often referred to as a generalized expert system. Therefore, in addition to the traditional DSS model to support decision-making functions, it also has the intelligent features of ES. IDSS is based on information technology and uses the theory and methods of decision science and related disciplines. It can achieve the organic combination of quantitative analysis and qualitative analysis, and can solve structural, semi-structured and unstructured problems well.
In terms of decision support, both GIS and IDSS have their own advantages and disadvantages. If the GIS’s ability to process and express spatial data and IDSS are combined for semi-structured and unstructured solutions, the pros and cons of the two complement each other. The integration of IDSS and GIS not only provides IDSS with spatial data processing capability and a more visual and intuitive visual expression platform, but also enables GIS to enter a new stage of direct use and transformation of the objective world from the stage of describing and expressing the objective world. The comparison between GIS and IDSS is shown in Table 1.
Comparison of GIS and IDSS
Compared with traditional IDSS, SIDSS has increased the ability to process, analyze and decide spatial data. Especially in the decision-making process involving a large amount of spatial information, it has better analytical, predictive, decision-making and visual expression capabilities than IDSS.
Design of space emergency intelligent decision system
1) Overall design of the system
The system combines IDSS technology and GIS technology to form a five-column intelligent space decision support system. The overall structure of the system is shown in Fig. 5. The system is composed of database subsystem, model library subsystem, knowledge base subsystem, GIS subsystem, plan library subsystem, integrated reasoning subsystem and human-computer interaction interface and decision processing subsystem.

System structure diagram.
2) Data acquisition
As a node, the system accesses the accusation network and extracts the data on the alleged network in real time, thus realizing the acquisition of data. The server repackages the received data to each workstation according to the specific requirements of each workstation. Each workstation processes and monitors the received data.
3) Process design of space intelligent emergency decision
The problem is formed by converting all source data into a data format close to the pre-planning conditions, forming a description of the problem to facilitate the search matching and rewriting of the plan.
The similarity obtained by the search matching is compared with a predetermined threshold or other setting conditions, and a scenario larger than a specified threshold or other conditions is selected to generate a candidate plan. If you can’t find a solution that is larger than the specified threshold or other conditions, you need to regenerate the plan. The resulting result scenario, along with the problem description, is stored in the case library.
Because the case is a real incident, especially according to the development situation of the accident and the specific situation of the scene, the emergency plan generated by the emergency system is revised and improved. Therefore, the actual case is more specific and the data is more reliable. At the same time, there are still many experiences and lessons in the case, which are more practical. Taking full advantage of these cases, you can generate a plan by finding the closest case in the case library after the plan library search fails.
1) Problem solving chain generation
The problem solving chain is generated as follows:
First of all, the decision-making problem of the whole system is decomposed according to the different emergency means, and the problem space is reduced by using zero-cut and broken methods.
Then, based on the different needs of the reduced decision space, the decision data is refined. From the previous analysis, there are three types of decision data, and the data 3 most relevant to decision reasoning must be calculated by inference of data one and data two.
Finally, for each decomposed decision problem, it collects the required decision data and solves each small decision problem separately.
According to different types of accidents, the content of the required data three is different. They can establish a one-to-many relationship like the accident pattern and the required emergency content. Therefore, it can also be realized by the reasoning method of RBR. For each emergency content, they first create a required decision data table in the knowledge base, corresponding to each table item in the program, and then solve one by one according to the contents of the table.
2) Calculation of similarity
CBR reasoning is a solution to the current problem by examining pre-established similar problems in the repository. Therefore, after entering the target question, you need to find the plan that is most similar to each decision condition in the plan library.
In the similarity evaluation of cases, it is usually established to establish a similarity calculation function to compare the current decision problems with the decision conditions of the plan.
Let the similar function be
U is the object domain, that is, the target plan collection, and CB is the plan collection in the plan library. We use sim(x, y) to indicate the similarity between the target plan x and the source plan y, where x ∈U, y∈CB. Obviously, they have the following characteristics:
Where 0≤gj≤1, j = 1, 2,..., n, gj is the weight of the jth attribute.
Using vectors:
The similarities between the two information entities are calculated by representing the respective attributes of the decision problem T and the plan R in the plan database:
Where gi represents the weight of each attribute.
In order to solve the problem of attribute similarity calculation, we must first define its value range for each attribute, so that its value is normalized, especially when its value range is a symbol set; then the difference of the attribute value is quantified.
First we introduce the concept of distance:
Based on the Mc Cormowski distance metric, it is defined as follows:
Similarity and distance are two concepts of compatibility. Both distance and similarity can describe the degree of similarity between the two plans, and define the difference between the plans. If the similarity function is used to define the similarity between the plans, and 0≤sim(X,Y) ≤1, the relationship between the distance function and the similarity function can be expressed as:
3) Implementation of search matching and correction of the plan
In this system we use the nearest neighbor method. Since the match between the plan and the actual problem cannot be completely accurate, it is necessary to set a threshold, as long as the similarity between the two is greater than the threshold t, then it is selected as a candidate plan, that is, when satisfied:
From the performance method of the plan knowledge, we can see that the nature of the plan problem is various, and the corresponding weights are also different. Therefore, there may be a poor overall similarity of the plan, but the similarity of individual attributes is high. Therefore, in the matching process of the plan, the plan with the highest overall similarity and some low overall similarity but high individual similarity should be retrieved and provided to the decision maker. On the one hand, it provides information for the rewriting of the plan; on the other hand, it provides more complete information for decision makers. In the screening of candidate scenarios, it is necessary to comprehensively consider the overall similarity and the similarity of the attributes. For the plan with large overall similarity but small similarity of attributes, it needs to be revised to meet the needs.
The rewriting operation of the plan is very important in the case reasoning. When there is no plan in the plan library that exactly matches the problem, only one best plan similar to the question to be asked can be found, and then adjusted to make it adapt to the new situation, so that it can be solved. The correction technique can be simply understood as replacing or modifying the entire decision-making scheme with a portion of the decision-making scheme.
We can find relevant case knowledge by searching the case library and generate a new plan by generating a template from the relevant plan of the knowledge base. The case library contains a lot of factual knowledge, especially temporary modifications. The information in these case bases is more reliable, authentic, and complete than the information in the plan library. Therefore, it can be used as a source of knowledge for case corrections.
High efficiency simulation experiment
1) Cube efficiency experiment
Experiments were performed using MAG data in this experiment, and a partial MAG data set was divided into 5 parts. The number of nodes in each copy is 2 million, 4 million, 6 million, 8 million, 10 million. The experimental results are shown in Fig. 6.

Different relationship meta path.
It can be seen from the comparison between P1 and P2 that as the path increases, the time required will also increase. It can be known from the comparison of P2 and P3 that the network generated by P2 has a close dependence and generates a small network. The P3 produces the author’s cooperative network. There are more collaborators in the same article, and the resulting network is larger. Therefore, the aggregation network of the same length meta path will take different time. As can be seen from the figure, as the number of edges increases, the time consumed varies linearly.
Then we experiment with the materialization strategy, selecting the relationship meta path to perform the aggregation operation. For the aggregation network of the materialized path, the unorganized aggregation operation requires four join operations. For materialization, only one join operation is required, and the experimental results are shown in Fig. 7. Through materialization, repeated aggregation calculations can be reduced and operational efficiency can be improved.

Materialization Strategy.
2) Dimension attribute coding
This experiment uses simulated multidimensional network data.
Firstly, the performance of the dimension attribute coding is improved. The experiment is carried out from the perspectives of the number of dimensions and the size of the network. The network with the number of dimensions of 3, 5, 7, and 9 is generated from the perspective of the number of dimensions. The point-side join method and the dimension coding method proposed in this paper are used to roll up the dimensions. The obtained result is shown in Fig. 8.

The number of dimensions affects the coding.
As can be seen from Fig. 8, the dimension coding can greatly improve the efficiency of network aggregation. As the network dimension increases, the point-side join method and the dimension coding method have similar performance changes, and the consumption time increases. This is due to the increase in dimensions and the more storage space required.
A multi-dimensional network with side edges of 1 m, 10 m and 100 m is generated from the perspective of network scale, and the aggregation algorithm is respectively performed. The obtained results are shown in Fig. 9. It can be seen that as the size of the network increases, the efficiency of dimension coding increases, and the way of dimension coding is more advantageous. Dimensional coding can greatly improve the performance of analysis on large-scale networks.

The number of sides affects the encoding.
Through the performance experiments of dimension scale and network scale, it can be concluded that dimension coding can greatly improve the performance of Star Graph Cube for large-scale network analysis.
Fast decision simulation of artificial bee colony intelligent algorithm based on multidimensional network
1) Initial population selection
The initialization of the population is a crucial parameter in the ABC algorithm, and different values have a great impact on performance. When the value is too large, the population base is large, and the probability of finding the optimal solution is large. However, the optimization speed is increased a lot, but the calculation amount is too large; if the value is too small, the convergence speed will be too slow. Therefore, it is necessary to make a compromise between the calculation amount and the convergence speed, and select a suitable initial population number.
Table 2 shows the simulation data when the initial population size is different, and the initialization method adopts random uniform initialization. Since there are not many chromosomal loci in this question, we choose the following cases for comparison. It should be noted that since the value of the honey source elimination threshold limit that affects the simulation result is related to the population size, in order to be more fair when selecting the population number, the limit is taken as half of the population when simulating the population size.
Analysis of different initial population numbers simulation convergence data
By comparing the data in Table 2, it is found that when the initial population increases, the average convergence algebra becomes significantly smaller due to the large search base, but due to the large amount of calculation, the single simulation time is also larger. Based on the above situation, the initial population is chosen to be 30. Since the probability of the optimal solution and the suboptimal solution are both statistical values, only the optimal initial population is found at this time, and other parameters that also affect the convergence probability are not optimal. Therefore, when the initial population becomes large, the convergence probability does not exist.
2) Detection of bee counts and elimination thresholds
After multiple neighborhood searches, it is found that there is no higher quality honey source around the honey source. It is necessary to consider how to increase the diversity of the population and facilitate the search process to jump out of the local optimum. The ABC algorithm performs the “mutation” process by detecting bees, so the number of scouts and the value of the honey source elimination threshold limit have an impact on the final performance. If the number of scouts is too high and the limit is too low, there will be a more comprehensive search for a certain honey source, and the phenomenon of eliminating the honey source will greatly reduce the search efficiency; if the number of scouts is too small and the limit is too high, it will lead to the lack of diversity of the population and eventually fall into local optimum. Therefore, simulation comparison is needed to find the best value. In general, the number of scouts is 5% to 10% of the population.
3) Rapid decision simulation analysis
The ABC-based fast decision-making unit is simulated. The optimal solution is that the MCS is 12th order and the SNR is 0 dB. The BER is 10-6, which meets the system requirements and has the highest transmission rate.
In order to explain the simulation performance under different SNR, the SNR is taken as a fixed value, not as a decision result. The simulation based on ABC fast decision engine is performed on –15 dB≤SNR≤0 dB. The result is shown in Fig. 10.

Average information transmission rate based on ABC fast decision engine under AWGN channel.
Since the gene position is reduced by more than half, the search space dimension is reduced. At this time, the average convergence speed is within 5 generations, and the optimal solution convergence probability within 200 generations is 100%. Since the number of simulation points is 106, 10-6 is used here to represent the case where the bit error rate is zero. Under each SNR, the decision result based on the ABC fast decision engine corresponds to a system BER of 10-6, which satisfies the system requirements. At the same time, the corresponding average information rate is the highest under the same conditions. The description is based on the ABC fast decision engine with good performance.
Based on the traditional OLAP model, this paper improves the shortcomings of weak analytical ability and insufficient support for large-scale data, and proposes a new large-scale multi-dimensional heterogeneous network model. The concept of relational meta-path and primary node is introduced into the model to increase the support for heterogeneity. The primary node guides the generation of the meta-path, and the meta-path guides the basic operations such as scrolling down the network. Based on the use of artificial intelligence technology and GIS technology, combined with software engineering and methodology, a networked space emergency intelligent decision platform based on GIS platform was established. The effectiveness and efficiency of large-scale multidimensional heterogeneous network analysis is verified by experiments on real and simulated data sets. The fast decision making unit based on ABC is studied. Firstly, the ABC-based fast decision engine framework is designed, and the problem of the research in this engine is modeled. The ABC algorithm has parameters that affect performance, and the parameters corresponding to the best performance are different for different environments and problems. The simulation results show that the fast decision unit based on ABC proposed in this paper not only has good ability in anti-interference, but also greatly improves the transmission efficiency on the basis of ensuring communication accuracy. However, the current mining and analysis of multi-dimensional heterogeneous networks is mainly based on entity type and dimension attributes. Later, more Graph OLAP operations can be proposed, combined with deeper graph mining to enrich the analysis of multi-dimensional heterogeneous networks.
Footnotes
Acknowledgments
Research on the Evolution Mechanism and Development Strategy of Civil Military Integration Innovation Ecosystem in Western China in the New Era” (18BGL033) supported by the National Social Science Foundation of China.