
Abstract
Our country’s economic growth is overly dependent on government investment, and bank credit and money supply lack a strict monitoring mechanism. Therefore, rapid economic growth is always accompanied by inflation risks. In order to study the effect of inflation impact analysis, based on machine learning algorithms, this paper combines artificial intelligence technology to analyze the impact of inflation expectations, and constructs the central bank information disclosure index and inflation expectations index. Moreover, this paper will perform ADF unit root test on the data. In addition, after confirming that the data is stable, this paper uses the Markov Regime Transfer Vector Autoregressive (MSVAR) model and state-dependent impulse response function to test and analyze the effect of China’s central bank communication in guiding the formation of inflation expectations. Through research, we can see that the machine learning algorithm constructed in this paper has significant effects, which can provide a reference for the analysis of the impact of inflation expectations.
Introduction
The experience of various countries shows that expectation management can improve the effectiveness of monetary policy and is a useful supplement to the traditional monetary policy system. The expected behavior of the public directly affects the decision-making behaviors of micro-individuals such as investment, consumption and savings, and the micro-level decision-making will affect the investment, consumption and savings of the entire society, and then affect the entire macro economy. Therefore, strengthening market expectations management and guiding micro entities to make reasonable expectations for the future economy can not only promote the stability and long-term development of the macro economy, but also maximize the effectiveness of monetary policy regulation. In recent years, market sentiment and psychological factors have gradually received more attention. With the continuous development of expectations theory and the continuous improvement of various survey databases, many literatures have found that the public’s expectations show biased characteristics through the biased test of the expectations of different macroeconomic variables, which are considered to be the source of macroeconomic fluctuations [1].
For the management of inflation expectations, the guiding role played by traditional monetary policy tools is self-evident. However, this is not enough to guide the public’s inflation expectations in a timely and effective manner. The reason is that traditional monetary policy tools have a long-time lag in the transmission process. Therefore, it is necessary to explore the combination of tools with shorter time lag. In the process of managing inflation expectations, central banks of various countries have generally realized that central bank information disclosure, that is, central bank communication, has increasingly become a new monetary policy control tool. The central bank can use information disclosure to reduce the public’s uncertainty expectations for the economy, thereby reducing inflation expectations and actual inflation fluctuations. At the same time, the central bank can avoid misunderstanding of policies by economic entities through communication about policy intentions, policy positions, and judgments on future economic trends, and increase the predictability of central bank policies [2].
Based on the perspective of central bank communication, it is particularly important to discuss the management of inflation expectations for the ability to smooth macroeconomic fluctuations and has strong practical significance. During an economic boom, the public will be optimistic about the economy and believe that the economic situation is very good. However, during the economic depression, the public will feel pessimistic about the economy, thinking that it is difficult for the economy to get out of the downturn. Changes in public sentiment under different economic conditions will cause obvious differences in the formation mechanism of inflation expectations, which will have a greater impact on the effectiveness of central bank communication. Therefore, on the basis of previous studies, this paper divides China’s economy into two stages, and considers the situation with and without central bank communication in different economic stages and examines the impact of inflation expectations deviation on the main macroeconomic variables [3].
Related work
The literature [5] believed that loose monetary policy alone is not enough when the economy is facing a liquidity trap. The central bank also needs to guide the public to form higher inflation expectations through various methods. The reason is that when the economy is in a recession, the public will be more pessimistic about the economy and produce low inflation expectations or even deflation expectations, which will offset the effect of the central bank’s loose policies. The literature [6] pointed out that when the nominal interest rate is constrained by the zero-lower bound, expectation management can effectively push the economy out of depression. The literature [7], through empirical testing, believed that forward-looking guidance policies play an important role in stabilizing financial markets and inflation, which further affirms the positive role of expectations management. The literature [8] pointed out that the use of forward-looking guidelines by central banks with lower credibility can effectively anchor public expectations and reduce the public’s uncertainty in future economic expectations.
The literature [9] discussed in detail the impact of expectations management on the effectiveness of monetary policy by constructing a simplified New Keynesian DSGE model. Moreover, it showed through numerical simulation that when monetary policy is constrained by the lower limit of zero interest rate, it can lead the public to form higher inflation expectations, which can reduce the welfare loss caused by the crisis and improve the effectiveness of monetary policy. The literature [10] constructed a model that includes private information and public information. The model assumes that economic entities will rely on public information when forming expectations. The central bank can change public information to influence market expectations by increasing the transparency of monetary policy, thereby affecting the effectiveness of monetary policy. The literature [11] found by constructing a monetary policy transparency index that when the public’s incomplete understanding of the economic operation process and results is considered, the increase in monetary policy transparency can better guide market expectations and improve the effectiveness of monetary policy. The literature [12] constructed a theoretical model based on the Lucas aggregate supply curve and the central bank’s loss function and found that inflation depends on the central bank and the private sector’s respective forecasts of economic shocks. Then, it studied the relationship between monetary policy transparency and anti-inflation based on information asymmetry. The results show that increasing the transparency of monetary policy can reduce expected deviations and stabilize inflation. The literature [13] put forward the “information stickiness theory” on the basis of sticky prices. Because the “information stickiness theory” can better explain the real economy, some scholars have begun to study the role of expectation management in improving the effectiveness of monetary policy regulation by estimating my country’s inflation expectation data under the framework of the “information stickiness theory”. The literature [14] used the rolling VAR model to estimate inflation expectations data with sticky information. Moreover, through analysis of the effectiveness of monetary policy, it is found that when inflation expectations are lower than 2.8%, reducing M1 can significantly curb inflation. However, when inflation expectations are higher than 3.9%, interest rates are an effective means to curb future inflation. The literature [15] estimated the data on the fluctuation of inflation expectations in my country by introducing inflation expectations and expectations management information on the basis of the “information stickiness” model. The research results show that since 2007, the expected management policy of my country’s central bank has played an increasingly significant role in reducing the volatility of inflation expectations and has become more pronounced during the crisis. The literature [16] constructed a dynamic stochastic general equilibrium model including expected error shock and expected management and examined the impact of exogenous shocks on the business cycle. Based on the DSGE model with consumption inertia and financial accelerators, the literature [17] analyzed the impact of inflation expectations deviations on macroeconomic stability under different monetary policy tools. The results show that the inflation expectation deviation shock has a positive impact on the economy under price-based instruments and has a negative impact under quantitative instruments. The literature [18] explored the ability of expectation management to deal with economic fluctuations in the case of insufficient monetary policy effectiveness by constructing a DSGE model that includes expected deviation shocks and expected management. The results show that expectations management guides market inflation expectations through counter-cyclical, which can greatly reduce economic fluctuations and make the economy converge to a steady state more quickly. The literature [19] introduced adaptive expectations in the RBC model and the New Keynes model respectively. The results all show that individuals’ uncertain expectations of the economy will cause individuals to constantly change their views on the economy, thereby constantly changing their own investment and consumption decisions, and ultimately leading to sustained economic fluctuations. The literature [20] introduced adaptive expectations in the standard growth model. The results show that the public’s learning behavior has an important influence on the continuous fluctuation of macroeconomic variables, and compared with the rational expectation model, the technological shock in the adaptive learning model plays a significant role in the formation of the business cycle. The literature [21] introduced differential belief expectations into the New Keynesian model, and simulated and analyzed the impact of heterogeneous expectations on the macro economy. The results show that macroeconomic fluctuations come not only from exogenous shocks, but also from the heterogeneity of market expectations. Moreover, the expectation of heterogeneity makes the impact of monetary policy on inflation and output fluctuations no longer satisfying monotonicity. The literature [22] believed that the heterogeneous characteristics of public expectations may produce demand-driven real economic activities or financial market fluctuations and may also delay the disappearance of supply shock effects. The literature [23] believed that due to the difference between the public’s access to information and the processing of information, the expectations of inflation show heterogeneous characteristics, and the asymmetry of information will cause information diffusion and learning between the strong and the weak. By constructing a heterogeneous new Keynesian model with rational expectations and adaptive expectations equilibrium, the literature [24] used Bayes to estimate that 80% of China’s macroeconomic expectations present adaptive characteristics. Moreover, dynamic simulations show that adaptive expectations make inflation less sensitive to monetary policy response but increase durability.
The role of central bank communication in guiding inflation expectations
The M-S model assumes that economic actors have different views on basic economic parameters and have different personal information, but they can observe the same noise signal (that is, public information) at the same time. In this way, economic actors can rely on this information set (private information and public information set) to form their own inflation expectations and make their own behavioral decisions.
We assume that the economic agent i is evenly distributed in the [0, 1] interval, and the economic agent will make a behavioral decision a
i
, and a
i
∈ R. If we use R to represent all the decision-making actions of the agent, the utility function of the economic agent i is:
According to the above welfare function, it can be seen that when the decision-making action a
i
of the economic agent and the basic economic parameter θ are closer, the social welfare level will be higher. However, from the perspective of economic actors themselves, their optimal behavior can be determined by the derivation of the above formula:
Among them, E
i
() represents the expected operator of the economic agent,
We believe that in the process of communication between the central bank and economic actors, economic actors will face two types of information. One type of information is public information:
Among them, there is
Among them, a
i
(y) is the decision function of the economic agent on the information y, and E (∘ |y) is the conditional expectation operator on the information y. Because the economic agent thinks
Another type of information received by economic entities is private information, which is:
Among them, there is
At this stage, economic actors rely on the information collection composed of public and private information to make behavioral decisions: a i (y, x i ) = a (I).
We define
This game process is divided into two steps: In the first step, due to asymmetric information, the central bank takes action before the economic agents. Therefore, judging the current economic situation can determine the accuracy of public information to maximize the level of social welfare. The second step is that economic actors make behavioral decisions based on the observed information collection (private information and public information) to maximize the level of personal utility.
In order to obtain an equilibrium solution, we assume that behavioral decision-making actions are linear functions based on public and private information, and linear equilibrium is the only equilibrium solution. The decision function of the actor is:
The estimated conditions for the average action of all economic actors are:
After putting the above formula into formula (3), we get the optimal decision-making action of economic agent i as:
By comparing the above formula with the coefficient of formula (9),
It can be seen from the above formula that when α → 0, or β→ ∞, there is a i = x i . It shows that when the central bank’s information disclosure is extremely inaccurate or the information collected by individuals is extremely accurate, the central bank’s information communication loses its function of guiding inflation expectations. When α→ ∞ or β → 0, there is a i = y. This shows that when the central bank’s information disclosure is very accurate or personal information is very inaccurate, economic actors will choose to trust the central bank’s public information and ignore private information. That is, the public will listen to the information communication of the central bank, and the central bank can effectively guide and manage residents’ inflation expectations through information communication.
In this model, economic agents will not make rational expectations, so economic agents will be affected by their own emotions when they form inflation expectations. We assume that the basic parameter of the economic situation observed by economic agents is θ, and divide the economic situation into two states: prosperity and recession.
We assume that the inflation expectations generated by economic agents are π
p
. After being affected by public sentiment, the inflation expectation is mπ
p
, and the target expectation formed by the central bank is π
cb
. The central bank can understand the inflation expectations of economic agents, and once it deviates from the target expectations, the central bank will communicate with the economic agents about the deviations. Therefore, the central bank’s communication bias can be expressed as:
In order to compensate for the expected deviation, the central bank will send a signal w to economic entities through a certain channel f for communication. When economic entities receive a signal, they will observe a signal with noise ɛ. Then, the signal received by the economic agent is:
Among them, there is
By receiving the communication signal, the economic agent observes that the central bank’s target expectation is π
pcb
, and the expectation after being affected by the economic agent’s sentiment is mπ
pcb
. The expression of π
pcb
constructed with reference to the Hoeberichts (2009) method is:
Among them, K = 1 - e-2f and 0 ⩽ K ⩽ 1. K can be used as an indicator of the central bank’s communication effect, and the smaller the K, the less the number of communication and the better the communication effect. However, a smaller K means more communication times and poor communication effects.
After the central bank communicates, the inflation expectations of economic entities will be affected by the communication and become:
Among them, the fixed parameter γ represents the optimal weight and satisfies 0 ⩽ γ ⩽ 1.
The purpose of central bank communication is to reduce the deviation between public expectations and target expectations. Therefore, when the difference between the target expectation and the public expectation is 0, the best result is obtained. Therefore, there are:
Then, we can get the following results:
It can be seen from the above formula that when m is larger, K is smaller. However, when m is smaller, K is larger. In other words, when the economy is in a prosperous period, the public mood is optimistic. At this time, the central bank communicates and guides the public to expect better results. However, when the economy is in a recession, the public sentiment is pessimistic. At this time, the central bank’s communication and guidance to the public are less effective.
The combination of MRS model and VAR model is called Markov transfer vector autoregressive model. Its main feature is that the regression parameters of the model change with the change of zoning variables. The basic principle of the MSVAR model is: for the observable time series vector x i , the parameters in the process of change generation depend on the unobservable zoning variable d i . d t represents the probability of the model in different districts.
If we assume that the lag is p and the number of zoning systems is m, MSVAR (p) can be expressed as:
Among them, the transfer function μ (d
t
) changes with the change of the zoning status d
t
. Then, there are:
Among them, the state variable d t ∈ { 1, ⋯ , m } depends on the process of the Markov chain of the discrete zone system and the time zone system.
The transition between various states is represented by the transition probability, and the transition probability from zoning state i to zoning state j is:
For the Markov transition vector autoregressive model, it is necessary to add ergodicity and irreducibility assumptions to the Markov chain process described above. Therefore, the transition matrix is expressed as follows:
P in the above matrix satisfies certain rules, that is:
In the process of depicting the mean value by the above model, if there is a one-time jump in zoning, the model will also change immediately. In some cases, when the model is transferred from one zoning state to another, the model average may change to a more reasonable value. Therefore, at this time, we should use the following intercept term district system dependence model:
For the nonlinear MSVAR model, the mean adjustment model and the intercept adjustment model are not equivalent, and they describe the different dynamic adjustment modes of observable variables after the zoning changes.
The impulse response function is an important analysis tool in the vector autoregressive (VAR) model, which reflects the impact of the model’s endogenous variable pulse on all endogenous variables including itself. Similarly, there is the same analysis tool in the MSVAR model, which is called the state-dependent impulse response function. It represents the dynamic response relationship between all variables under different zoning states, and the different zoning systems are interconnected. In this regard, we write it in the following form:
Among them, ɛ
t
∼ N (0, 1), and d
t
is the zoning state variable (d
t
= 1, 2, ⋯ , m), and different state variables can distinguish different zoning. A
d
t
is the zoning-related matrix, and A
d
t
ɛ
t
is the error term of the model. Thus, the covariance matrix of the model error term can be expressed as:
In order to estimate the state-dependent impulse response function, we must first calculate A d t . There are A d t constraint conditions k (k - 1)/2 in the matrix (k is the number of variables contained in x t ). However, the MSVAR model can only estimate the variance and the covariance matrix ∑ d t . Therefore, in order to be able to estimate the matrix A d t , we must restore the simplified formula to the original formula.
We assume that A d t is the next triangular matrix (A d t is the chole sky decomposition of). At this time, the ordering of variables in the model is particularly important. It will affect the result of the state-dependent impulse response function. When a certain endogenous variable in the model is the cause of the change of other variables and is ahead of the change of other endogenous variables, it means that this endogenous variable cannot be explained by other endogenous variables. In other words, its exiguousness is relatively strong and can explain the influence of other endogenous variables in the model. Therefore, when performing model analysis, the ranking of variables is the key point. Important variables (variables with strong exogeneity and great influence) should be put first, and less important variables should be put behind. In the MSVAR model, a total of mk2 impulse response functions can be estimated. This represents the impulse response function of k variables and k pulses under m different zoning states.
When using chole sky decomposition, we can standardize the change of each unit and can clearly compare the impact difference between the variables:
The above formula represents the expression of the impulse response function under the i-th zone system. It represents the expected change in period t + h after the endogenous variable is impacted by a standard deviation of the k-th variable in period t within the i-th district system.
The state-dependent impulse response function can also be expressed as:
Through the state-dependent impulse response function of the MSVAR model, it can be observed that under different zoning states, When the endogenous variable to be explained is impacted by the uncertainty of other endogenous variables, including itself, the magnitude and magnitude of the response changes over time. We need to observe the characteristics of whether the reaction is positive or negative, whether the reaction period is long or short, and whether the reaction is continuous or beating. This is helpful for us to understand the degree of dynamic interaction between related variables in the model.
In order to study the expectations that are more in line with the situation in our country, the values of the two indicators, the expected inflation target value and the expected interest rate target value, are both the arithmetic averages of the previous three months and the previous six months. That is, the preliminary estimate of the expected inflation rate will have four series, namely r3π3, r3π6, r6π3, and r6π6. Among them, r3π3 represents the expected inflation rate sequence obtained by using the arithmetic average of the actual interest rate and actual inflation rate in the previous three months as the expected value of the next period of the People’s Bank of China control target. The meaning of the remaining three sequences can be deduced by analogy.
The results of Wald’s test on the four sequences are shown in Table 1 below. At the 5% significance level, r3π3, r6π3, and r6π6 cannot reject the null hypothesis, which is consistent with the unbiased nature of expected inflation. However, the r3π6 sequence rejects the null hypothesis, indicating that the expected result is biased and there is a certain gap between it and the ideal state.
Unbiased test of expected value
Unbiased test of expected value
After that, this paper conducts hypothesis testing on the expected errors of the four sequences, and the results are shown in Table 2. The test results show that at the 5% significance level, the null hypothesis cannot be rejected, and the mean value of the expected error can be considered to be zero.
The results of the hypothesis test with the mean expected error being zero
The correlation test results of the sequence are shown in Table 3 Table 6, and the corresponding statistical graphs are shown in Figs. 2 5. The test results show that at the 5% significance level, the expected error of the r3π3 sequence does not have autocorrelation, which is the most in line with the nature of rational expectations. However, the expected error of r3π6 sequence has autocorrelation, which is most inconsistent with the nature of rational expectation. The expected error of r6π3 sequence has no autocorrelation when it lags the first and second orders, and autocorrelation starts from the third order. The expected error of the r6π6 sequence has no autocorrelation when it lags the first, third and fourth orders, and there is autocorrelation in the remaining lag orders, which is a certain gap from the state of rational expectations. Statistical diagram of the hypothesis test result with the mean expected error being zero as show in Fig. 1.
Autocorrelation coefficient, partial correlation coefficient and Q statistics of expected error(r3π3)
Autocorrelation coefficient, partial correlation coefficient, Q statistics of expected error(r3π6)
Autocorrelation coefficient, partial correlation coefficient and Q statistics of expected error (r6π3)
Autocorrelation coefficient, partial correlation coefficient and Q statistics of expected error (r6π6)

Statistical diagram of the hypothesis test result with the mean expected error being zero.

Statistical diagram of autocorrelation coefficient, partial correlation coefficient and Q statistics of expected error (r3π3).

Statistical diagram of autocorrelation coefficient, partial correlation coefficient and Q statistics of expected error (r3π6).
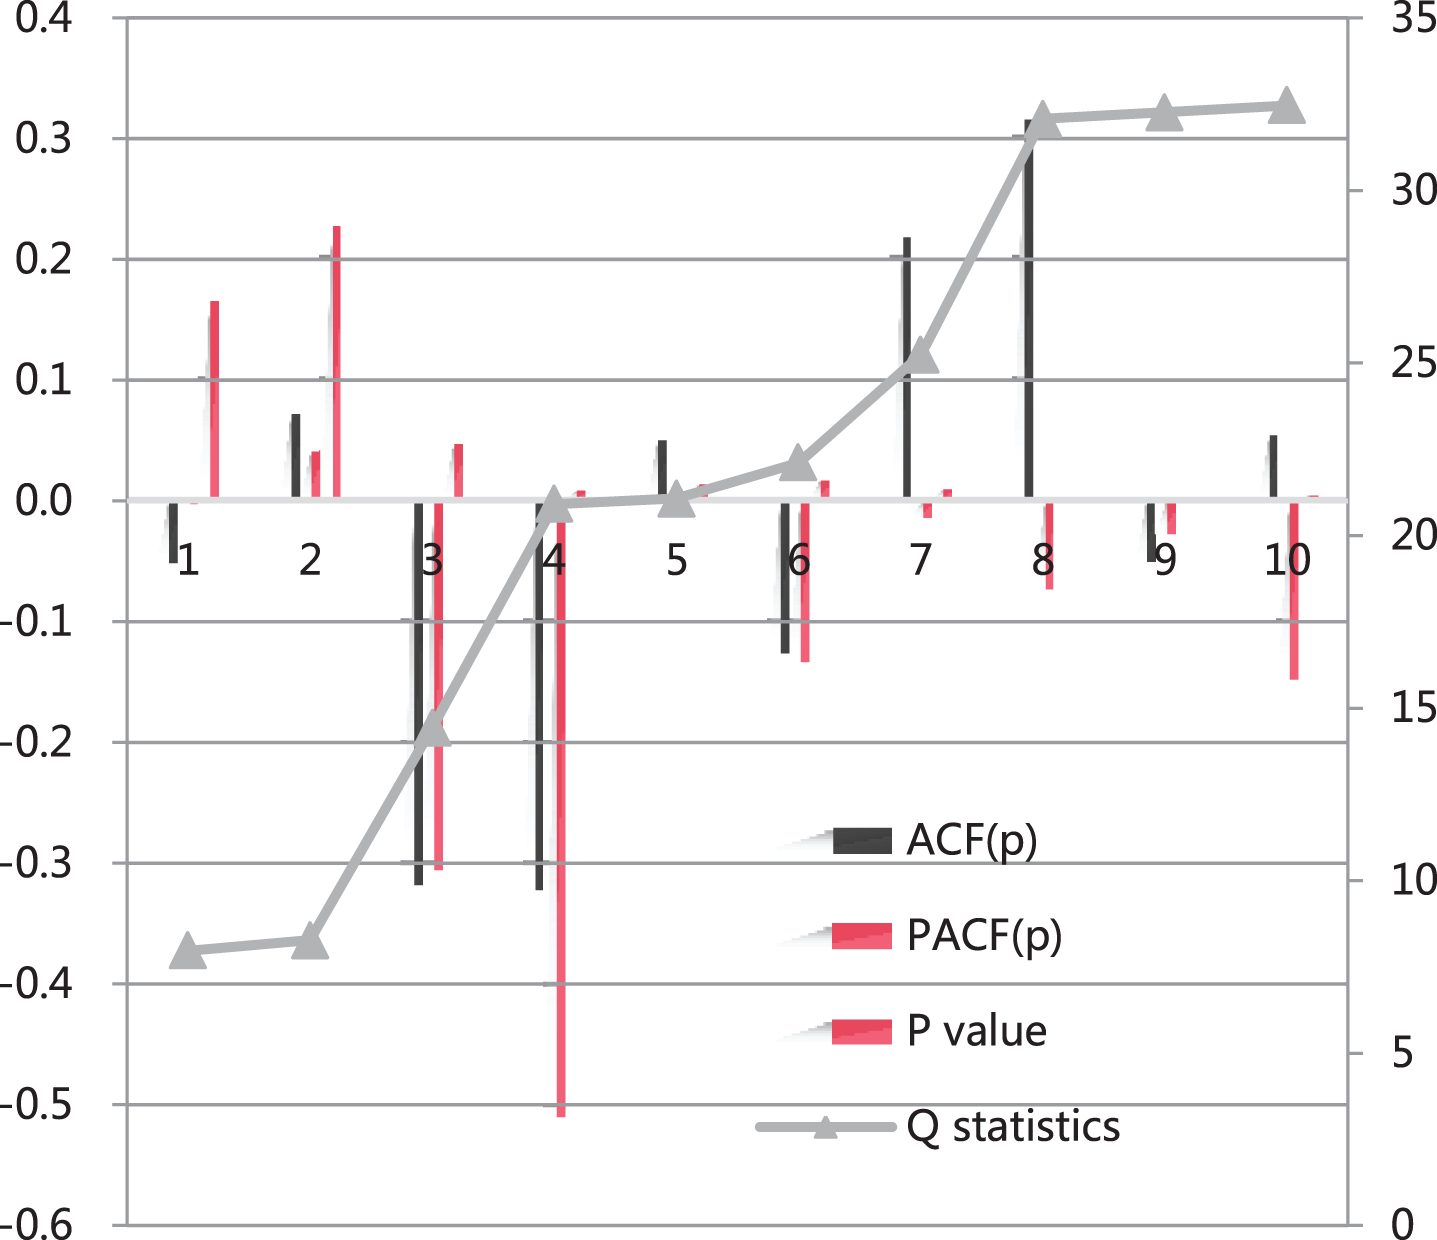
Statistical diagram of autocorrelation coefficient, partial correlation coefficient and Q statistic of expected error (r6π3).
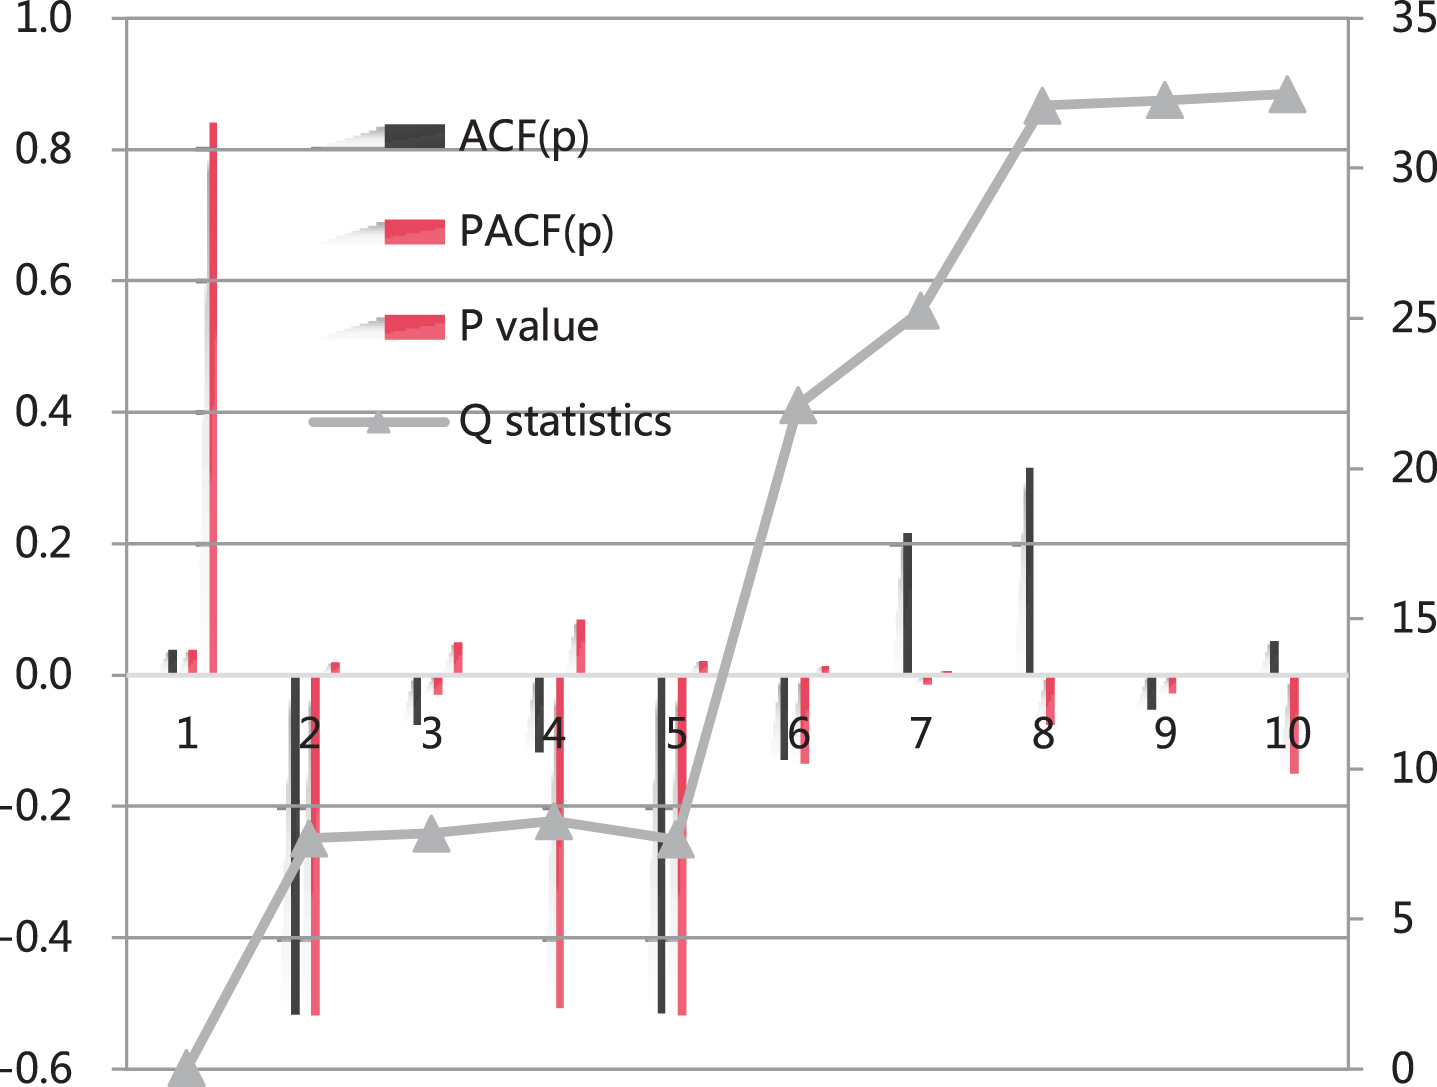
Statistical diagram of autocorrelation coefficient, partial correlation coefficient and Q statistic of expected error (r6π6).
The test results of the nature of the four expected inflation rate series are summarized in Table 6. According to the theory of rational expectations, inflation expectations should be unbiased, with an average expected error of zero and no autocorrelation. Based on the aforementioned test results, the r3π3 sequence is most consistent with the rational expectations theory. That is, this paper adopts the arithmetic average of the actual interest rate and actual inflation rate in the first three months as the expected value of the next period of the People’s Bank of China’s control target, which is a more suitable choice for our country.
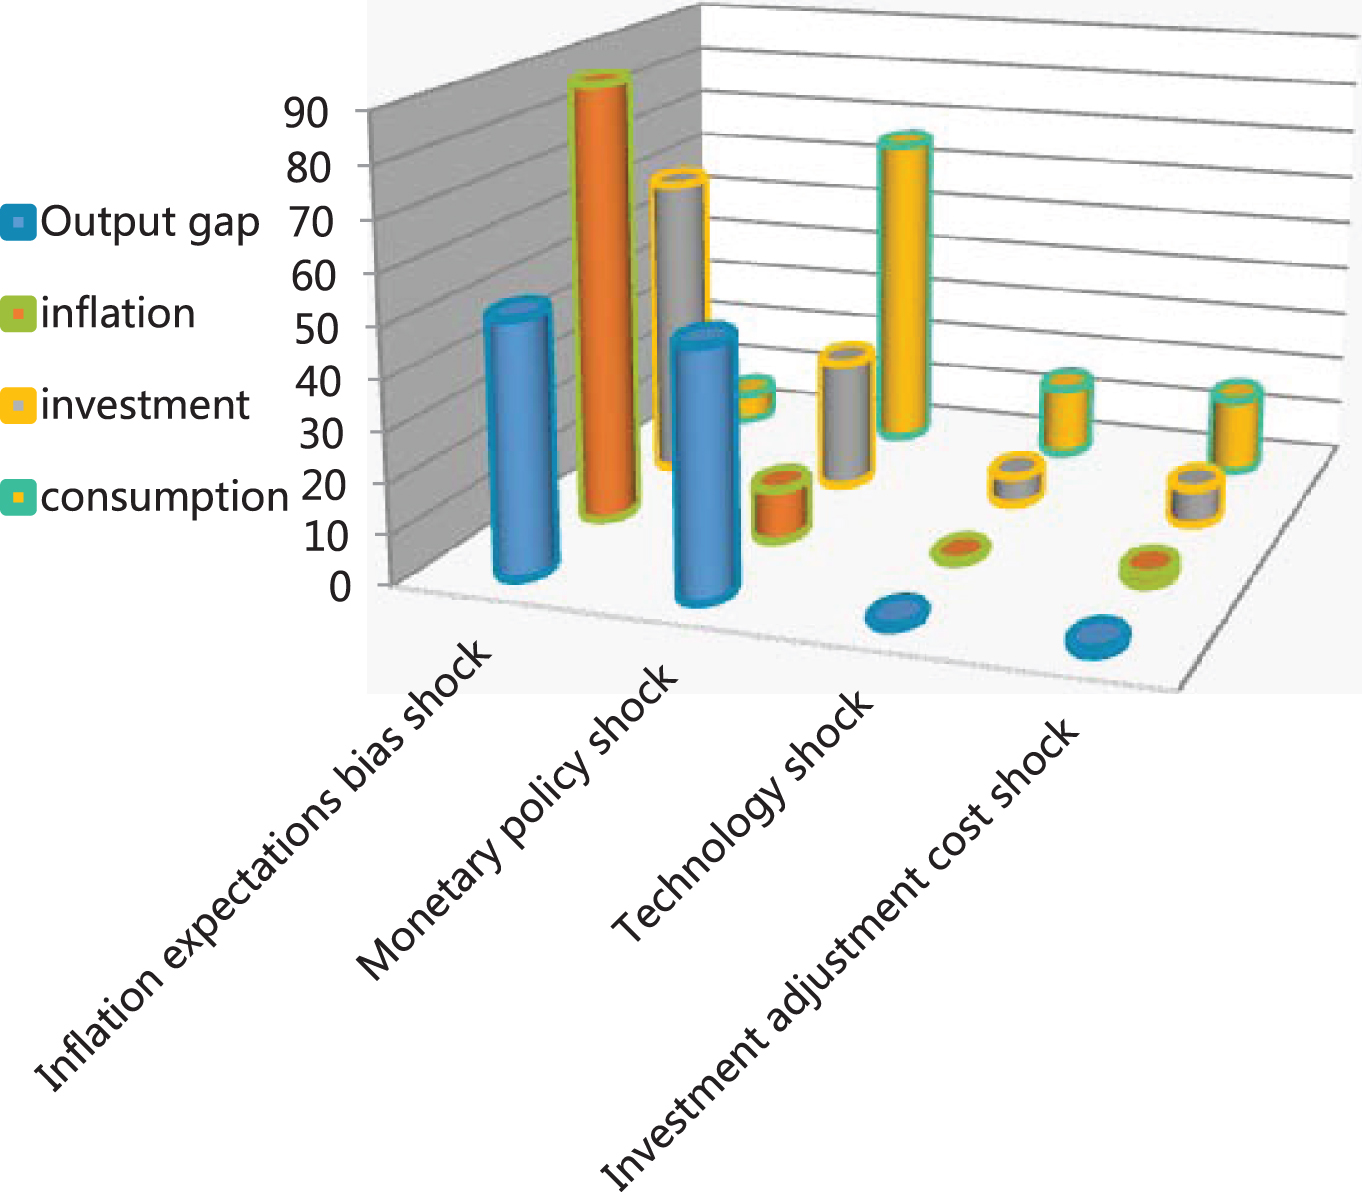
Table 7 and Figs. 6 and 7 show the contribution of the impact of inflation expectations, monetary policy, technology and investment adjustment costs to the fluctuation of major macroeconomic variables during the economic recession. This shows that during the economic recession, the central bank’s communication can to a certain extent reduce the fluctuations in the macro economy caused by the impact of deviations in inflation expectations. In particular, central bank communication performs better in reducing the contribution of expected deviation shocks to inflation fluctuations.
The forecast variance decomposition of main macroeconomic variables during the economic depression period (unit: %)
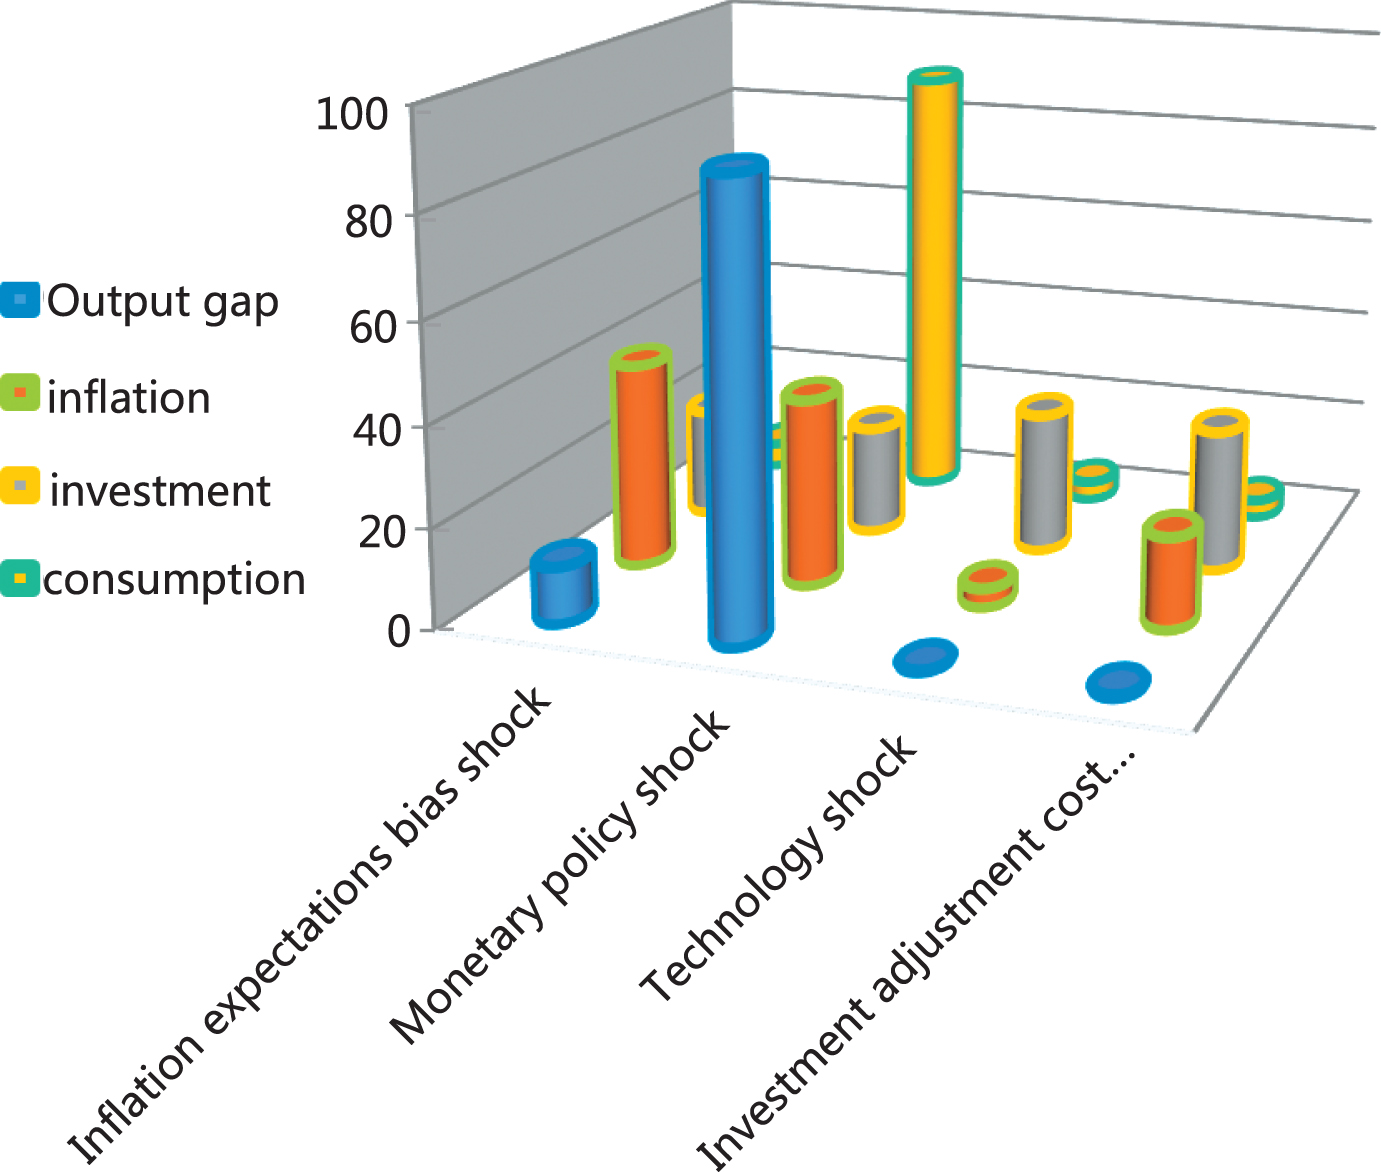
The forecast variance decomposition of main macroeconomic variables during the economic depression period (no central bank communication).
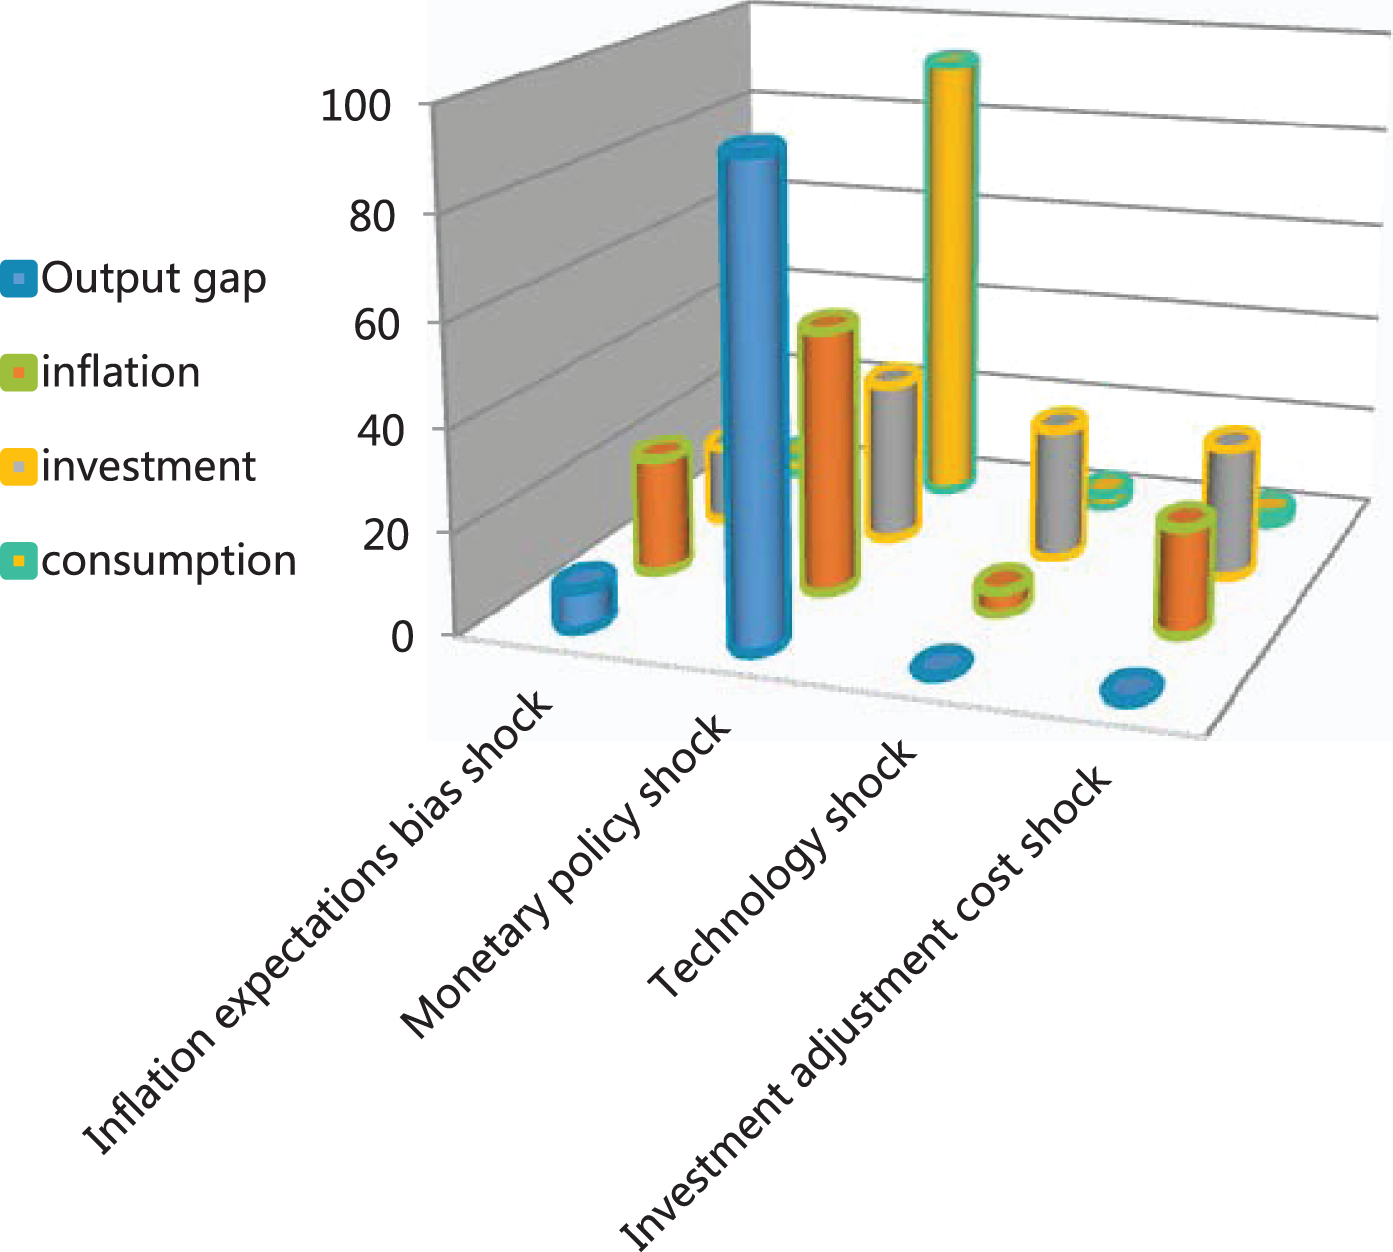
The forecast variance decomposition of main macroeconomic variables during the economic depression period (with the central bank communication).
Table 8 and Figs. 8 and 9 show the contribution of inflation expectations deviation shock, monetary policy shock, technological shock, and investment adjustment cost shock to the fluctuations of major macroeconomic variables during the economic boom. This shows that during the economic boom, the central bank can more effectively reduce the fluctuations in the macro economy caused by the impact of deviations in inflation expectations by strengthening information communication. In particular, central bank communication performed better in reducing the contribution of expected deviation shocks to output fluctuations.
The forecast variance decomposition of main macroeconomic variables during the economic boom period (unit: %)
The forecast variance decomposition of main macroeconomic variables during the economic boom (no central bank communication).
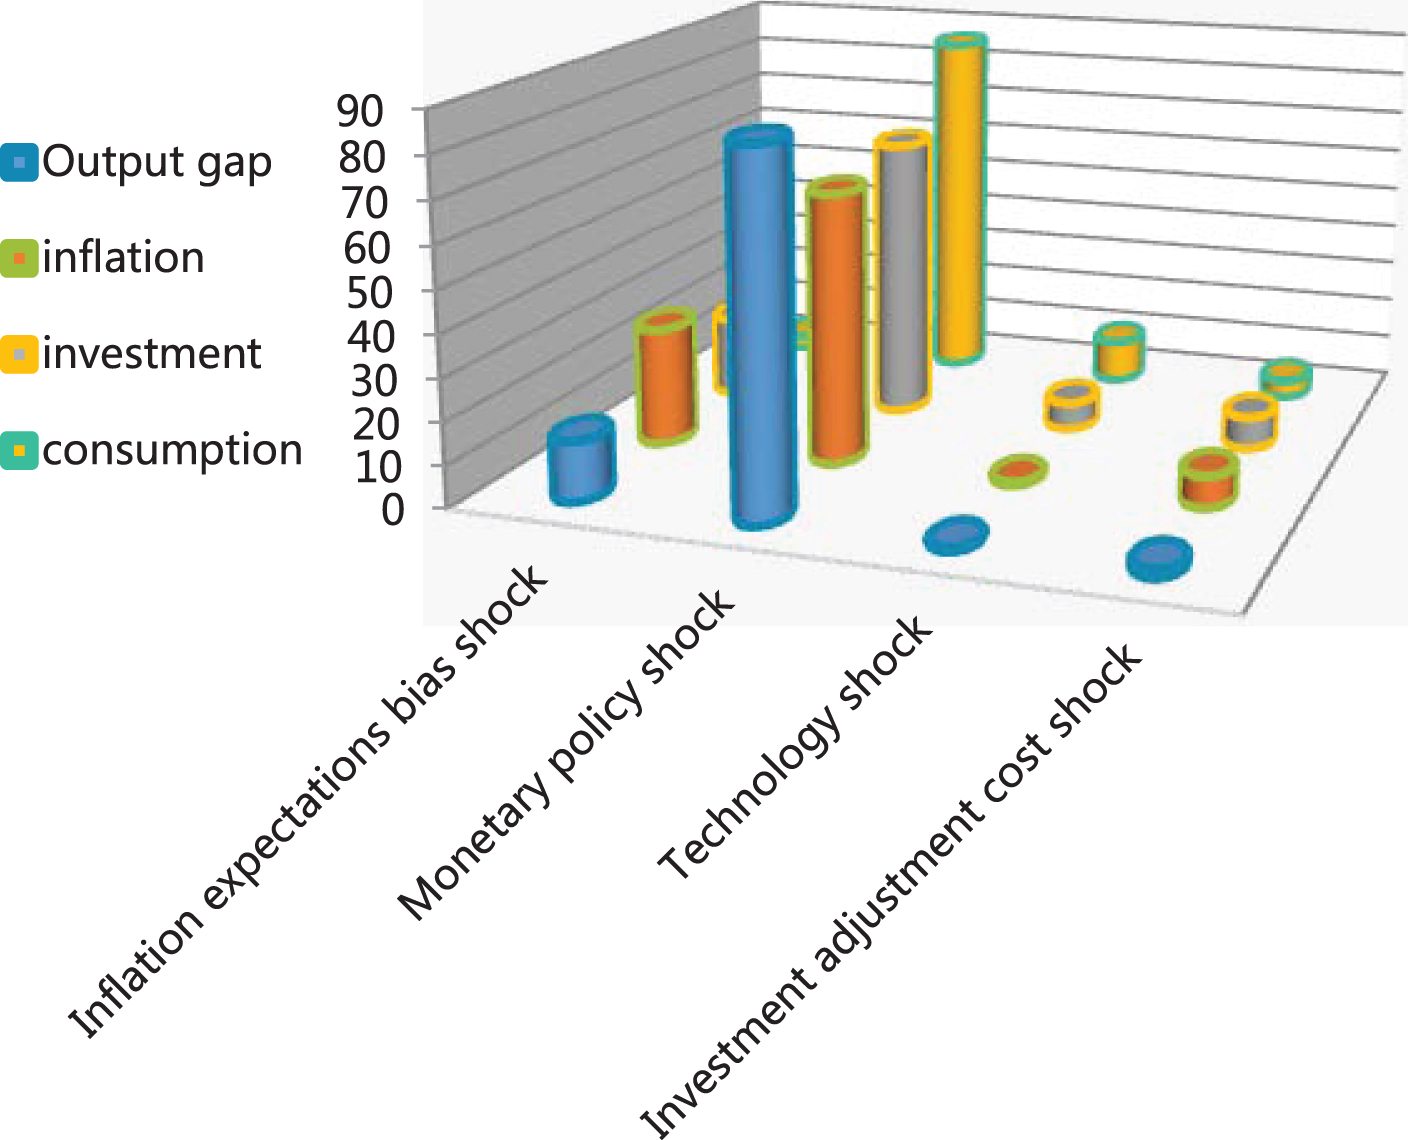
The forecast variance decomposition of the main macroeconomic variables during the economic boom (with the central bank communication).
For the management of inflation expectations, the guiding role played by traditional monetary policy tools is self-evident. However, this is not enough to guide the public’s inflation expectations in a timely and effective manner. The reason is that traditional monetary policy tools have a long-time lag in the transmission process. Therefore, it is necessary to explore the combination of tools with shorter time lag. Through the analysis of the machine learning model, this paper knows that regardless of the period of depression or prosperity, the central bank can effectively improve the control effectiveness of monetary policy by strengthening information communication with the market, which has strong practical significance in my country. At present, my country is in the process of monetary policy transition from quantity-based to price-based and is facing the dilemma that the effectiveness of quantity-based monetary policy has drastically declined while price-based monetary policy is not yet sound. Therefore, strengthening central bank communication can not only guide the public to make reasonable expectations of inflation, but also strengthen the effectiveness of monetary policy regulation. This paper believes that the central bank should strengthen the communication and explanation of the policy before and after the implementation of the monetary policy, so as to improve the effectiveness of the monetary policy.