
Abstract
In today’s society, graphic design, as a popular image processing technology, plays an increasingly important role in people’s lives. In the specific operation process of graphic design, It is no longer restricted to the traditional development mode, such as file format and other factors. With the development of computer network technology, people promote the development of graphic design by constructing color management system. At the same time, the construction of color management system can help people to change colors and define colors when they process image information and output pictures. In the process of printing pictures, in order to make the colors used in the design process clearly printed out and without color difference, there are still many problems to be considered. First, we need to consider the unexpected situation and the complexity of image processing. Based on the introduction of computer learning, this paper will discuss and study the development of graphic design by SVM theory.
Introduction
With the continuous progress of society and the continuous development of science and technology, people’s lives have also changed a lot. In people’s daily life, the rapid development of information technology has brought people a lot of new life experience. The proportion of computer network technology in social development is also increasing. People are gradually accustomed to the convenient life brought by computer network technology. Its development also changes the way and way of information dissemination. The development of digital technology restores the information accepted by people more truthfully and brings people visual information experience such as pictures, audio, animation and so on. With the further development of various technologies, people’s understanding of things has increased the way of photography. Through photography, people can record the food they see in real time. It is not only convenient to view later, but also an important memorial to the past. In addition, there is a need to beautify or process the photos taken by the camera, and the requirement of multimedia processing technology is higher and higher. Contemporary society is the era of information explosion, the requirements of information storage and dissemination have become lower and lower, and the number of pictures on the network is increasing, which has brought impact to the traditional retrieval and reading mode. The traditional form can no longer meet the needs of the development of the new era.
Since the day when science and technology formally entered people’s lives, people’s lives have changed completely different from traditional life, especially the prosperity of network technology brought by the development of computer technology. In order to find the information they want, people must use some retrieval tools. The feelings of the information contained in the picture and the information in the ordinary text are very different. Because of the influence of different factors, people tend to choose a special and effective retrieval tool to help them to obtain and receive information. According to the development of this kind of retrieval technology, this paper summarizes the previous research results, and analyzes the meaning of the image and the characteristics of its transmission of information. With the help of different computer algorithms to analyze image color, machine learning and SVM theory can be used to design color images.
Related work
Literature [1] articles mainly introduce the development of the system involved in the current research results from two angles: domestic and foreign, and introduce some problems in the development of the system. It shows people the various search engines and certain techniques that different types of systems need to use in organizing and structuring. Literature [2] in the actual operation process, according to the actual needs of the actual system, according to the specific requirements of the target audience to participate in a certain program and structure of the system to use the specific calculation method. Document [3] with the continuous popularization of computer network technology in people’s lives and the continuous development of digital technology, the changes of color image design are constantly emerging. Document [4] in the process of introducing the method of color application, it is easy to cause some misunderstandings. These wrong views caused by wrong understanding appear in the article will lead to people’s understanding of the use of color images in real life to guide the role and influence of distortion. Document [5] mainly reflects that in the process of color use, it is easy to use too many colors in the same layout, which will appear that the layout is more confused. In addition, many people refer to some wrong understanding, which leads to the use of color which only pursues and brings people greater sensory stimulation, and neglects people’s objective needs for real things. Combining the use of color with people’s emotional performance to explain the importance of color use, the main point of view put forward by relevant professionals in this paper is that the color used by people in images can also represent some of people’s emotions. But the influence of color on people’s emotion in images is mainly influenced by many internal and external factors. By comparing the method of calculating the emotion value of color by single linear regression equation and the method of analyzing color emotion model by correlation degree analysis, it is concluded that it is more appropriate and effective to use correlation degree analysis method to analyze color in image to master people’s emotion. This paper mainly introduces the main method of calculating emotion value in this process from the aspect of complete set of color. In the process of constructing color emotion calculation model, we can use the emotion embodied in color as the center. Then different computer computing methods are used to process the image. There are also some aspects about introducing the meaning of machine learning. The main content presented to people is, uh, the development of machine learning, and expounds the important stage of artificial intelligence development and research. The role of machine learning is very important. In the process of intelligent system development and people’s continuous exploration, image color analysis based on machine learning can bring more free space to people to a certain extent. In order to better understand the content of machine learning, we also refer to and learn from the literature [6] on machine learning classification, which can help us to grasp the focus of machine learning more accurately. Of all the literature [7] that have been read and used for reference, the most noteworthy is the description of the literature [8] on the calculation methods of realizing the final emotional analysis by studying different machine learning algorithms. Firstly, in the process of analysis, the effect of color image design based on machine learning and SVM theory is analyzed and discussed [9]. By drawing on these excellent literature [10], we can provide more powerful theoretical support for the writing of the article and provide better reference for the next research.
Misunderstanding of color application in design
Too much colour in layout
In the course of the development of newspapers, according to the changes of people’s needs, the design and development of color newspapers have gradually been welcomed and accepted by people. In the process of designing the color newspaper, if the color is not standardized and there is no rule on the whole, it will bring people a sense of disorder and no sense of appreciation [11–13]. When using pictures for information transmission, adding certain color elements can undoubtedly play a role in icing on the cake, because color has a strong impact on people’s vision. Appropriate color use can catch the reader’s eye in the first time, thus enhancing the aesthetic sense of the newspaper as a whole [14]. On the contrary, if in the process of newspaper design, some more prominent and bright colors are used too obviously, and the collocation is not in accordance with certain rules or according to people’s aesthetic adjustment, It will cause the whole newspaper to feel incongruous, which will not increase people’s interest in newspapers, but will make people feel vulgar and stimulate their eyeballs. In the process of designing a newspaper, if red and green are used to match two more conspicuous and bright colors, the use of color itself will be lost [15–17]. Although in essence, two bright colors together are more likely to attract the attention of most people, but the two colors are very conflicting. Therefore, in the process of use, we should pay attention to the collocation of color intensity, take into account the reader’s reading habits and aesthetic habits.
Excessive pursuit of sensory stimulation
In the process of design, many newspapers, in order to catch the reader’s eyeball in time, use some bright and obvious colors too much to stimulate the reader’s vision. In the long run, it will not only improve the aesthetic level of newspapers, but also bring aesthetic fatigue and long-term irritation of eyeballs [18]. The main purpose of adding color in the process of image processing is to enhance the beauty and appreciation of the picture, rather than blindly seeking to stimulate the reader’s eyeball and create and design. Our application and processing of color can not only stay on the level of understanding it as the pursuit of visual stimulation and impact, but also take it as a real artistic realm to be added to the process of image design and processing.
Excessive contrast and lack of main tone
In the process of newspaper layout design, if we only pay attention to the strong impact effect of color, we will blindly consider how to apply bright and bright colors in the process of typesetting. In the process of design, people should fully realize that the use of color is auxiliary to typesetting with content, It is to highlight the information and content in the newspaper layout, not to make people realize the color. In addition, in the process of design, we should pay attention to the collocation of the strong and weak effects of color. If we blindly use bright colors, we will also bring a lot of burden to the design of newspapers. So that people in the process of reading to avoid long-term visual fatigue, improve people’s interest in reading newspapers, see Fig. 1 for details.
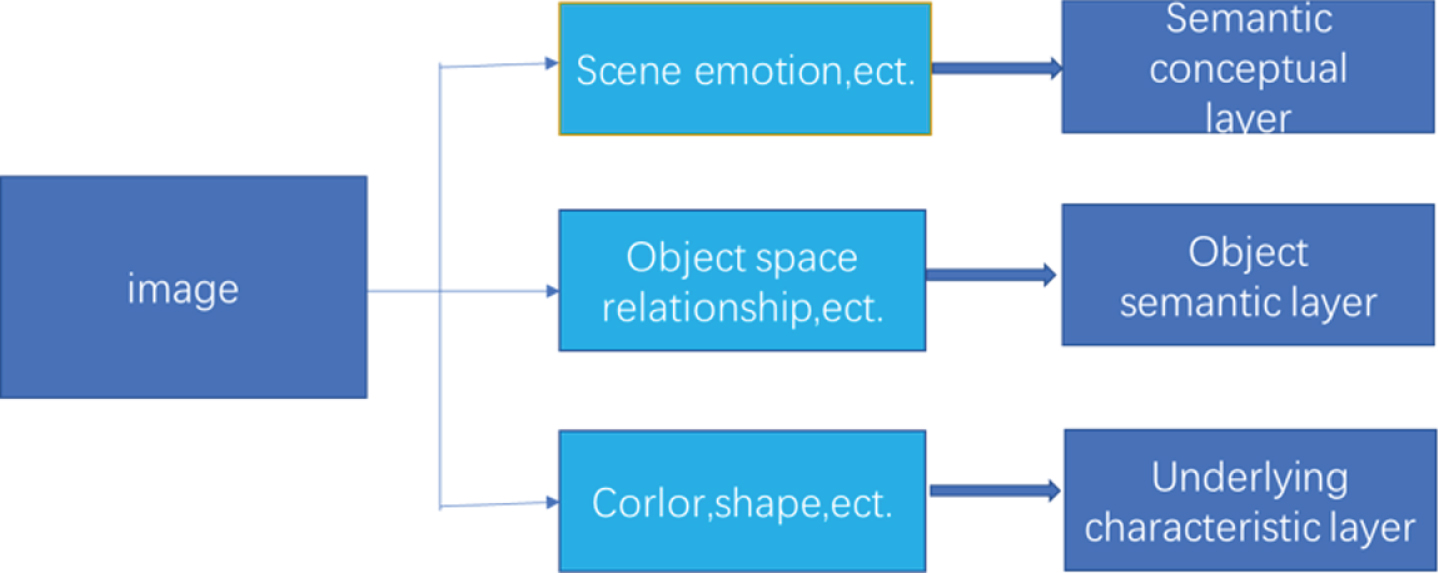
Image semantic hierarchy model.
By analyzing the concrete research results of many researchers on the use of color, it can be concluded that color emotion is calculated by the color characteristics at the bottom of the image contained in the image, but emotion is a more subjective thing for people. In the past process of color emotion calculation and research, people often use the method of single advanced regression equation to calculate emotion value [19, 20]. Through long-term practical research, It is too simple to eat the linear regression method of singularity and to express complex color emotion. By using the correlation analysis method to calculate the color emotion, it not only solves the limitation problem of the unitary regression equation, but also integrates the unitary emotion and the complex emotion in the process of its analysis. The emotional value of color emotion is calculated by certain method, which is used in graphic design. One of the important effects of image and color collocation. According to the long-term practice and research, there are three main aspects of the model that professionals sum up to calculate color emotion, one is the single color emotion model, the other is the color emotion calculation model which includes two multivariate and multi-factor correlation analysis, see Fig. 2 for details.

Example tables.
After calculating the value of color emotion, if we want to count a variety of color emotion, the main problem to be considered is that the existence of color space is generally multidimensional, not plane or stereoscopic [21, 22]. Therefore, most of the methods used in the analysis of data are the method of regression determination coefficient. Through the method of data analysis, the calculated value of color emotion can be counted and analyzed, and the image effect after color processing can be clearly seen, and a more objective evaluation can be made. According to the specific evaluation system, the determination coefficient of complex regression is generally expressed by R2, its range is between 0 and 1. If the value of R2 in the data analysis system is close to 1, then the trend of regression function is consistent with the trend of real data [23, 24]. It is found that the coefficient of determination of complex regression function can be used as a measure to evaluate the matching degree and suitability between color emotion model and color emotion sample, see Fig. 3 for details.
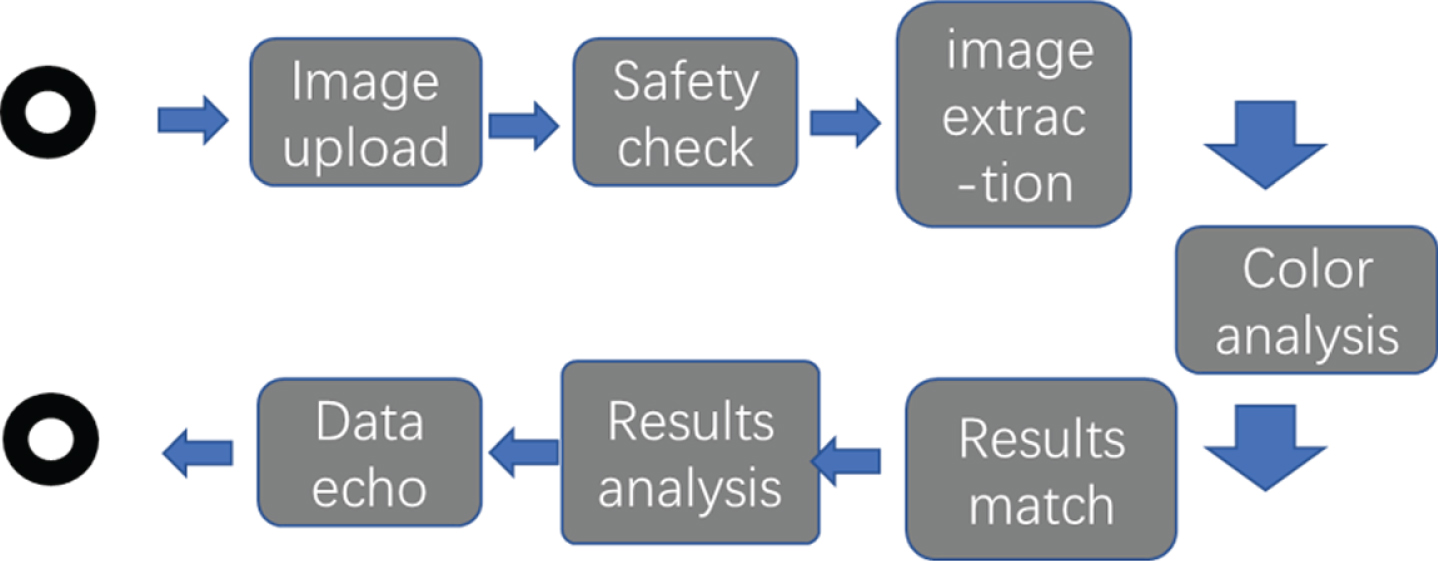
Image retrieval.
Based on the formula.
Valueformula
It can be seen from Tables 1 and 2 above. The color emotion values in each model are calculated, and the results are shown in the following Table 3. After obtaining the range of values, map it to the range of [2], such as formula 5.
Stao Models and composite regression functions
In-Cheng Models and composite regression functions
Combined value of color emotion for each model
According to people’s demand for color processing and image processing, people have constructed a color emotion system in the continuous development. This system belongs to a nonlinear system in essence. Therefore, the numerical value in this system is analyzed at the current research level, and there is no linear model that can match and match it. In the process of analyzing the corresponding color emotion values, it is very difficult to analyze one of the types of color emotion values linearly, so many models can be combined to analyze in the process of analysis. So that the data in the data analysis system has a general trend and trend, so as to provide some data support. In people’s practical activities, the most used model is about the enthusiasm of color use, color weight and color heat these three emotional components and factors to analyze the model. The common point of color emotion analysis using this type of model is that the value of positive and negative attributes is used to represent the value of color enthusiasm in the process of data system analysis. The range of color heat is measured by observing the warmth or cold feeling of color. In practical activities, people usually use mixed algorithm to make some color emotion values simple in data system. Linear combination, and according to the value in the color emotion table to specify the relevant decision coefficient, when the value of the decision coefficient reaches the lowest, the value reflected in the color emotion model is defined as noise. See Table 4 for details. The specific calculation formula is shown below.
Compound regression function of color emotion
Compound regression function of color emotion
If we want to calculate the color emotion in the true color image, we need to consider that this type of color image contains a variety of colors, and the color emotion calculation of the whole image needs to consider the specific situation of the color composition of the image from many aspects. In the process of calculation, it can be found that the color emotion contained in the true color image includes both unilateral color emotion model and complex color emotion model. According to the previous experience of color emotion calculation, for images including complex emotion models, different color emotion blocks can be divided according to different regional characteristics, and then these images can be segmented. In the process of calculation, the color emotion of different regional features is calculated, and their distribution and retrieval are defined according to the results. However, this method will decompose the image into multiple layers when dividing the region, and the division of multiple blocks will cause the final confusion in the calculation process. Make the original structure of the image layer more difficult to understand, and it is likely to fundamentally deviate from the author’s intention, will destroy the author’s concept of layer construction.
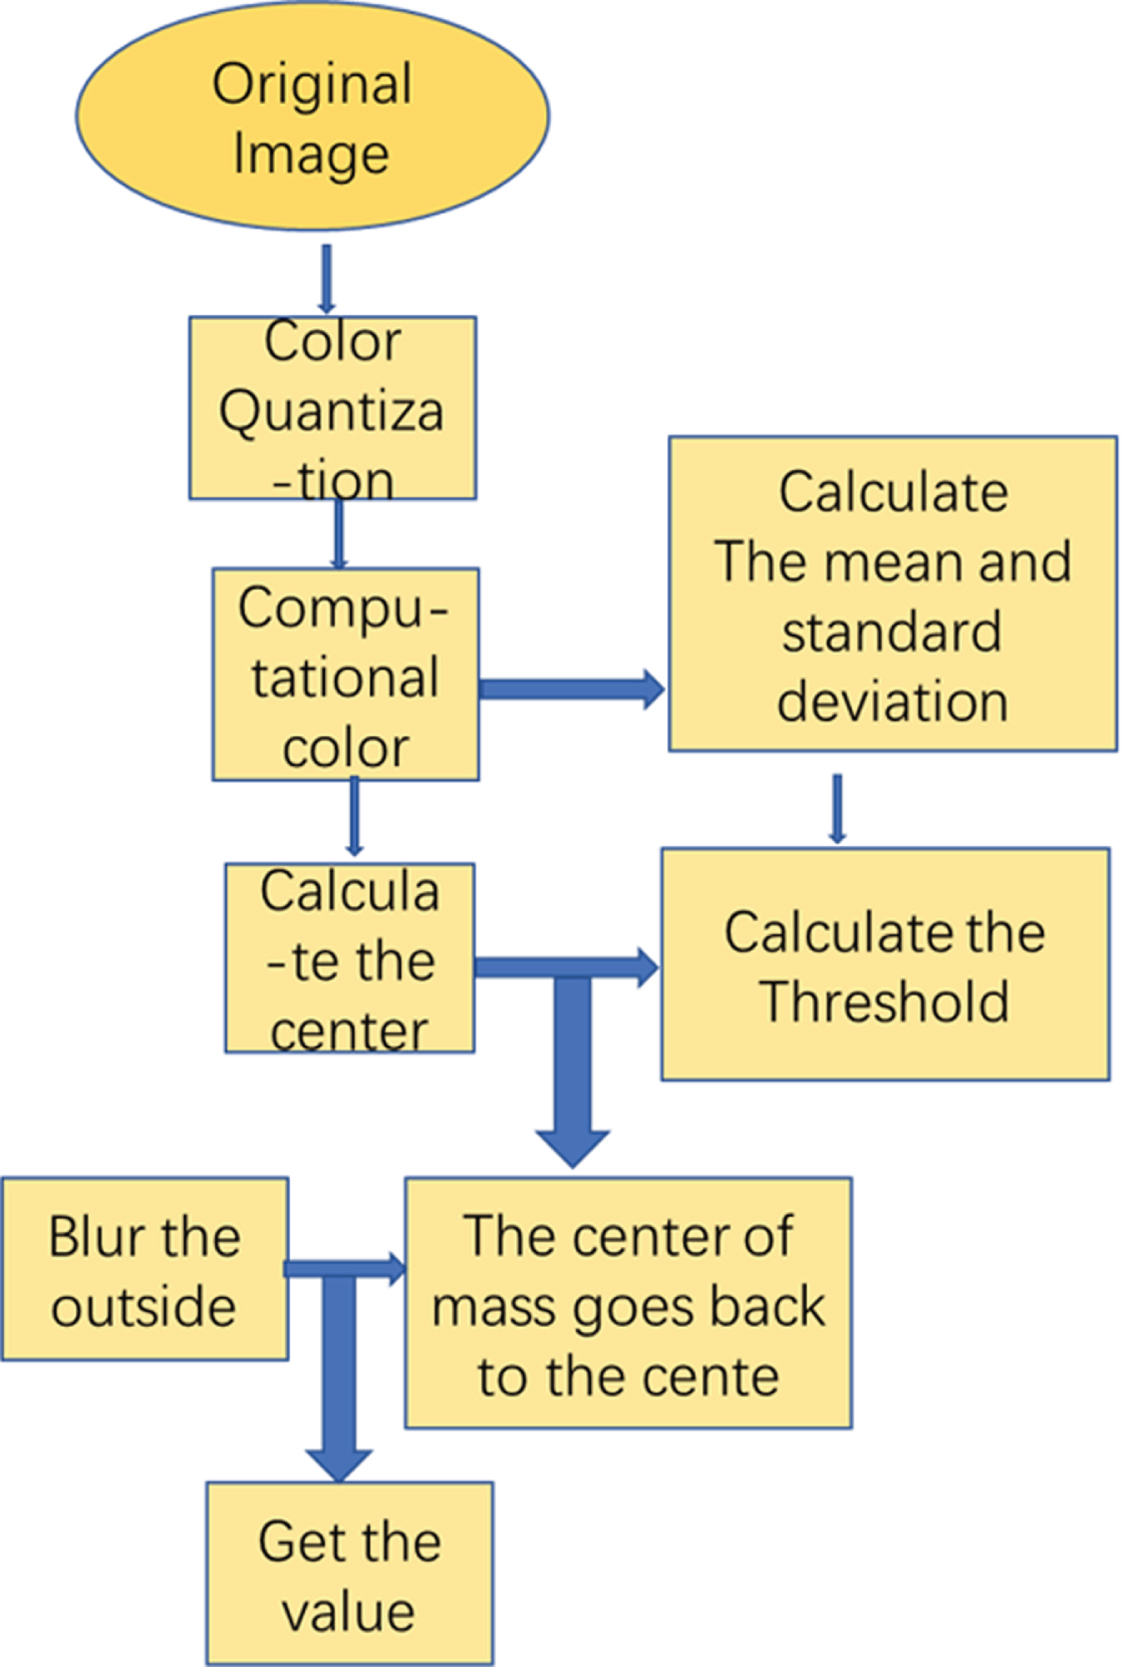
When calculating the global emotion contained in the image, we must first start from the human visual point of view, and consider the difference between the human visual effect and the machine visual effect. In the feature analysis of the global emotion contained in the image, the emotion of the image color can be taken as the center. On the one hand, the visual experience of people is fully considered, on the other hand, the description effect of the machine is improved, as shown in Fig. 4.
Algorithm flow.
In the process of artificial intelligence development and research, the understanding and research of machine learning is also very necessary. The reason for constructing artificial intelligence system is to save people’s time in some complex things and events, on the other hand, to improve people’s learning and application ability. This can better improve people’s learning ability and knowledge reserve. Through continuous research and construction of artificial intelligence systems, people are constantly improving their skills and knowledge, aiming at the current research results. On the basis of machine learning, the methods of image semantic classification mainly include supervised learning and unsupervised learning. The use of supervised learning methods is mainly used to classify the items to be learned in computer systems and to carry out them in an orderly manner. The supervised learning system set up by the machine learning system can include two parts: input and output. The part of unsupervised learning refers to some contents in the process of training and operation without artificial regulation and tagging. In cluster analysis, unsupervised learning algorithm is often used.
Naive bayes
In the process of calculation, to classify complex color emotions, Bayesian classifier is usually used. Its classification principle is mainly to use private calculation formula to calculate the probability of the appearance of a certain kind of color emotion. It can also be said that the probability of color emotion appearing in the general color emotion category or the probability that it needs to reach a certain condition. By multiplying the two probabilities calculated, the calculated results can be used to evaluate what category this type of color emotion belongs to in the total color emotion classification, and also to mark it by the size of the proportion. In order to achieve the purpose of convenient retrieval in the later stage.
K mean
This algorithm is a typical clustering algorithm for calculating distance in the algorithm system, that is, the calculated value can be used to judge the correlation and similarity between two different kinds of things. If the resulting values show a closer distance between them. Then they can be classified to some extent as a kind of thing. Through continuous calculation, there will be different clusters, each cluster of things close to each other, so can be classified as a category. Initial computing readiness Find the initial centers of multiple different categories from the data. Separation of samples by distance Through the calculation again and again, the data with close distance are put together, and the data with too big distance is removed. A new round of calculatio ns of the data in each new cluster, redefining the data centre. Repeat the second and third step, gradually reducing the distance from the data centre, and finally calculate that the cycle can be stopped without changing the distance.
In the process of calculation, it can be found that through round after round of calculation and elimination, the distance gap between the remaining data treatment is getting smaller and smaller, which also shows that the similarity between them is increasing. Until the last data in the same cluster after repeated calculation no numerical changes, indicating that these data have the same category of characteristics, which also achieved the effect of classification, see Fig. 5 for details.
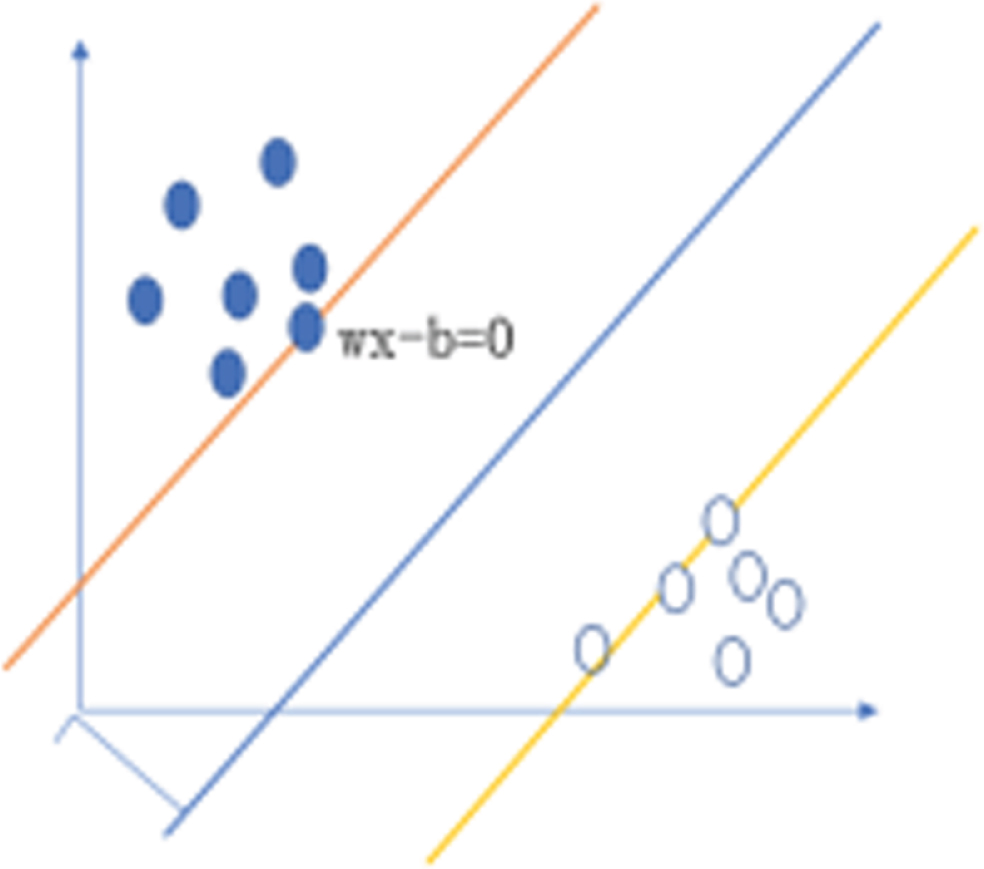
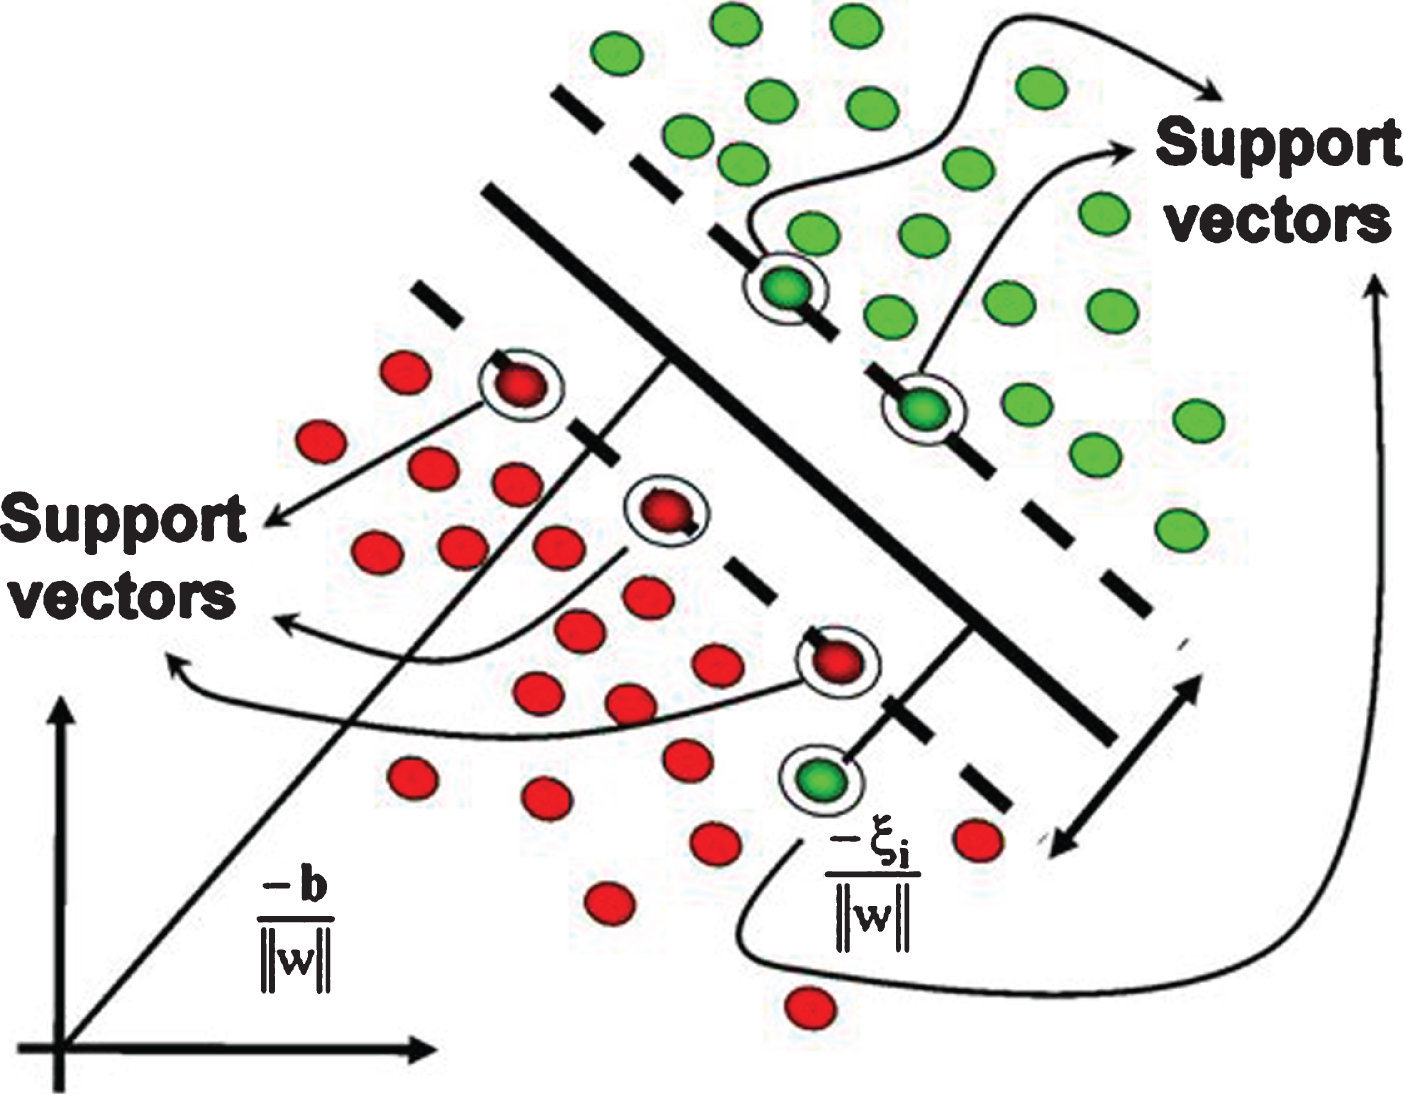
Support vector illustration.
Support vector machine principle
SVM classification method is a method that people summarize and develop through long-term practice and research. In data analysis and statistics, this classification method has deep and strong data system and theoretical support. Many questions and discussion criteria about data analysis are based on statistics, so the results of analysis and evaluation are more statistically significant. In the process of data analysis, because there are more data, especially when analyzing a large number of data, it is necessary to choose the classification method of risk and small error as far as possible to carry out statistics and analysis. This method solves people’s troubles to a great extent. In the process of emotion analysis, there will also be some cases that do not have complex emotion modules and can not be classified. This method can flexibly project the related data and model features that can not be classified into a higher dimension vector space, which makes the feature linear in the vector space with high dimension. By showing the linear characteristics in the high latitude space, a linear model can be constructed which can be analyzed in the data system, and the characteristics can also be presented according to the final model line model. The analysis of the model is carried out in a plane that can avoid more errors, so this method is closer to the need of people to analyze data.
Support vector machines
Linear classification surface
In the model constructed by this classification method, the function type used is linear kernel function, which is usually the default kernel function. This function is usually used to solve the data analysis of linear separability problem. This method solves the problem of data analysis, saves time, and is fast, and the results and final evaluation are more appropriate. After analyzing the data, Their classification can also play a better effect. These are the unique aspects and outstanding advantages of linear kernel functions in data analysis. In the normal process of data analysis, if it is a simple data function model, we can use more commonly used analytical methods. However, if some inseparable data models and some data with less obvious features are encountered, we must use the advantages of kernel function to analyze and disassemble it. Using kernel function to analyze complex data can save the time of analyzing data to a great extent and improve the effect of data analysis. The specific formula is shown below.
The formulas to be used in further calculations are as follows.
As can be seen from Fig. 6 above. When classifying the data, it is necessary to specify the features that can not be classified, so that they have the meaning of the function, and through observation and further calculation, the linear features of the function can be displayed concretely. This is more convenient for further analysis. The conditions for the data in the function to be satisfied are shown in the following formula:
Working principle of SVM.
The satisfaction of the samples obtained through continuous analysis is statistically significant to a certain extent. In order to carry out further statistical analysis, it is necessary to substitute the two samples into the corresponding formula for specific feature analysis.
To see if the condition of building the screen plane is satisfied, it is necessary to see whether the calculated range meets the numerical requirements of the plane construction.
In order to optimize the conditions of data, Lagrange function is used to further define the data.
Some of these letters represent specific provisions as follows.
Through step by step calculation steps and rigorous data requirements, the final surface construction function is as follows.
Only by satisfying the structure of the equation can the calculated quantity be summed.
Verify and analyze the calculated values to see if they can be classified in the same way.
After discussing the linear correlation classification problem, we should also consider the classification problem of nonlinear surfaces. The calculation function (7) can be changed into:
After the change, the calculation also becomes:
A support vector machine (SVM) calculation will bring a lot of convenience to the analysis, through the following formula, we can test whether the CHI statistics conform to the relevant regulations:
RBF formula of the kernel function is as follows.
As for the problems encountered in the classification of nonlinear data, it is usually put into higher space to analyze:
The requirements of the midpoint of the sample space are as follows, and the Lagrange function is used to construct:
k (x, y) Next, select the kernel function so that the function value satisfies the following formula:
With the continuous development of computer network and the popularization of computer network technology, the technology of image design has been greatly developed with the help of its development, and has been greatly improved for a period of time. With the support of machine learning and related classification methods in the future, color image design will be more stable. In the current development stage of color image design, we should pay more attention to the management of color, the specific content can be described from the following aspects:
Ensure that the display displays the correct color
In graphic design, the display of computer has a great influence on the effect of graphic design, so the quality of display is an important link in graphic design. The quality of display determines the degree of color processing in graphic design and the visual effect and aesthetic experience brought to people after image processing. In the process of image processing, whether it involves the use of color and the superposition of layers, it is necessary to ensure a clear calibration between the display and the operator of the graphic design. Only by ensuring that the er calibration degree of the display reaches a certain degree of accuracy can the use of color be guaranteed without deviation. To observe the color effect and degree of a display, you can observe it from the color preset file of the display.
Color preset files for installing correct input or output equipment
The color preset file in the display can be installed or specified when the permissions of the application are specified. The installed color preset file can be added to the normal operating system of the computer, and the color preset file loaded into the computer system will also appear in the corresponding image processing software selected by the computer operating system. Like some more perfect image processing software basically contain color preset files, can easily in the process of image processing color template.
Mastering the color management function of image processing software (taking CorelDRAW as an example); and
In graphic design, we should choose the image processing software suitable for ourselves. With the development of science and technology and the popularization of computer network technology, there are more and more image processing software, and their respective functions are much the same. In order to achieve better color application effect and image processing effect, we choose image processing software with complete functions and suitable operation habits.
Embed color preset files when saving or exporting files
Stored in the image processing document or added preset color options, you can export the image document, determine whether their color use is correct, and whether the visual effect is reasonable. In the process of image processing, it is necessary to save or export the processed documents, and the corresponding buttons in the image processing software can convert a certain format.
The “soft-modification” feature that previews the final image on the display
Many image processing software finally export and save a lot of file format types, according to different uses, users can choose different ways of saving and format. After mastering the use function of the more perfect image processing software, we can ensure that we are more focused on the use of color and image processing in the process of graphic design.
Conclusion
Through the characteristics of the current computer development and the characteristics of network technology, images and words are combined to provide people with a better visual experience, which in a sense changes the complex carriers that traditional text communication needs to use. And changed people’s reading habits of text information. Through the combination of image processing and text, it brings more good visual impact and aesthetic effect to most people reading, which makes people enjoy the product of the development of the new era under the background of the development of the new era. In the process of further development, color, as a tool for matching and combining auxiliary words and images, should not deprive the main position of text and pictures too much in the process of use. The use of color can not only improve the readability of pictures and characters, but also enhance the aesthetic realm of overall text and picture typesetting.
In this paper, the application of color and image processing are explained by examples and explanations of computer algorithms and some classification methods. At the same time, it also provides a better reference for the future image processing and color application development. Hope that in the future development process can have more color use and image processing show to meet people’s needs.
Footnotes
Acknowledgments
This research was supported by a grant from the Department of Education in 2020 of Guangdong Province “The study of cross-media color reproduction system based on HDRI multi-spectral technology” (NO:6020210017K).