
Abstract
Supply chain financial risk control has become the biggest obstacle restricting financial institutions from developing supply chain financial services. If financial institutions want to make a difference in the supply chain finance business, they need to implement strong control measures against supply chain finance risks. Based on the research of supply chain finance and risk related theories, this paper uses fuzzy preference relations and selects the main risk criteria to construct a risk evaluation index system. Moreover, this paper takes the development of J company’s supply chain finance business as a background to conduct an empirical analysis and proposes the risk management measures and development strategies of J company’s actual supply chain finance business. The combination of quantitative analysis and qualitative evaluation is more comprehensive and operational value for the research and management of supply chain financial risks. In addition, this paper uses the evaluation index system constructed in this paper to conduct a more comprehensive summary and analysis of the internal and external environment of risk influencing factors. The research results show that the performance of the model constructed in this paper is good.
Introduction
Since the economic and social generation of financial activities such as investment and financing, the development of the financial industry has been accompanied by financial risks. Financial risk is a necessary constraint for economic and financial entities to participate in investment and financing activities, and has a certain regulatory effect on optimizing resource allocation. However, when risk management fails, financial risks often have great destructive effects on the economy and society, and cause turbulence in the economic and financial system, and even induce economic and political crises. With the continuous changes in the financial environment, the continuous evolution of financial innovation, and the increasing trend of financial globalization, financial risk management has become increasingly complex and important. From a qualitative point of view, how can a single financial institution optimize its internal risk prevention and control mechanism to prevent the occurrence of extreme risks? From a quantitative point of view, how to introduce mature theories from other disciplines into the field of financial risk management so as to develop new risk measurement tools that are more in line with real financial markets? The research on these issues has important theoretical and practical significance. Since the late 1970s, due to the continuous changes in the global political and economic structure, the financial service industry of various countries has also undergone revolutionary changes. In the context of global economic integration, countries in the world, especially Western developed countries have loosened financial controls, and financial liberalization has become increasingly high. At the same time, in order to prevent financial risks and evade government regulation to enhance the competitiveness of enterprises, various financial innovation activities have emerged one after another. With the interconnection of the capital market and the vigorous development of asset securitization, the financial risks faced by financial institutions have become increasingly complex, and the research and practice of financial risk management also need to keep pace with the times [1].
My country’s deregulation of the financial industry has experienced a gradual process. After the reform and opening up to the early 1990s, financial repression was partially alleviated by establishing market competition entities and breaking the business boundaries between professional banks. In the mid-1990s, a controlled floating exchange rate system was gradually implemented. With the advancement of trade liberalization and investment liberalization after China’s accession to the WTO, the pace of opening up of my country’s financial industry is also accelerating. The relaxation or deregulation of these regulatory policies will help the development of the financial industry, but the resulting financial risks cannot be ignored [2].
Financial risk management is becoming increasingly complex and important. Financial innovation has provided development momentum for the real economy and improved the efficiency of the financial market, but it has prolonged the credit chain and greatly increased the risk level of market participants and the financial system. Moreover, the liberalized business environment puts forward higher requirements on the risk management level of investors and regulatory authorities. In addition, the development of financial innovation and asset securitization has magnified the leverage level of the financial system, and has complicated the relationship between various financial institutions. For example, asset securitization can optimize the asset structure of financial institutions and reduce liquidity risks. On the other hand, when we invest in the securities, we not only need to bear market risks, but also need to pay attention to the possible credit risks of the assets behind the securities. If we lack a comprehensive information disclosure system and risk management methods, it will cause financial market turmoil. At the same time, the development of financial derivative products provides a good risk hedging tool for risk management in the spot market. However, financial derivatives themselves have great risks, and their highly leveraged trading methods cause losses to be multiplied, which can easily induce market risks [3].
Related work
Linear correlation measures of financial institutions mainly include two types: mean correlation and variance correlation. Mean correlation mainly examines the risk spillover effects between financial institutions from the perspective of the rate of return, and its core idea is to examine the lead-lag relationship between the returns of the two markets. The literature [4] put forward “stock-oriented models” (stock-oriented models) when studying the correlation between stock market and exchange rate market. Through income-risk analysis, they believed that the imbalance of the stock market has an impact on the exchange rate, and the exchange rate market is the key factor for the stock market to restore equilibrium, so there is a strong correlation between the two. The literature [5] used the VAR model to study the stock markets in Japan, the United States and Malaysia and found that the Malaysian stock market, the Japanese stock market and the American stock market showed a trend of convergence, and the Japanese stock market had a greater impact on the Malaysian stock market. The literature [6] used the exchange rate after my country’s exchange rate reform and the time series data of the Shanghai Stock Exchange Index for cointegration test and VECM analysis. The results of the study found that there is a reverse relationship between the stock market and the exchange rate market in my country after the exchange rate reform, and the foreign exchange market is the one-way Granger reason for the stock market. The literature [7] used Granger causality test to test the causal relationship between the US stock market and the stock markets of 15 emerging countries, and found that the US stock market is the Granger cause of other emerging markets, and the performance of the Chinese market is particularly obvious. Because conditional variance contains a lot of market information, it is biased to only examine the correlation between the averages of the markets. Therefore, the focus of the research has changed from mean correlation to variance correlation. Generally, the correlation of conditional variance is characterized by establishing GARCH-type models or SV-type models, and its essence is to investigate the transmission direction of market volatility. The literature [8] studied the volatility correlation between the US, UK, and Japan stock markets based on the ARCH model, and found that the US stock market has a volatility spillover effect on the Japanese stock market, but the reverse volatility spillover is not obvious. The literature [9] first investigated the correlation between the stock market and the exchange rate market from the perspective of market condition variance. Meanwhile, the literature studied the markets of six industrialized countries, the United States, the United Kingdom, Germany, France, Japan, and Canada, and found that except for Germany, other countries have a one-way spillover effect of volatility. Aiming at the shortcomings of the difficulty in estimating the variance-covariance matrix of the multi-market volatility model in previous studies, the literature [10] proposed a simple multivariate volatility model, which has become the mainstream model for studying volatility spillovers between markets. When studying the risk spillover between the futures market and the spot market, the literature [11] believed that although the multivariate volatility model describes the volatility spillover between markets with a simple time-varying correlation coefficient, it cannot reflect the asymmetry of this spillover effect. After that, the literature solved this problem by establishing an asymmetric multivariate volatility model (ADDC-GARCH). The literature [12] extended the Granger causality test of the first and second moments to the risk Granger causality test, and initially discussed the risk spillover effects of higher-order moments, and theoretically explained that the volatility spillover is the Granger causality of the conditional variance. Literature [13] tested the volatility spillover effect of emerging markets based on the multivariate GARCH-M model, and found that there is a strong volatility spillover between the stock markets of these countries, and this volatility spillover presents two-way characteristics. Literature [14] constructed a multivariate GARCHSK model based on the GARCHSK model with conditional skewness and conditional kurtosis, and found that the introduction of time-varying skewness can improve the measurement effect of fluctuation spillover.
The asymmetry of financial assets and the characteristics of obvious peak and fat tail make the correlation between assets show complex nonlinear characteristics. The traditional linear correlation measure can no longer describe this correlation well. Based on this, the Copula function proposed in the literature [15] was introduced into financial risk management. The literature [16] believed that the Copula function has the advantages of flexible edge distribution selection and more robust estimation of nonlinear relationships, and can effectively capture the characteristics of financial time series such as obvious peak and fat tail and nonlinear correlation. The literature [17] earlier introduced the important role of Copula function in measuring correlation, and compared the advantages and disadvantages of linear correlation coefficient, rank correlation, and tail correlation based on Copula function, and believed that Copula has an important role in risk management. The literature [18] used Copula to measure the correlation between assets, and on this basis, calculates the overall risk measurement VaR of the asset portfolio. The literature [19] proposed a comprehensive risk measurement for banks, used Copula function to jointly model the market risk, credit risk and operational risk faced by banks, and analyzed the calculation of comprehensive risk value. In view of the shortcoming that the correlation described by the traditional Copula function cannot reflect the time-varying characteristics of the correlation between assets, the literature [20] proposed a time-varying Copula function with variable coefficients. By comparing with the traditional Copula function, it was found that the time-varying Copula function can accurately measure the dynamic relationship between assets. The literature [21] introduced the Markov state transition mechanism into the Copula model, and empirically studied the tail correlation between Brazil and other four emerging markets and the two developed markets in the United States and Britain. The results show that emerging markets and developed markets have shown a strong correlation during the crisis, and the magnitude of this correlation depends on the external economic environment. The literature [22] embedded the GARCH model into the marginal distribution, and estimated the parameters of Copula through non-parametric methods, thereby establishing a semi-parametric time-varying Copula-GARCH model and analyzing the effectiveness of the model. The literature [23] used the t distribution as the marginal distribution to establish a conditional Copula-GARCH model, and proposed the risk value of a binary portfolio.
Fuzzy set theory
Fuzzy theory is used to solve the problem of the lack of accuracy in the rating of evaluation criteria and the lack of accuracy in assigning criteria importance weights. In fuzzy theory, the value of an element is determined by the fuzzy set of components in the range of 0 to 1 (neither 0 nor 1). Fuzzy theory has been extended to develop multi-criteria decision making methodology. Because humans use various logics and make decisions based on logic when processing thinking work, logical and multi-value methods need to be constructed and developed. The purpose of fuzzy theory is to transform the linguistic variables in the decision-making process into numerical variables. Some basic concepts of fuzzy sets are as follows:
We use X to represent a set (space), and the elements belonging to X are represented by x, that is to say, X ={ x }. Therefore, the fuzzy set can be defined as the following formula:
Among them, μ A : X → [0, 1] is the membership function of fuzzy set A, and μ A (x) ∈ [0, 1] is the membership degree of element x to set A.
We represent the triangular fuzzy number as a set
From the above equations of fuzzy sets and triangular fuzzy numbers, it can be concluded that fuzzy sets and related triangular fuzzy numbers are expressed by their membership functions in the range of [0, 1]. In the actual application process, it is suitable for solving multi-objective decision-making problems under uncertain conditions.
This paper uses triangular fuzzy numbers to study the sorting method of fuzzy approximation to ideal solutions. The reason is that this method allows decision makers to use and calculate very intuitively and easily. In practical applications, triangular membership functions are usually used to represent fuzzy numbers. From the above concise summary of fuzzy theory, the main steps of the ordering method for fuzzy approximation to ideal solutions can be summarized as follows.
Step 1: The standardized decision matrix is calculated. The standardized value r
ij
is calculated as follows:
Step 2: The weighted standardized decision matrix is calculated. The weighted standardized value v
ij
is calculated as follows:
w
j
is the j
th
criterion or weight of attribution, and there is
Step 3: The positive ideal solution
Step 4: Euclidean distance of m dimension is used to calculate the layer group interval. The layer group interval of the positive ideal solution and negative ideal solution of each scheme is as follows:
Step 5: The relative intimacy of the positive and negative ideal solutions is calculated
Step 6: The preference order is arranged. The solution with the largest CC i or CC i with all the solutions in descending order is selected.
In decision-making problems, guidelines can be seen as a source of information. The importance weight of a criterion can affect the amount of information contained in each criterion, and this weight is called objective weight. The Criteria Importance Method (CRITIC) through the correlation between criteria is a method for determining objective weights in multi-criteria decision-making problems The weight obtained by this method includes not only the contrast strength of each criterion, but also the conflict between the criteria. The contrast strength of the criteria is regarded as the standard deviation, and the conflict between the criteria is judged by the intimacy of association. In this paper, the CRITIC method is extended to the fuzzy environment. It is assumed that
Step 1: The performance conversion value is calculated and the standard weight is obtained as follows:
Step 2: The standard deviation σ jk of each phasor X jk is calculated.
Step 3: Four m × m dimensions are constructed, generally a symmetric matrix of element
Step 4: The information layer group for each criterion is calculated:
Step 5: The unranked objective weights are determined as follows:
Step 6: The following formula is used to determine the fuzzy criterion weight:
Among the many methods to deal with multi-objective decision-making problems, it is very popular to use the TOPSIS method to deal with the problems of various application fields in real life. Based on the above TOPSIS method and CRITIC method, the two are combined for research. It is assumed that you have a set (A = { A1, A2, ⋯ , A n }) containing n plans, a set (C = { C1, C2, ⋯ , C m }) of m criteria, and (D = { D1, D2, ⋯ , D k }) of k decision makers. The following are the specific steps of this combined method.
Step 1: The average decision matrix (x) is constructed:
Among them,
The corresponding criterion c
j
(1 ⩽ j ⩽ m) is made by the decision maker of P
th
and (1 ⩽ p ⩽ k), and the performance value of plan A
i
(1 ⩽ i ⩽ n) is represented by
Step 2: The subjective criterion weight matrix is constructed as follows:
Among them,
The objective weight of criterion c
j
(1 ⩽ j ⩽ m) is determined by P
th
decision-makers and (1 ⩽ p ⩽ k) is denoted by
Step 3: The standardized subjective weight of each criterion is calculated:
Step 4: The previously described fuzzy CRITIC method is used to determine the objective weight of the standard.
Step 5: The weights are calculated by integrating standardized subjective weights and objective weights:
Step 6: The standardized fuzzy decision matrix is calculated:
Among them,
Step 7: The standardized fuzzy decision matrix is weighted:
Step 8: Fuzzy negative ideal value (FNIS) and fuzzy positive ideal value (FPIS) are calculated by the following formula:
Among them,
Step 9: The distance from the fuzzy negative ideal value (FNIS) to the fuzzy positive ideal value (FPIS) of each scheme is calculated:
Step 10: The relative intimacy of each project is calculated and arranged in descending order:
This paper takes J company as an example for analysis. The factors that contribute to the success of supply chain finance business of J company mainly include the following two aspects. First of all, the development of J company finance business originated from the J company group, and it has close communication with small and medium enterprises, and is well aware of the existence of financing difficulties for small and medium enterprises. Therefore, the supply chain financial business created by it has a good customer base. Secondly, the development of its supply chain finance business is based on the transaction data of J company mall suppliers and merchants, and the logistics data of J company’s logistics platform. Therefore, J company can efficiently obtain the data and information of the financing applicants and carry out strict risk control on this basis. J company finance platform was reorganized from the J company Group in 2017 and became an independent individual company. The development model of its supply chain finance is shown in Fig. 1.
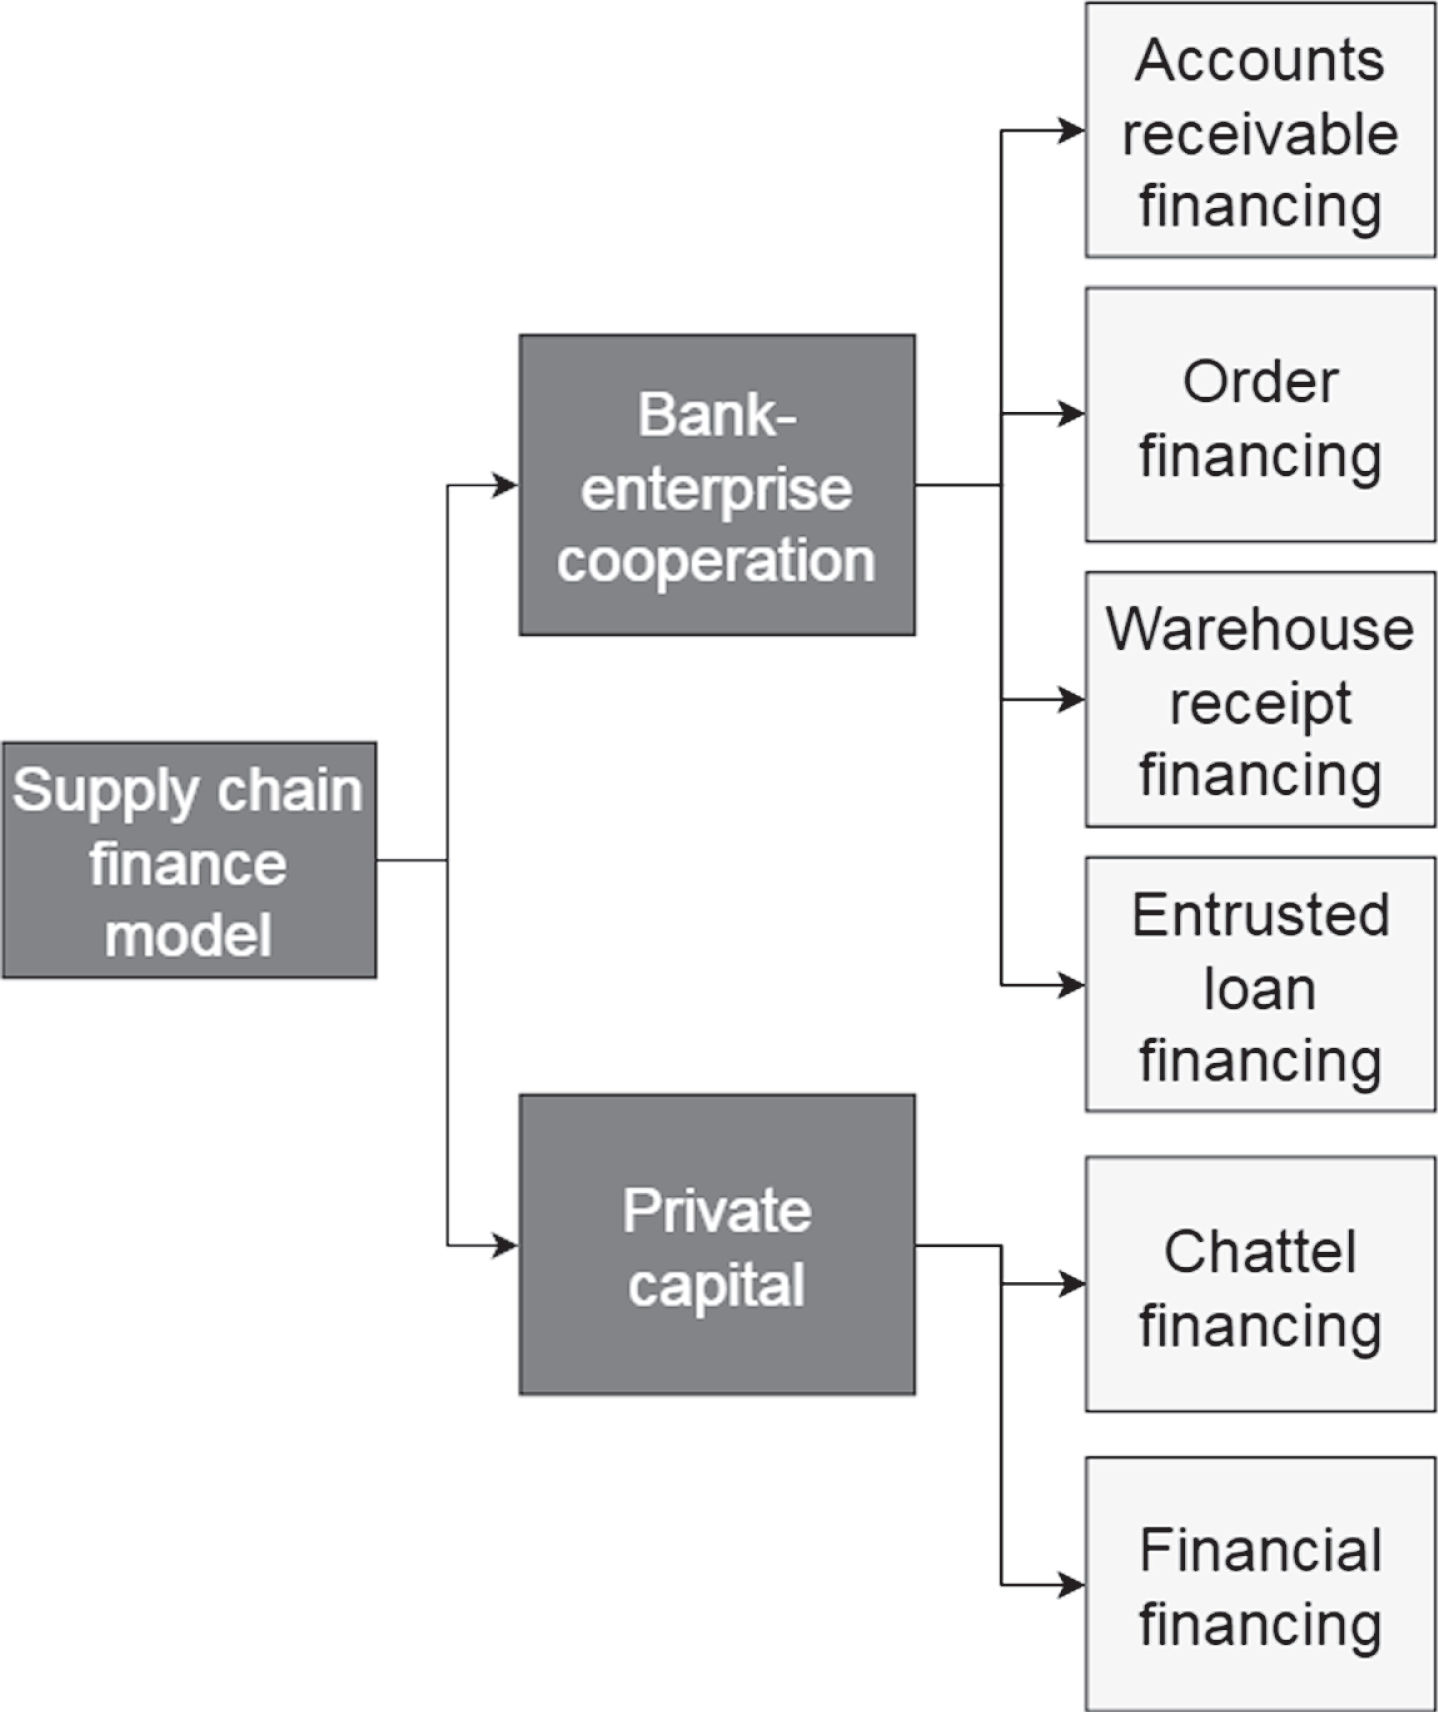
Supply chain finance development model.
As a new factoring service of supply chain finance, financial loans mainly provide J company suppliers and customers who cannot meet the bank’s financing standards with loan services that can choose and adjust the financing time limit by themselves. The main loan modes are divided into accounts receivable mode and order (account receivable in the future) mode. The two modes are essentially the same. When repayment, the enterprise can choose J company finance platform to directly deduct the principal and interest of the loan from the accounts receivable paid to the enterprise by the J company mall, or the J company mall directly pays the enterprise accounts receivable, and the enterprise itself formulates the repayment plan. The specific process is as follows:
1. J company mall signs a transaction agreement with the supplier, and there is a transaction basis between the two companies. 2. The supplier has a stable trade relationship with the J company platform and requires a good credit record. 3. The applicant submits a financing application to J company finance platform and submits the application materials. 4. J company mall submits the transaction information with the supplier to J company finance platform. 5. J company finance platform signs financing contracts with suppliers based on the approval data of past transaction scale credit and other data. 6. J company finance platform determines the loan amount. 7. J company finance platform releases financing funds to suppliers. 8. The customer chooses the repayment mode, and can repay the principal and interest with the accounts receivable payable by J company mall. The flowchart can be represented as Fig. 2.
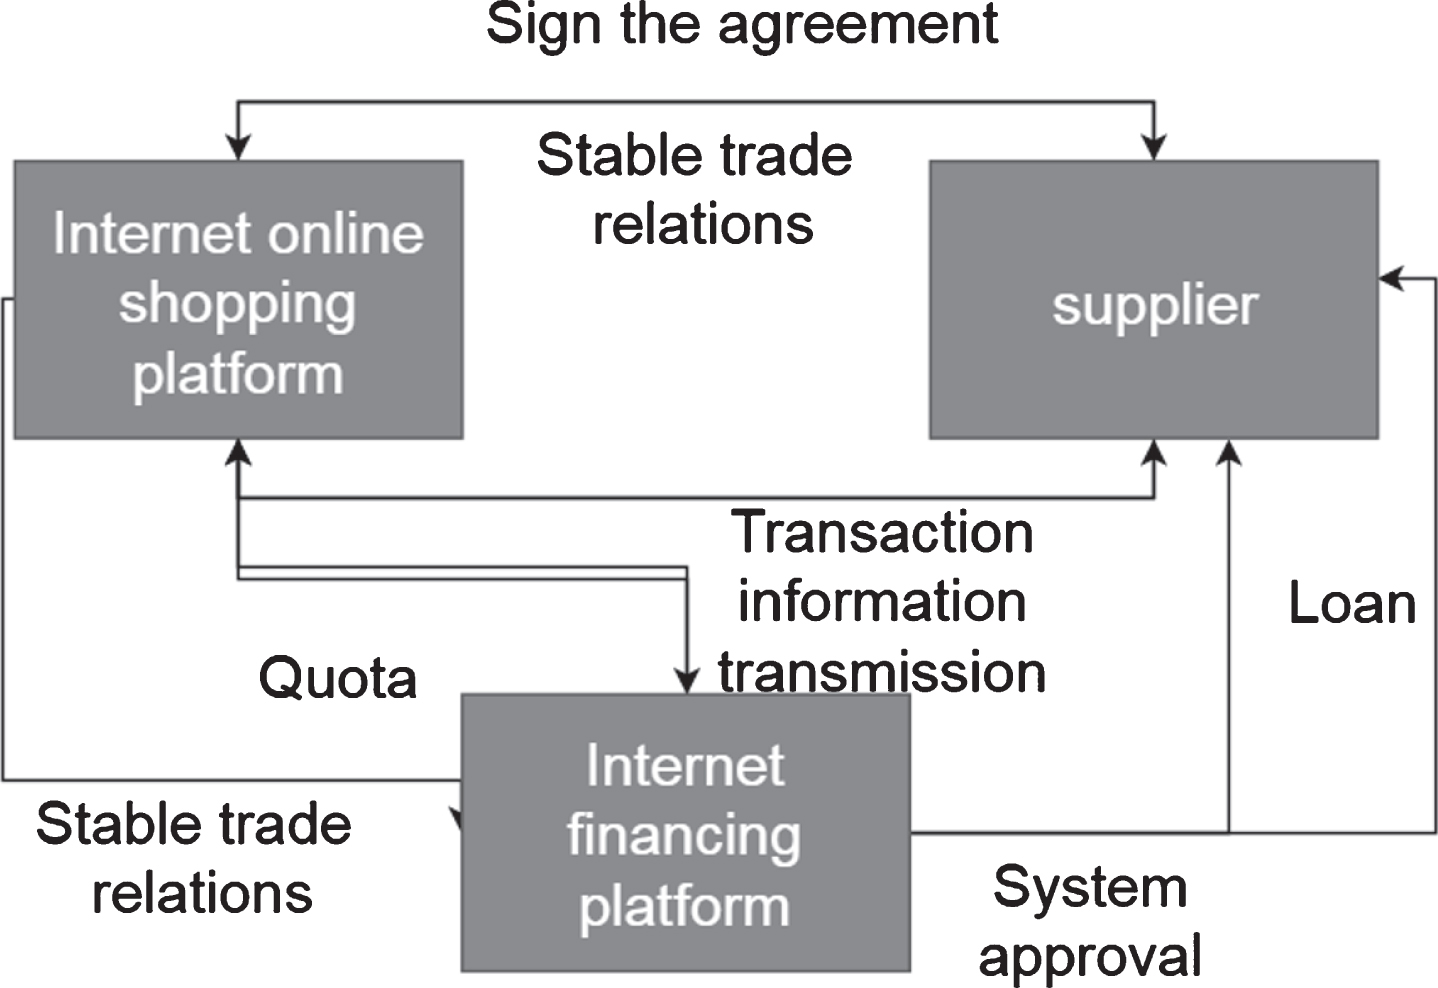
Financial loan process.
J company’s movable property financing adopts the movable property pledge financing model, which requires collateralized goods to facilitate accounting, management, and valuation compared to traditional financing. Based on this situation, it is difficult for SMEs to meet the threshold of the movable property mortgage financing method, and it is difficult to raise financing. On the other hand, even if a small number of small and medium-sized enterprises own goods, they still have the problem of insufficient quantity of goods, which makes it difficult to evaluate the value. At the same time, it increases the cost of the financing platform for the supervision of pledged goods, and the liquidity of goods is also greatly restricted, which greatly damages the pledge value of assets. The financing model of J company finance platform utilizes the data and modeling of J company’s financial system to control goods and release the liquidity of collateral. This kind of problem is solved to a great extent. At the same time, in terms of risk control, J company finance platform can obtain detailed data on pledges through cooperation with J company’s logistics platform. Under the data-based management method, it can effectively resolve the risks of data fraud on pledges. The specific process of the financing model is as follows:
1. Merchants store movable properties in J company logistics, or a warehousing logistics platform cooperating with J company and establish a warehousing partnership with J company. 2. Merchants propose financing wishes on the J company platform. 3. J company finance platform verifies the warehousing information of the financing enterprise with the J company mall logistics platform or the warehouse logistics enterprise. 4. J company finance platform evaluates storage materials. 5. Merchants submit application materials online after review and approval. 6. Merchants authorize the transfer of movable property rights through J company wallet. 7. Merchants and J company finance platform signed a movable property financing agreement. 8. J company finance platform delivers the financing funds to merchants. 9. Before the expiration, the financing company conducts the repayment operation through the J company wallet (in the whole process, J company finance platform pledges the movable property in real time). The specific process is shown in Fig. 3:
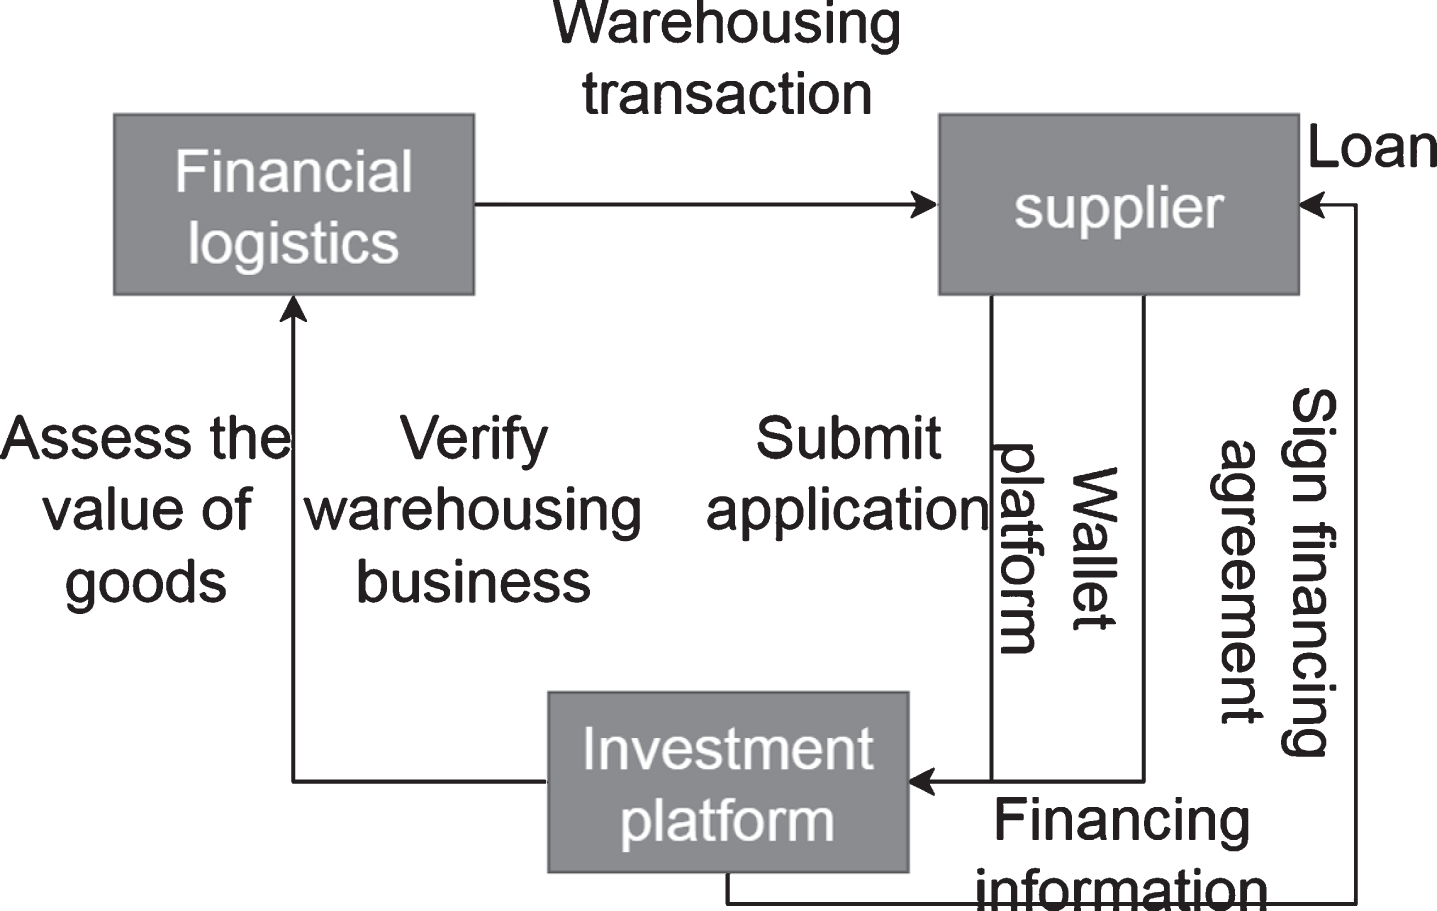
Process of financing model.
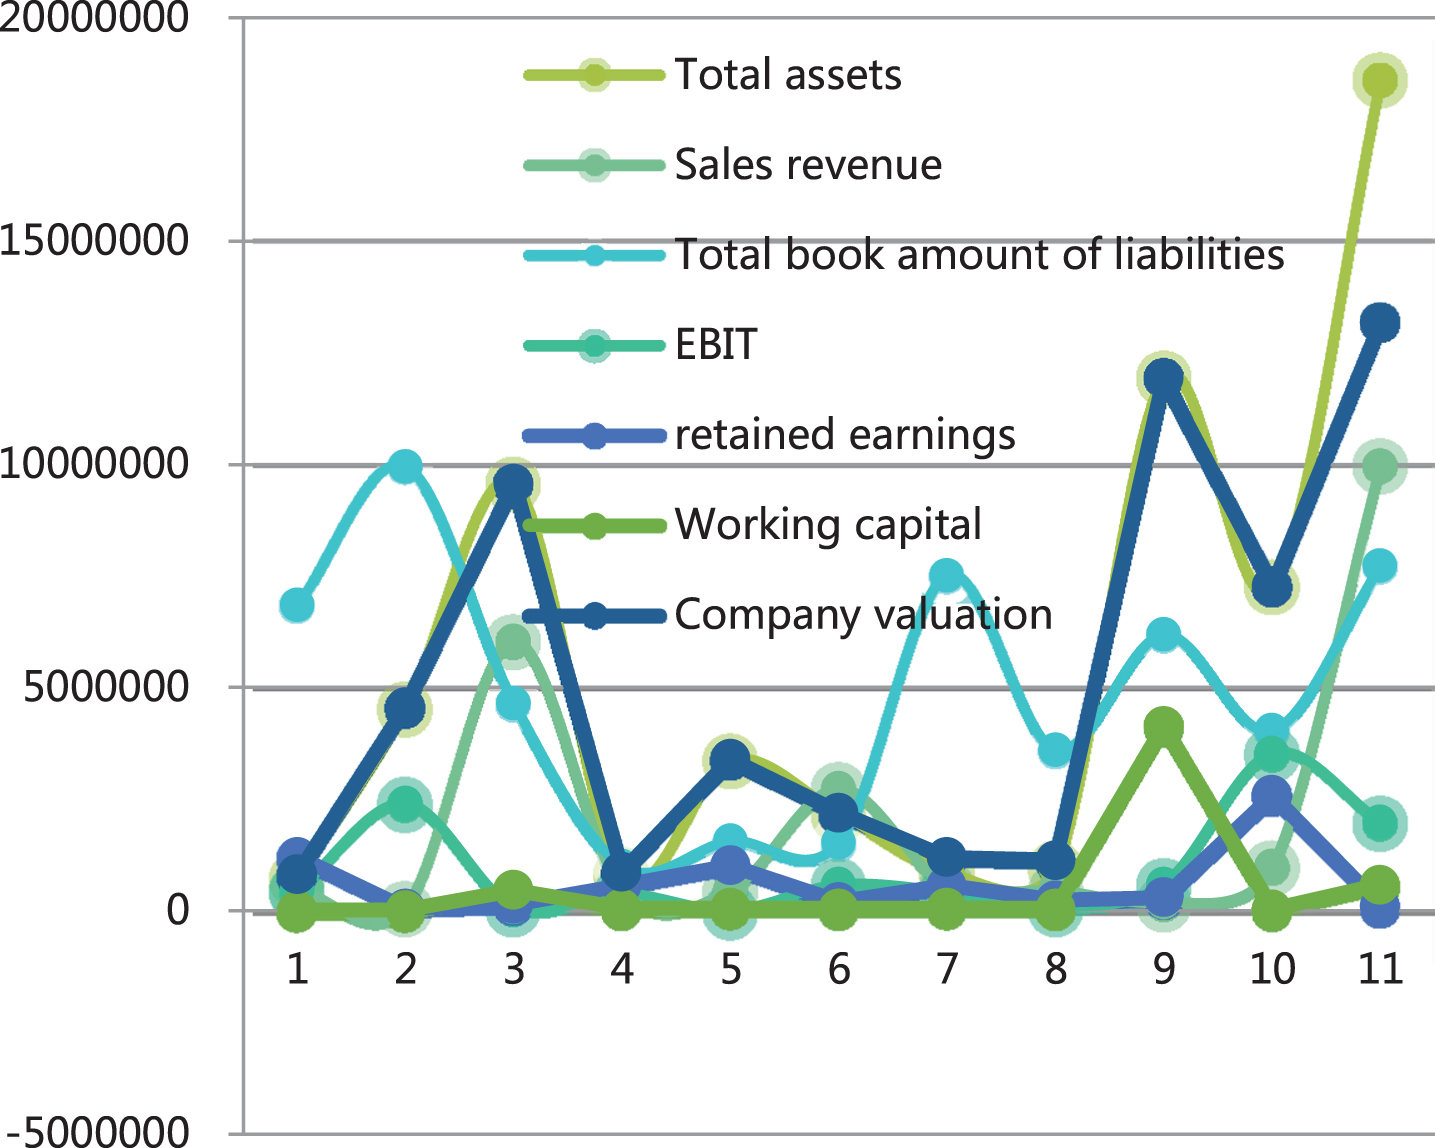
z-score data analysis diagram of J company financial supplier applicants.
This paper intends to use the Z-score model to analyze and evaluate its supplier’s financial data, and further obtain its credit rating. The Z-score model mainly includes five financial indicators: X1 = current assets/current liabilities, X2 = retained earnings/total assets, X3 = earnings before interest and taxes/total assets, X4 = market value of stocks/total book value of liabilities, X5 = sales income/total assets. Z = 1.2(X1)+1.4(X2)+3.3(X3)+0.6(X4)+0.999(X5). The z-score data analysis table of J company financial supplier applicants is shown in Table 1.
z score data analysis table of J company financial supplier applicants
Through the research and analysis of Table 2, it is concluded that 36.36% of the supplier companies belong to the range of less risk of default, and 54.55% of the companies belong to the range of greater risk of default. However, for J company finance platform’s small and medium-sized enterprise suppliers, the threshold may be greater in identifying their credit risk than traditional banks for enterprises involving access qualifications. Moreover, the analysis scope of the z-Score model is limited to accounting data. When the number of suppliers is large and the information is difficult to count, the shortcomings of the z-Score model are exposed. However, based on the analysis of some of the financial supplier data of J company, it is not difficult to see that the credit risk of J company’s financial supply chain financial business is relatively high, which is consistent with the conclusion drawn by J company’s financial supply chain credit risk analysis. Although its risk is high, J company finance platform has not had any credit risk outbreak, which confirms the success of its risk control work. J company finance platform uses big data technology to verify the authenticity of financial companies. The use of big data technology in the identification stage can alert risks and reduce the possibility of risks. After risk identification and analysis, this paper studies the financial risk control measures of J company and intends to find out the best practices in its supply chain financial credit risk control.
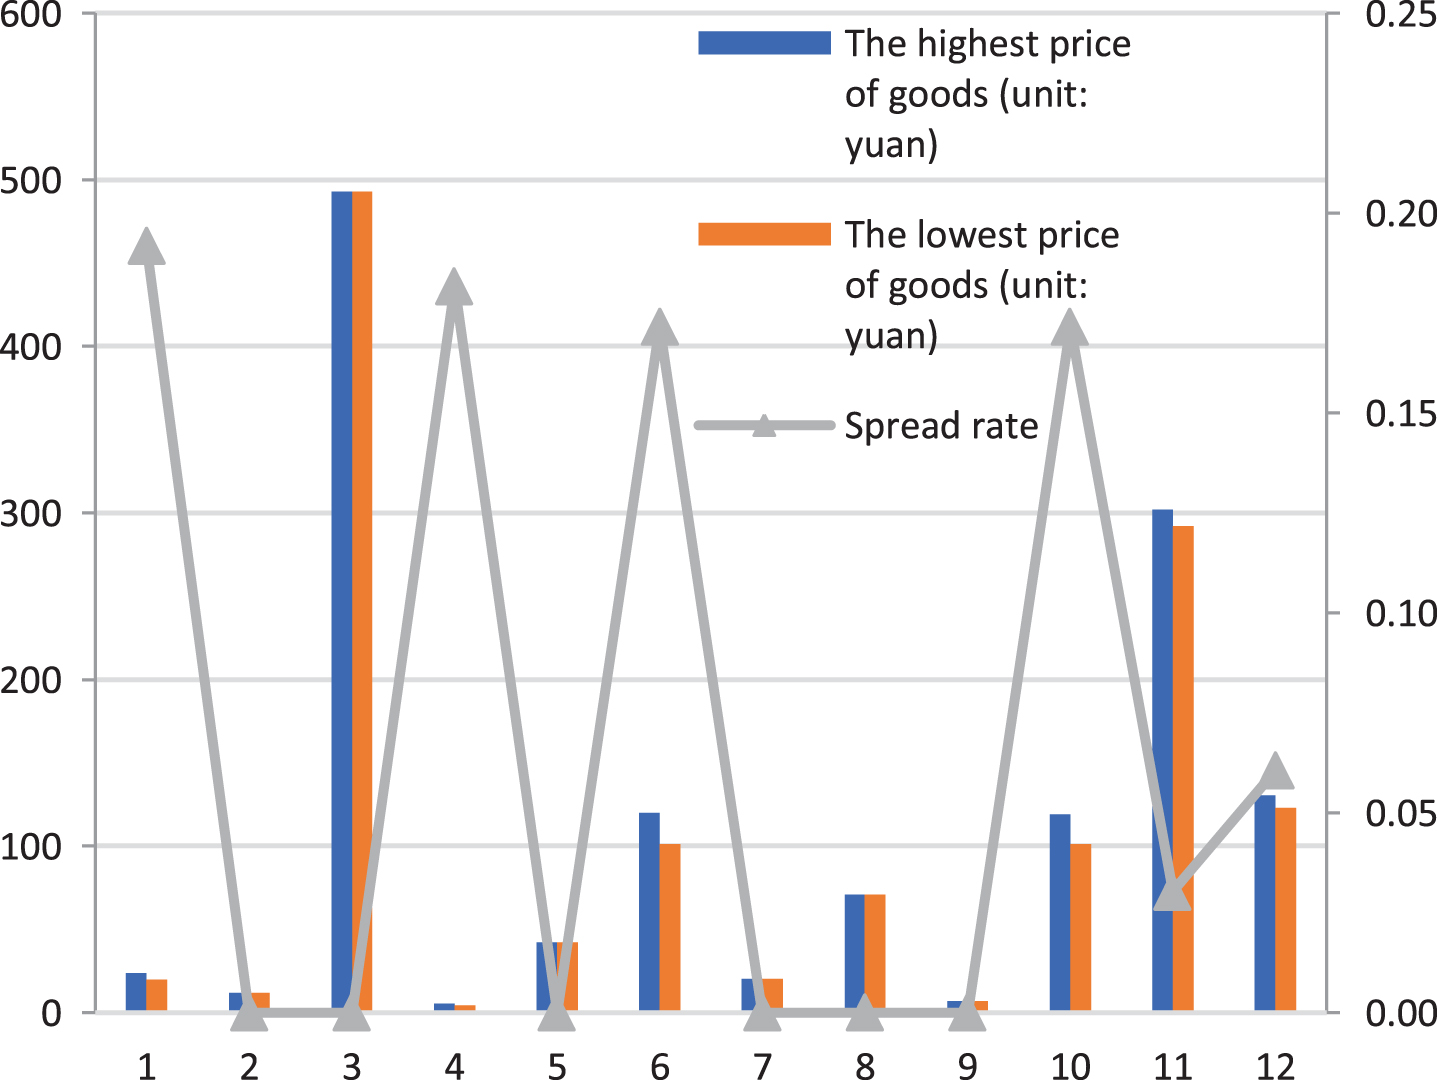
Since J company’s supply chain financial products are financial services provided to its upstream and downstream suppliers and merchants, the market risk for it can be expressed by the spread rate. However, due to the wide variety of products provided by these suppliers and merchants, the small scale of goods, and the irregular and inconsistent naming of goods by enterprises, it is difficult to systematically count the price difference rates of goods. In addition, J company finance platform measures market changes through the changes in the prices of products in J Company Mall. Therefore, this paper uses the highest and highest selling prices of some products that can be collected before June 31, 2020 on the sales of goods in the J company mall to statistically analyze the market risk faced by the financing funds issued by the J company according to the production and circulation of the goods. The spread rate of goods of J company is shown in Tables 2–5 and Figs 5–8.
Spread data table of food goods
Spread data table of aquatic goods
Spread data table of textile goods
Spread data table of hardware goods

Spread data diagram of food goods.

Spread data diagram of aquatic goods.

Spread data diagram of textile goods.
Spread data diagram of hardware goods.
From the data analysis of the above table, we can obtain that the proportion of goods with a spread rate of less than 3% in the J company’s products is about 28%, and the proportion of goods with a spread rate in the range of 3–7% is about 10%, and the proportion of goods with a spread rate greater than 7% is approximately 62%. In general, goods with a spread rate of less than 3% have less market risk, and goods with a spread rate of 3–7% have certain market risks. However, when the spread of goods is greater than 7%, market risks should be alerted. As commodity prices are affected by the “618” promotion discount in the J company mall, the spread rate is also constantly fluctuating, so the data has a wide range of fluctuations. Moreover, due to the different types of goods, the spread rate is also significantly different. For example, the spread rate of digital products is slightly higher than that of apparel products. In summary, combined with the actual situation and collected data analysis, we found that the financial supply chain financial business of J company faces certain market risks, but the financial business of J Company has never experienced a risk outbreak caused by market risks. It can be seen that the financial business of J company has achieved outstanding results in market risk control.
As an innovative credit model that has emerged to solve the financing difficulties of small and medium-sized enterprises and open up profit growth points for commercial banks, supply chain finance has become the business direction for major commercial banks to expand the scale of development and revenue and profits of enterprises of different sizes and industries. However, with rapid development, risk factors have become more prominent, and related risk management systems and measures are not yet complete. Therefore, how to effectively analyze, manage, prevent and propose development strategies for the risk factors that affect the development of supply chain finance is the focus of this paper and the main problem to be solved.
Based on the research of supply chain finance and risk related theories, this paper uses fuzzy preference relations and selects the main risk criteria to construct a risk evaluation index system. Moreover, this paper uses J company’s supply chain finance business development as a background to conduct an empirical analysis and proposes the risk management measures and development strategies of J company’s actual supply chain finance business.
The analysis of supply chain financial risks based on the fuzzy TOPSIS-CRITIC method has good applicability, and can analyze related risk factors to get the risk importance ranking, and has broad research prospects for solving multi-objective decision-making problems and uncertain problems.
Footnotes
Acknowledgments
This research has been financed by In 2020, the Dongguan City Philosophy and Social Science Planning Project “Innovative Development of Supply Chain Finance in the Guangdong-Hong Kong-Macao Greater Bay Area Based on Blockchain Technology” (2020CG20).