
Abstract
In recent years, college campus incidents caused by mental health problems have been increasing year by year, and college students’ mental health problems have become the focus of attention of schools, society and parents. Based on this, this paper proposes a facial emotion recognition method for college students. By using moving target detection, target classification, target tracking, and a series of image preprocessing techniques, this method achieves intelligent monitoring of the area where college students are located and can automatically alert when a potentially dangerous target is found. Moreover, this method uses a combination of shape features and motion features to select and extract feature quantities. In addition, the method calculates the similarity between the target and candidate target corresponding sub-models, and according to the ability of each feature to distinguish between the target and the background, monitors the student’s mental health in real time and prevents various problems from occurring. Through experimental research, we can see that the model constructed in this paper has good performance.
Introduction
The psychological quality of contemporary college students not only affects their own development, but also relates to the improvement of the quality of the entire nation and the cultivation of talents. For contemporary college students, having a positive and optimistic attitude towards life, good interpersonal communication skills, and healthy psychological qualities are important factors to ensure their growth and development, and are the basic requirements of society for high-quality talents. Therefore, it is more and more important to set up psychological health education courses for college students. The psychological health education courses for college students generally teach mental health knowledge to students through scientific, systematic and focused teaching methods. Moreover, it promptly educates and guides the confusion and psychological problems of college students, which allows students to learn to properly adjust their emotions and promote the healthy development of body and mind while mastering relevant knowledge theories [1].
As a new research trend in psychology, positive psychology can provide a new way of thinking for the study of the effectiveness of psychological health education courses for college students. By studying the effectiveness of college students’ mental health courses, we can find problems in the course teaching activities in a timely manner and find solutions to the problems, thereby improving the effectiveness of the course teaching effects. This requires that we must correctly understand and understand the basic links and characteristics of mental health education and teaching activities. Fundamentally speaking, it requires teachers to give full play to their leading role, and students actively learn to digest knowledge and internalize ability, so as to truly achieve the unity of education and self-education [2].
College students are lucky and outstanding among their peers. However, during the period of economic transformation and educational transition in my country, the great changes in the social environment have caused them to encounter various contradictions, difficulties, frustrations and worries in their studies and life. Since college students are not yet fully psychologically mature and have insufficient ability to recognize problems, self-regulation and self-control, when dealing with contradictions and conflicts in their studies and life, they often suffer from setbacks and obstacles, which cause anxiety and trouble, cause psychological depression and psychological tension, and cause various psychological problems. These psychological problems are mainly manifested as environmental stress problems caused by changes in the environment and conditions, self-awareness-related inadaptation, problems in interpersonal relationships and personality, and sexual-related inadaptation caused by psychological problems and psychological barriers [3].
With the development and progress of modern education, colleges and universities are paying more and more attention to the psychological health problems of college students. For college students who have just entered an unfamiliar environment like university, their psychological, physical, and ideological awareness is gradually maturing, and compared with other ages, they are more prone to problems in psychological and physical aspects. College students have more problems with mental health. The reason is that after entering the university, great changes have taken place in the living environment, interpersonal relationships, personal roles, learning methods, etc., which requires students to be able to make corresponding changes to the above changes in a short period of time. If the adjustment is inappropriate or incorrect, students are prone to problems in certain areas. If these problems cannot be solved in time, it will cause students to have other psychological problems and affect students’ study and life during and after college.
Related work
The simple local binary mode LBP proposed in the literature [4] has been widely applied to the description and expression of 2D facial features and has rapidly expanded to 3D mode. However, due to the limitations of the 2D image itself, it cannot directly act on the depth map, or just adopt the method of mapping the depth map to the grayscale image. The depth map needs to be normalized to adapt to the influence of posture changes, and it will also be affected by self-occlusion (such as the occlusion caused by the nose). At present, many 3D face recognition methods have been continuously proposed. The following will focus on some related solutions at home and abroad. Literature [5] has shown their effectiveness on 2D static images in the application of LBP-based solutions in image processing. Inspired by these achievements, the idea of extending LBP to the three-dimensional geometry of the human face has been improved and developed in some studies. Most face recognition methods based on LBP are operated on depth images. This format allows the direct application of LBP in 2D, which has been verified in the pioneering research results of the literature [6]. The literature [7] proposed multi-scale extended LBP (eLBP), which is composed of LBP coding of multiple layers, and is obtained by calculating the difference of the pixel value between the central pixel and the surrounding pixels. The literature [8] introduced the Local Regular Binary Mode (LNBP), which uses the angle of the normal between two points to obtain the LBP binary code instead of using the depth value. This novel idea has also been adopted by many researchers in subsequent research. The literature [9] extracted the normal information of the surface from the three-dimensional data, and then used the normal component values along the three coordinate axes as the depth values and calculated the LBP by using the normal component values on these depth maps. In a further extension, the literature [10] constructed an image of azimuthal equidistant projection. The azimuthal equidistant projection can project the normal to the point of Euclidean space according to the direction. Although the projected information is not depth information, 2D LBP features can still be calculated on the projected image based on the normal of the 3D surface. The three-dimensional LBP method proposed in the literature [11] calculates the interpolation between the normal of a central vertex and the angle between 8 adjacent vertices. This descriptor can be used to represent region-based facial information, similar to the representation process in 2D face recognition. This research includes the idea of using computational normal on the grid, but the grid requires a rigorous preprocessing operation to compress it to 8 vertices close to the center. In addition, according to the different sorting methods of these vertices, different LBP modes can be calculated, and this method also does not support the calculation of multi-resolution LBP [12].
With the advancement of 3D imaging technology, the new generation of acquisition equipment has been able to capture information such as the geometry and texture of 3D objects. The format of the geometric information captured by this 3D acquisition device is usually a point cloud format, which represents the 3D coordinates of a series of 3D object surface points. However, dealing directly with such a point cloud is inconvenient or even impossible. Therefore, the representation of 3D objects in other formats was later developed [13]. Depth images are also a more commonly used imaging method, which can be used to solve many computer vision depth dimension and pattern recognition solutions and can be directly extended to photometric information in 2D images [14]. Although it is also a research hotspot to extend 3D information directly to the 2D method, it is actually 2.5D information, and all geometric information will be lost in this way. However, the triangular grid manifold method allows complete 3D shape information to be retained, and has the characteristics of simple, compact and flexible encoding format. Therefore, it can be widely used in many fields such as animation, medical imaging, computer-aided design, terrain modeling and so on. In addition, in the application of shape scanning and modeling research, 3D mesh manifold supports the method of fusing photometric and geometric information and has rich mesh feature information [15].
In order to evaluate the recognition rate and effectiveness of face recognition technology, comparison experiments and evaluations are usually performed on a unified public face data set [16]. In the past ten years, with the continuous improvement and update of software and hardware, more and more public data sets are available for research scholars, which brings them many conveniences. At present, instead of being restricted by the difficulty of acquiring 3D face images, scientists can directly use the standard data sets that have been created to conduct research and experiments [17]. The article [23] dealt with IoT and human behaviour data with the collection and analysis of data from distinctive resources. The article [24] implements cooperative cognitive intelligence in the field of vehicular communication. The article [25] proposes the concept of SmartBuddy for implementing intelligent and smart city-based environments. The article [26] uses partitioning algorithm for speeding up the process of video processing. The article [27] does IoT and BigData Analytics in the real time environments using Hadoop ecosystem [28, 29].
Extraction and normalization
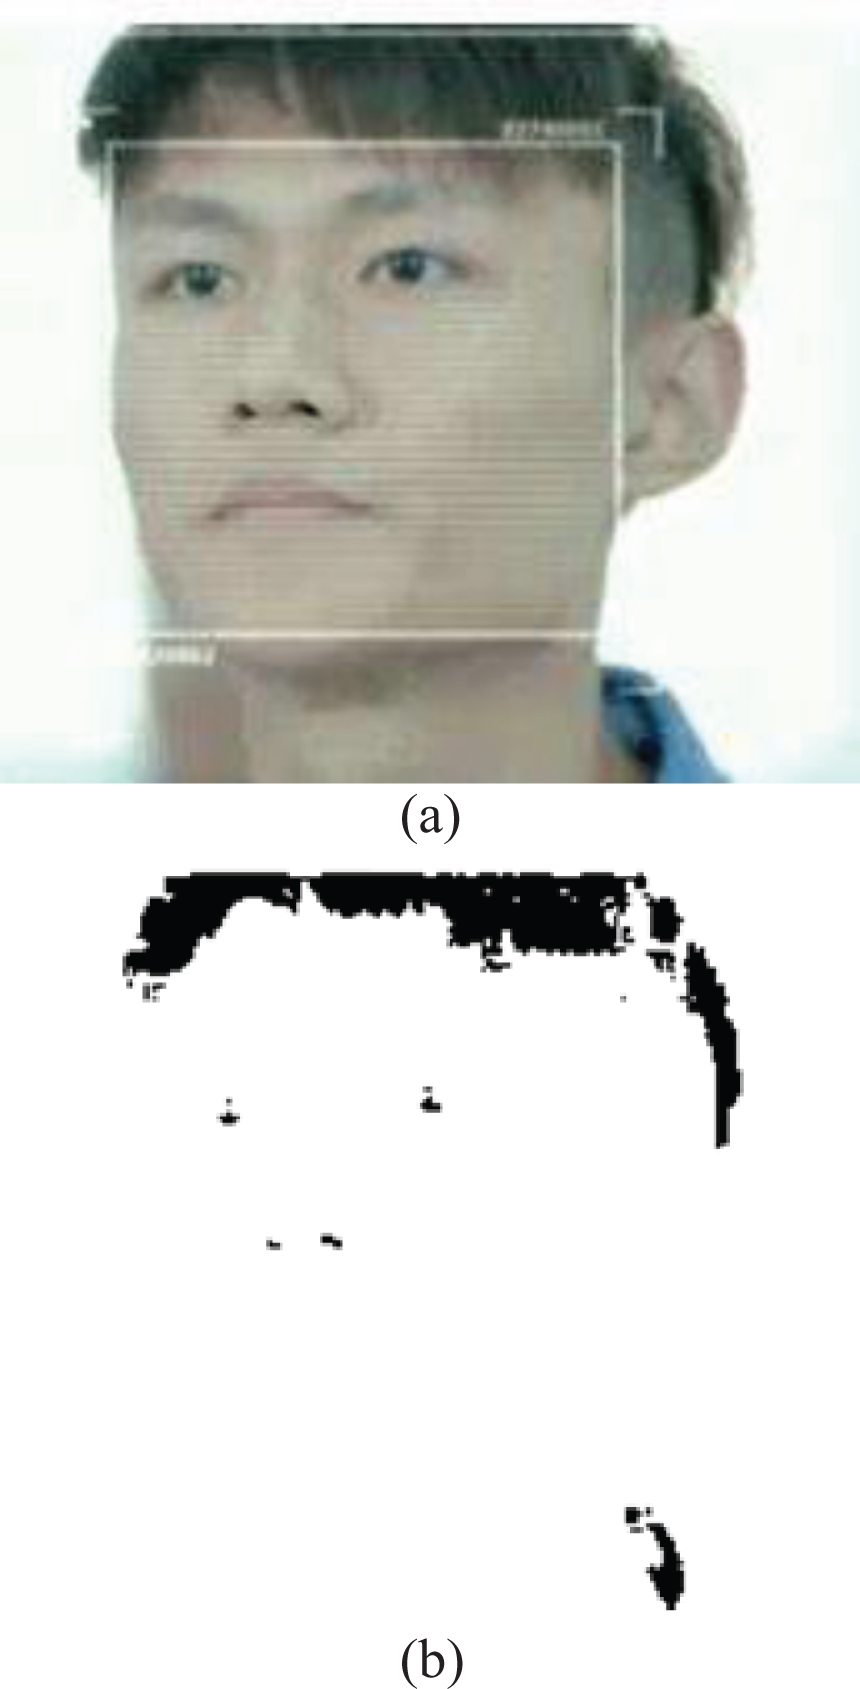
When performing feature extraction, the contour of the target area needs to be obtained. We can use the Canny edge detection algorithm to perform edge detection on the target area and perform morphological processing. The schematic diagram of the detection effect is shown in 1.
The extraction of shape features is generally based on the static contour similarity of the target. This article first circumscribes the smallest rectangle to the target area. In terms of shape feature selection, this paper uses the following parameters as shape feature metrics [18].
(1) Area
Area
The area is the sum of the total number of pixels in the target contour, which can reflect the size of the target volume to a certain extent, and it can be used as an indicator to distinguish between large and small targets (such as large animals and small animals).
(2) Rectangularity
The ratio of the area A
rect
of the target area to the area A of the smallest circumscribed rectangle is the squareness:
Rectangularity reflects how full the area is to the smallest circumscribed rectangle. When the area is round, R = 1; When the area is rectangular, R = π/4;when the area is an area with curved boundaries and irregular distribution, 0 < R < 1 [19].
(3) Dispersion
Dispersion is also called density and complexity, which is defined as the ratio of the square of the perimeter P of the target area to the area A.
The dispersion describes the perimeter of the unit area of the area. The greater the degree of dispersion, the greater the perimeter of the unit area, that is, the area is discrete and a complex shape. Conversely, when the dispersion is small, the regions are dispersed into a relatively simple shape. When the image area is a circle, D has a minimum value of 4π. When the image area is an image area of another shape, D > 4π. Moreover, the more complex the shape, the larger the D value. Dispersion is one of the important criteria to distinguish rigid body from flexible body [20].
(4) Roundness
Circularity C is the feature quantity defined by all points on the target contour, that is:
In the formula, μ
R
is the average distance from the contour centroid to the boundary point, and δ
R
is the mean square deviation of the distance from the contour centroid to the boundary point. Among them, the values of μ
R
and δ
R
are respectively:
When the target contour tends to be round, the feature quantity C is monotonously decreasing and tends to zero, it is not affected by the translation, rotation and scale changes of the region, and can be applied to the complex shape changes of the flexible body. Target contour map as show in Fig. 1.
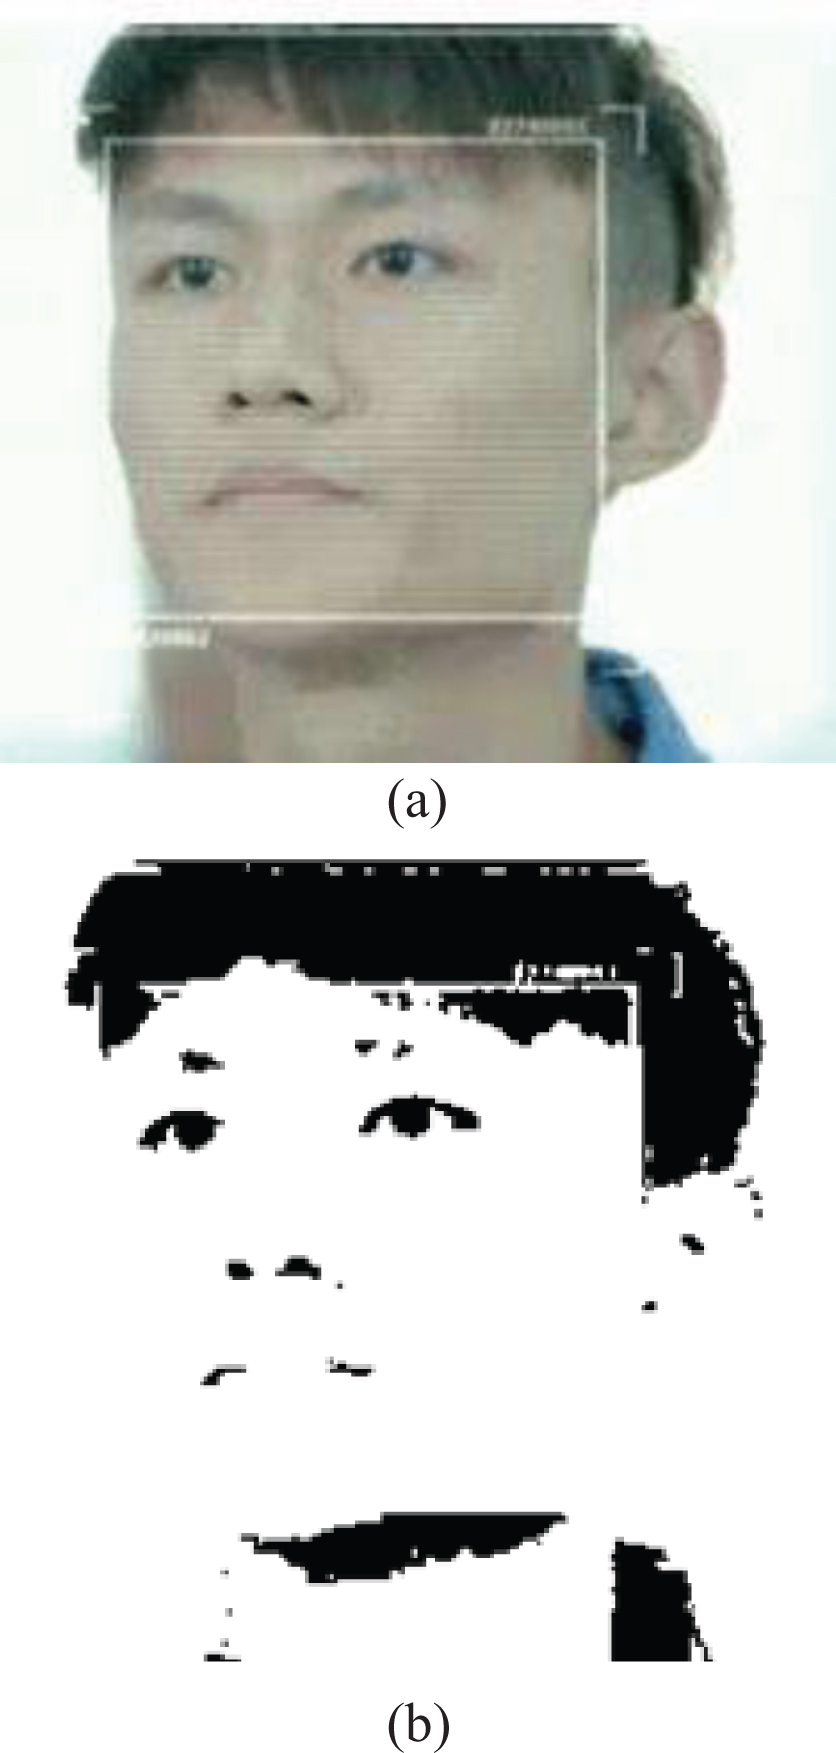
Target contour map.
The above four parameters are denoted by φ1, φ2, φ3, φ4 respectively. Shape features are mainly used for classification between rigid and flexible bodies, and also provide certain reference coefficients for classification between flexible bodies (such as large animals and small animals).
The extraction of motion features is mainly based on changes in the shape or shape of the target, such as the inclination angle of the human or animal body relative to the horizontal plane and the change in the distance between the limbs. Similarly, this paper first circumscribes the smallest ellipse to the target area, as shown in Fig. 2. After that, this paper analyzes the geometric characteristics of the minimum circumscribed ellipse, and uses the following parameters as the target motion feature metric [21]:
Schematic diagram of circumscribed ellipse analysis.
(1) Target movement gait and amplitude
Because the movement gait between humans and animals is obviously different, it can be classified by the gait and span of the moving target. Specifically, this article uses the following two parameters ∠EOF and EF to perform classification. Where, O is the center of the circumscribed ellipse (that is, the centroid of the target area), the image coordinates are (x0, y0), and E and F are the two lowest points in the target minimum circumscribed ellipse where the target area and the ellipse intersect. In addition, the image coordinates are (x1, y1) and (x2, y2), respectively. Then, ∠EOF is:
In the formula,
EF is
∠EOF represents the average swing angle of the lower limbs during target movement, and in general, the value of this parameter for humans is smaller than that for animals. EF represents the gait amplitude value when the target is in motion. When this value is greater than a certain threshold, the possibility of targeting small animals can be ruled out.
(2) Target minimum circumscribed ellipse axis length and length-to-short axis ratio
Because the size of humans or large animals is different from that of small animals, they can be classified by the axial length of the smallest circumscribed ellipse and the ratio of the length to the length. The three parameters used are the long axis AB, the short axis CD and AB/CD of the ellipse. When AB is small, we think the target is a small animal. When AB and CD are large, we think the target is a large animal. Meanwhile, when AB/CD is large, we think the target is human.
The above five parameters are denoted by φ1, φ2, φ3, φ4, φ5 respectively. as shown in Fig. 2
In φ1, φ2, φ3, φ4, φ1, φ2, φ3, φ4, φ5, φ2, φ3, φ4, φ1 is the target feature quantity with translation, rotation and scale invariance. Although φ1, φ2, φ3, φ4, φ5 does not satisfy the above feature invariance, this article limits the collection of these kinds of feature values to a specific image area and the feature quantities referred to in this article are the average of the feature quantities. Therefore, φ1, φ2, φ3, φ4, φ5 can be viewed as being approximately feature-invariant.
Since the size difference of the target’s various feature data is obvious, if it is directly used in subsequent calculations, there will be a problem of uneven feature weights, that is, feature data with a larger value will play a leading role. In order to avoid this situation, it is necessary to do certain processing on the extracted target features to achieve effective classification in the recognition system. Therefore, this paper first normalizes the features, and uses the following formula to normalize each feature value into the [0, 1] range, that is [22]:
In the formula, Emin is the minimum value in the feature quantity, Emax is the maximum value in the feature quantity, and E0 is the original feature value. Meanwhile, E is the normalized feature value.
The basic flow of Adaboost algorithm is shown in Fig. 3.

Adaboost algorithm flowchart.
We assume that x represents the sample feature space and Y represents the sample category identification set. Since the target classification mentioned in this article is a binary classification problem, Y = {- 1, 1} is defined, which corresponds to the “positive” and “negative” of the sample, respectively.
We set S = {(x1, y1) , (x2, y2) , (x3, y3) , ⋯ , (x N , y N )} as the sample training set. Among them, x i ∈ X, y2 ∈ Y, i = 1, 2, ⋯ , N, and N are the number of samples. The specific steps and procedures are as follows:
(1) Sample weight initialization
For each (x
i
, y
i
) ∈ S, we set
(2) We set parameter t = 1
a. The weak classifier is selected, that is
Among them, the threshold θ i is the median of such feature values, and λ i ∈ { 1, - 1 } represents the offset direction of the unequal sign. After that, this paper trains and learns the sample weight D t to obtain the weak classifier h t : X → Y.
b. The misjudgment rate is calculated, that is
If ɛ
t
< 0.5, the algorithm chooses
If ɛ t ⩾ 0.5, the algorithm deletes the weak classifier generated in the current round, t = t + 1, and returns a.
c. The sample weight is updated, that is
Among them, Z
t
is a normalization factor, which can make the following formula hold:
d. When t = t + 1, we set T as the maximum number of iterations of the weak classifier, which represents the upper limit of the number of training rounds. If t = T, the training ends, and if t < T, the training returns a.
(3) The strong classifier is defined, that is
Among them, α i is the performance evaluation factor of the weak classifier h t (x) generated after t training, which is determined by the sum of the sample weights of the classification errors generated by h t (x) acting on the sample set ɛ t . α t is the subtraction function of ɛ t . The smaller ɛ t is, the larger α t is, and the more important h t (x) is. The strong classifier H (x) is obtained by weighted summation of all weak classifiers h1 (x) , h2 (x) , ⋯ , h T (x).
After establishing the target and candidate target models, it is necessary to measure the multi-feature similarity between the target and the candidate target to complete the feature matching to achieve target tracking. Since the distinguishing ability of different features to targets and candidate targets is different in actual scenes, the similarity measure should focus on those features with strong distinguishing ability. Based on this consideration, this paper first calculates the similarity between the corresponding sub-models of the target and the candidate target, then according to the ability of each feature to distinguish the target and the background, the total similarity measure obtained by linear weighted summation is used to describe the Similarity measure ρ, that is:
In the formula, ρ
k
is the similarity measure between the kth sub-models of T
i
and C
j
, and λ
k
is the weight assigned to each sub-model according to the feature selection rate, which satisfies
Then, the total similarity measure can be expressed as:
Here, a total similarity metric threshold ρmin is set to describe the minimum similarity limit between the target and the candidate target.
According to the similarity measure, the shape, LI, and coordinates of the target area and its matching candidate target area are obtained and recorded respectively to realize the positioning of the target.
In order to make the actual monitoring area correspond to the image, that is, when establishing the reversible transformation relationship between the image plane coordinates and the actual background coordinates, camera calibration is required. Afterwards, from the perspective of projective geometry, this paper proves that there are two quadratic constraints that approximate two Kruppa equations between two images of the same scene. In this paper, the camera parameters can be obtained by directly solving the Kruppa equations. In view of the difficulties caused by directly solving the Kruppa equation, Hartley and Triggs also proposed the idea of hierarchical and stepwise calibration, that is, projective reconstruction of the image sequence, and then radiometric calibration and European calibration based on this.
Here, a method of estimating the linear projection matrix M3×4 of the three-dimensional world coordinates N-dimensional image coordinates is used. The principle of this method is that when the coordinates of the actual background of n ⩾ 6 non-collinear points and the image plane are known, we can use linear least squares to solve the following equation to obtain the transformation matrix M3×4:
In the formula,
In this paper, only the situation where the monitoring target is moving on the road is considered, so the three-dimensional space in the actual background can be simplified to a two-dimensional plane, that is, the Z-axis coordinate value in the world coordinate system is always zero. Then, the transformation matrix is reduced to M3×3. The equation to be solved is the same as the formula. From
We set invM3×3 as the inverse matrix of M3×3 and n
i
as the i-th row of invM3×3. Then, the formula for calculating the actual scene coordinates from the image coordinates is:
In the formula, p = (u, v, 1).
Thus, the transformation relationship between the actual scene coordinates and the image coordinates is obtained. In specific applications, the vertical point of the camera lens to the road surface can be used as the origin of the road surface coordinates, and the camera can be directed in a certain direction. After determining the road coordinate system of the actual scene, you need to set the marker points for camera calibration. Figure 4 shows the marked points set in the background pictures collected in the laboratory, which are denoted by A-K, respectively, and the road surface coordinates (x, y) in the actual scene are shown in Table 1. After solving the transformation matrix by using the road coordinates and image coordinates of the five points A, C, E, F, H, this paper uses the formula to calculate the estimated road coordinates (x′, y′) of these points. It can be seen from the marking results that although only five marking points are used, the calibration results have reached a very good level, and the relative error can be controlled within 1%. However, in order to prevent the larger measurement error of some of the five points from causing errors in the entire transformation matrix, this article recommends using more marked points.

Marking points set in camera calibration.
Mental health score results
After the camera is calibrated, the actual monitoring area can correspond to the image. However, in actual surveillance images, not all interested targets pose a threat to the tower. Therefore, in order to determine whether the target is a potentially dangerous person, it can be achieved by setting a sensitive area and further analyzing the movement trend of the target in the sensitive area.
Aiming at the special environment in which college students are located, a circular monitoring area is set around the tower, that is, monitoring is performed by a spherical camera fixed on the tower. In order to facilitate the calculation, this paper circumscribes the hexagon in the circular area. The camera should have a reasonable height and a positive angle of view in order to achieve better detection results. This article sets the camera to be installed at the height 2/3 of the tower. Considering that the camera cannot cover all the monitoring area in many cases, you need to activate the “tour” function of the spherical camera for monitoring. In this paper, the horizontal rotation angle of the camera is set to 120°, and the depression angle is fixed at 30°. Then the actual area to be monitored when the camera is stationary is divided into three parts, and each area is an isosceles trapezoid. Moreover, the camera rotates 120° at intervals to monitor the three areas. Its vertical plan view and three-dimensional schematic diagram are shown in Fig. 5. Among them, the black shading area is the trapezoidal area that actually needs to be monitored.
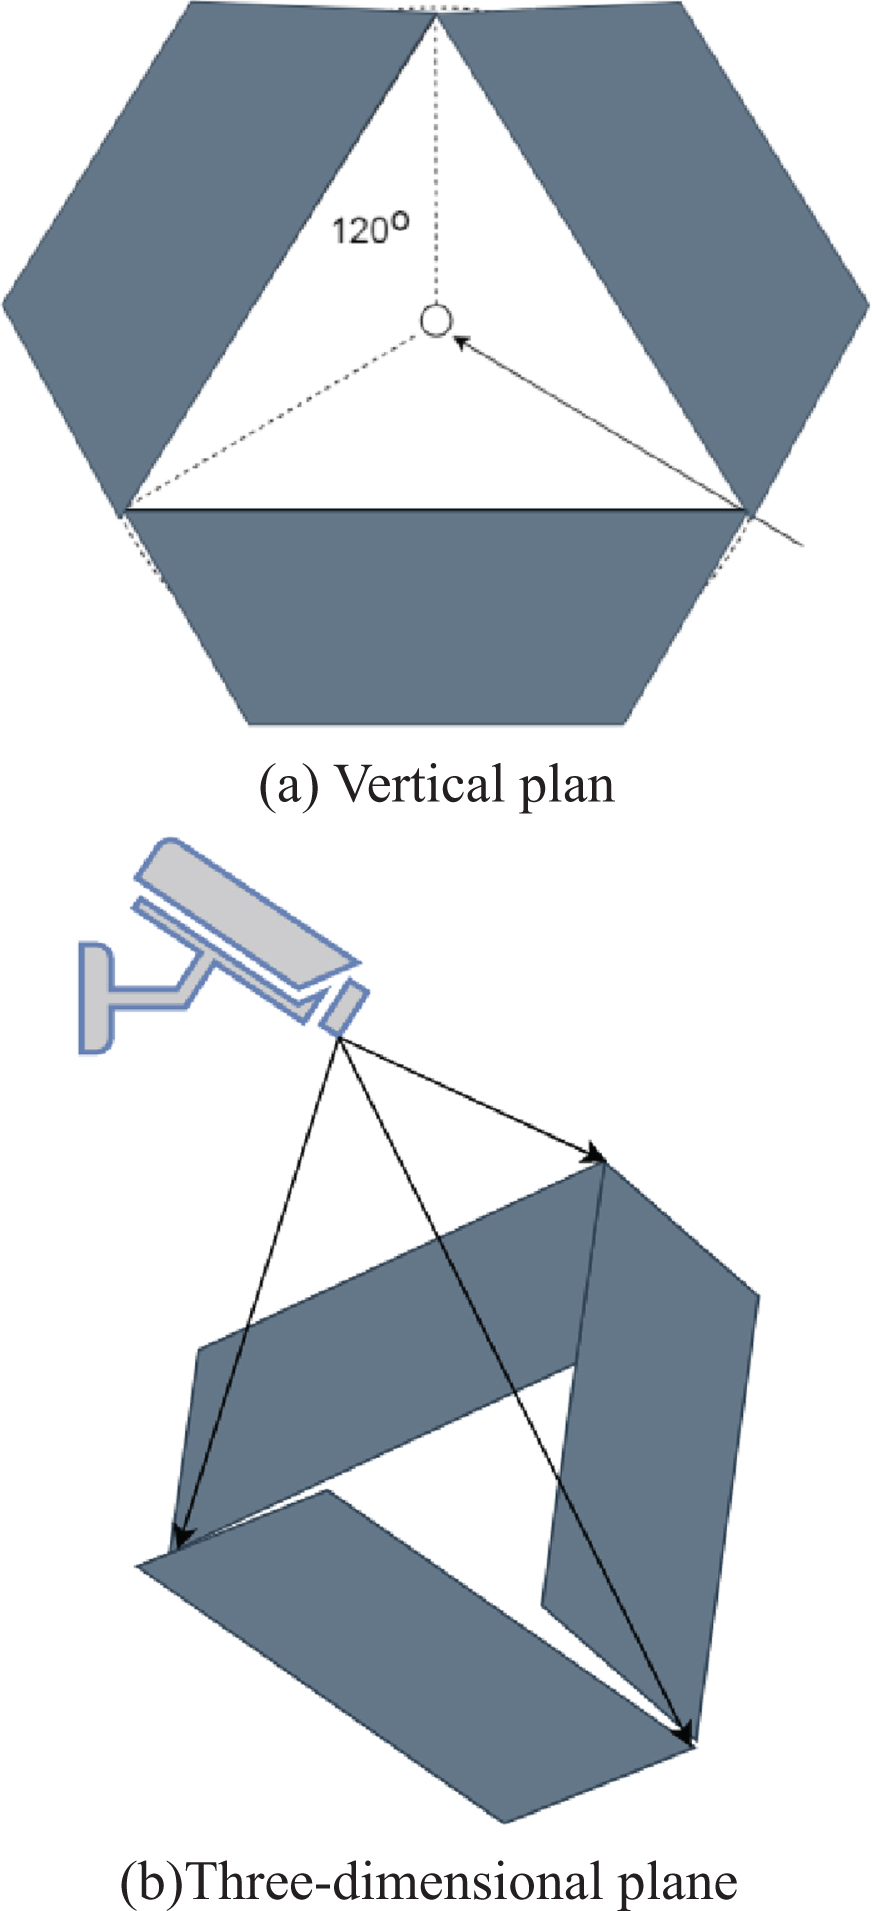
Vertical plane and three-dimensional schematic diagram of the sensitive area.
The trapezoidal area is still embodied as an isosceles trapezoid in the obtained image angle of view. Therefore, the view of the sensitive area in the image plane is shown in the trapezoidal area in Fig. 6a). After the sensitive area is determined, the image coordinate system needs to be described mathematically on the image. When performing image processing, the origin of the image coordinate system is at the upper left corner of the image frame. Then, the sensitive area analysis in the image coordinate system is shown in Fig. 6b. Among them,

Plan view of the sensitive area image and its analysis diagram.
is the coordinates of the four vertices of the trapezoid sensitive area, h0 is the height of the trapezoid, and θ is the inner angle of the trapezoid. Here, the sensitive area is represented as A (x, y) in the image coordinate system. Then, when the value of A (x, y) is l, the target is in the sensitive area, namely
Among them,
When the target appears in a sensitive area, in many cases, the target is not necessarily a potentially dangerous target. At this time, it is necessary to judge based on certain conditions. This paper believes that when a target appears in the sensitive area for more than the maximum alert time Tmax and continues to approach the tower, it may be a potentially dangerous target. That is, the vertical distance between the target and the bottom edge of the trapezoidal sensitive area continues to decrease within a certain period of time, and this process can be reflected in the Y coordinate value of the image coordinates of the target centroid continuously increasing. The schematic diagram of the trajectory of potentially dangerous targets is shown in Fig. 7. Among them, the black dots represent the target centroid, and the dotted line simulates the change trajectory of the target centroid.

The trajectory of potentially dangerous targets.
In order to determine whether the target is a potentially dangerous target, an alarm function needs to be established, and this function is determined by analyzing the target’s trajectory. To this end, this article first defines an alarm transition function C j (T i ), and its mathematical expression is as follows:
Among them, (x j , y j ) is the centroid coordinate of the target T i at the jth frame, yj-12 is the centroid Y coordinate of the T i at the j - 12 frame, C j (T i ) indicates the movement state of the target within 12 frames. That is, when the target of interest is still in the sensitive area and close to the tower after 12 frames, C j (T i ) is set to 1, and this state of the target is recorded.
The alarm function can be expressed as:
Among them, n represents Tmax = 12n, that is, a decision is made every 12 frames, and a total of n decisions are made. After synthesizing the past judgment results of n times, the value of the alarm function can be determined.
The alarm function C (T i ) is determined by the value of the alarm transition function C j (T i ) in consecutive Tmax frames. This alarm mechanism can be understood as: when a tracking target has been in the sensitive area for the alert time Tmax, and the Y coordinate value of the centroid coordinates continues to increase, the alarm on the tower is triggered and alerts the monitoring center. If no such situation occurs, monitoring is continued.
On the basis of the above analysis, based on the neural network crisis, this article combined with facial recognition to carry out psychological analysis of college students. Taking 50 students as an example, this article analyzes videos of students’ daily lives and classroom teaching videos, combines facial recognition with neural networks to perform image analysis, and connects images to students’ mental health. In this paper, 69 students were tested to score mental health. The results obtained are shown in Table 1 and Fig. 8.
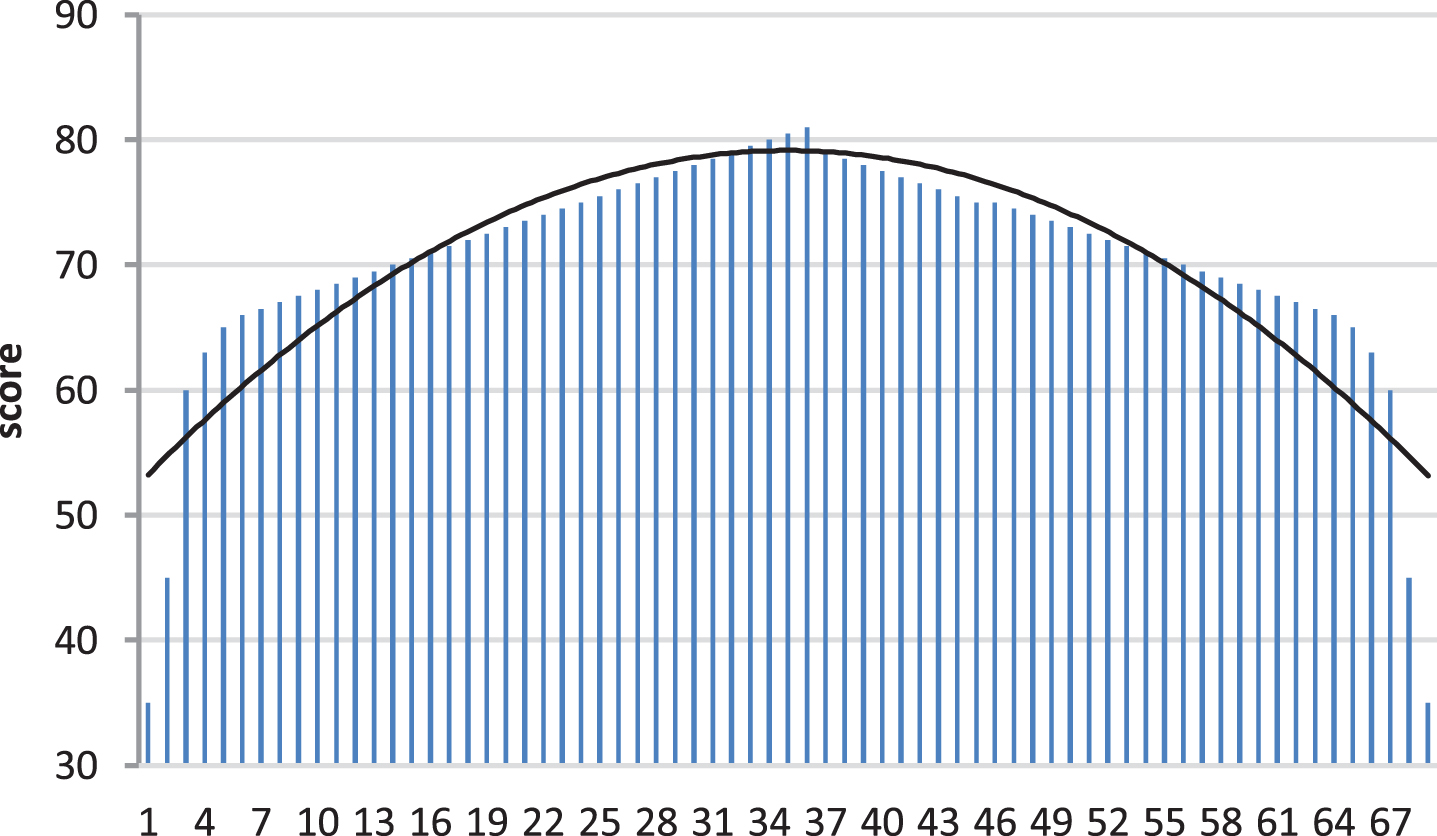
Statistics of mental health score.
It can be seen from Fig. 8 that the statistical results of the model constructed in this paper are relatively consistent with the actual situation. Moreover, judging from the statistical chart, although the results of the system identification in this paper are not normally distributed, the results are similar to the normal distribution, which can be approximated as a normal distribution.
Based on the above analysis, this paper conducts model performance analysis. Because this article uses face recognition for mental health diagnosis, it is also necessary to verify the effect of this system on student emotion recognition. This paper performs emotion recognition on 69 students, and the results are shown in Table 2 and Fig. 9.
Statistical table of emotion recognition results
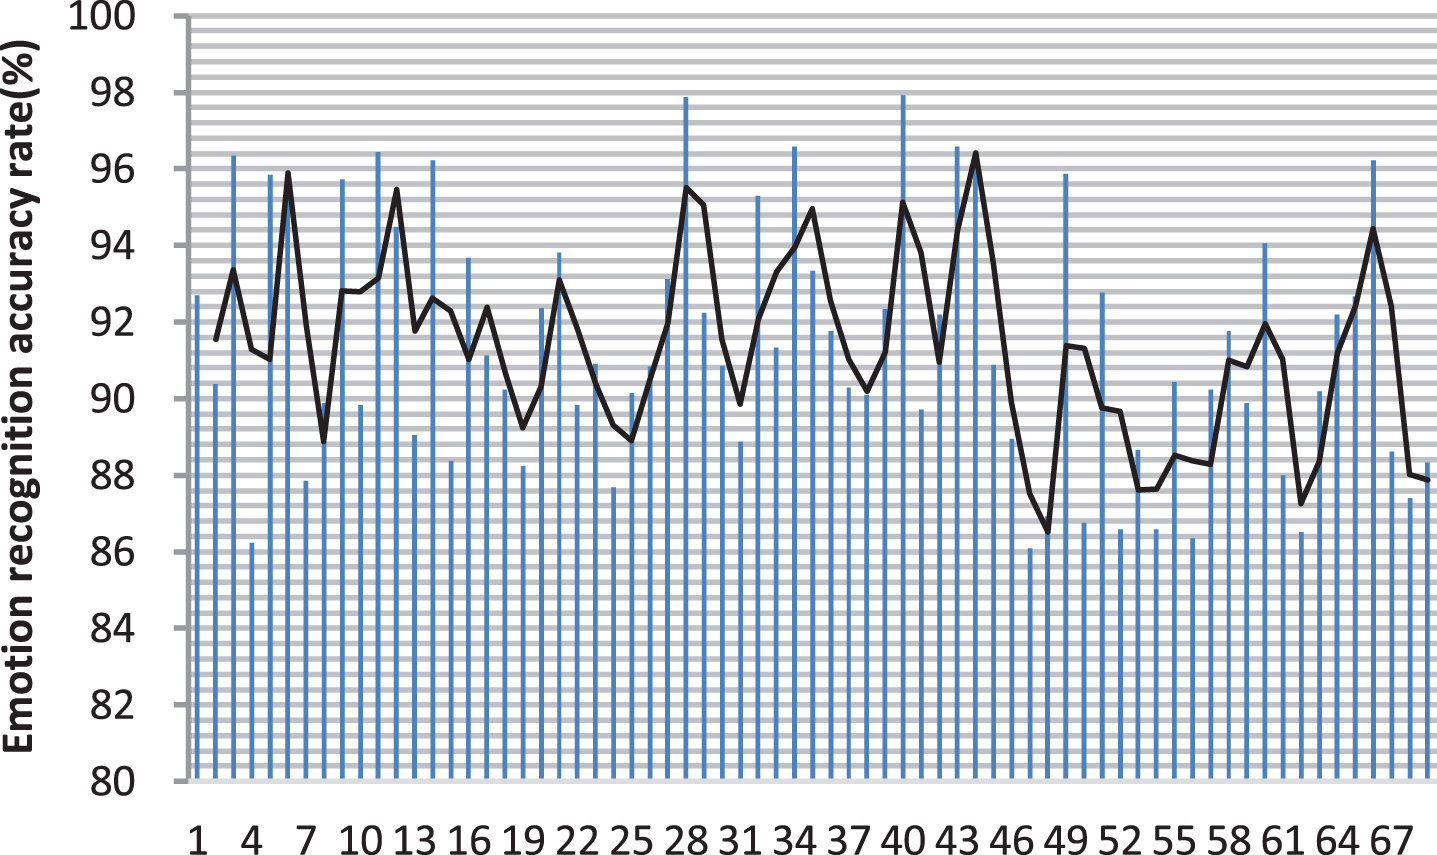
Statistical graph of emotion recognition results.
It can be seen from Fig. 9 that the psychological diagnosis system for university learning constructed in this paper performs well in the recognition of college students’ emotions. It can be seen that the model constructed in this paper can be applied to the diagnosis of efficient college students’ mental health.
The application system of mental health information management system has been developed. Moreover, the mental health test system combines mental health knowledge, mental health test, mental health forum and other functions to comprehensively and comprehensively conduct mental health interventions. At present, some mental health systems have been able to integrate mental health knowledge, classify and display data in various aspects to provide users with more comprehensive mental health knowledge. The application of intelligent video technology to the safety monitoring of college students’ mental health is of great significance for ensuring the safe and stable operation of college education and improving the overall quality of students. Aiming at various unstable factors that affect facial recognition and the special environment in which college students are located, this paper proposes a method for facial emotion recognition of college students. Moreover, the method uses moving target detection, target classification, target tracking, and a series of image preprocessing technologies to achieve intelligent monitoring of the area where college students are located. In addition, the method can automatically alert when a potentially dangerous target is discovered, monitor students’ mental health in real time, and prevent various problems from occurring. Through experimental research, we can see that the model constructed in this paper has good performance.
Footnotes
Acknowledgments
This paper was supported by Chengde Medical University Youth Fund for Humanities and Social Sciences research projects: Research on the relationship of social support, academic self-efficacy and mental health among Chengde Medical University Upgraded College students, No. 201841.