



Abstract
The regional economic evaluation and analysis has guiding significance for the subsequent economic strategy formulation. Due to the influence of various factors, the volatility of some current economic evaluation models is relatively large. According to the needs of regional economic evaluation, this study uses computer technology combined with regional economic development to build an economic development evaluation model to evaluate and analyze the regional economy. Through comparative analysis, this study selects the entropy weight-TOPSIS model as the comprehensive evaluation model of regional economy, uses the entropy weight method to determine the weight of each index, and then uses the TOPSIS method to conduct comprehensive evaluation. In addition, this study designs a control experiment to analyze the performance of this study model. Moreover, this study uses the model proposed in this study to conduct regional economic evaluation in recent years, and compares it with real data, and observes the test results with statistical charts and table data. The research results show that this research model has a certain effect, which can provide analytical tools for the follow-up economic strategy research and analysis.
Introduction
In today’s world, cooperation and exchanges are the mainstream of regional economic development, and coordinated development is an important theme of interregional economic development, and each region produces “1 + 1 > 2” synergies through mutual cooperation and sharing of resources and information. With the continuous deepening of globalization and the rapid development of a new round of scientific and technological revolution and industrial transformation, new industries, new formats and new models continue to emerge. Moreover, with the acceleration of digitization, networking, and intelligence, the flow of people, logistics, capital, and information between regions has greatly increased [1]. The regional economic cooperation has transcended its own boundaries, involving multiple levels such as geographic space, economic space, and the relationship between actors. The subjects of different natures and levels (regions, industries, enterprises, cities, etc.) have very different roles in the economic system. Through the flow of various economic factors, the relationship between subjects at different levels is closer and a regional economic cooperation effect with multiple connotations is formed. At a new historical stage, starting from the new situation of China ’s regional development and the new requirements for a comprehensive construction of a well-off society and a new journey towards a comprehensive socialist modernization country, the report of the Nineteenth National Congress of the Communist Party of China clearly proposed the implementation of the “One Belt and One Road” strategy, the coordinated development of the Beijing-Tianjin-Hebei region, and the development of the Yangtze River Economic Belt to lead the coordinated economic development among regions. Understanding the important role of interregional economic coordinated development and conforming to its development trend is the basis and premise for implementing the new development concept of “innovation, coordination, green, openness and sharing” and achieving high-quality economic development [2].
In order to achieve qualitative economic development, we must put technological innovation and financial development first. The reason for this is that technological innovation is the primary driving force for realizing economic development and reform, and it is also the strategic direction and fundamental requirement for building China’s economic modernization. After many years of hard work, China’s technological development has achieved good results, and there are also many important scientific and technological achievements that can rival the advanced countries of the world. However, there are still many gaps with developed countries in many aspects, such as technological innovation mechanism, technological innovation input and final result of technological innovation, etc. In particular, the effect of technological innovation on economic development is far behind compared with developed countries. The development of technological innovation is inseparable from the development support of the financial industry. As far as our country is concerned, the financial industry, as a strong support for China’s economic development, not only plays a vital role in the process of economic development, but also plays an irreplaceable role in promoting the development of technological innovation. Therefore, to achieve the development of technological innovation and then the purpose of economic development, it is inseparable from the strong supporting role of the financial industry. At present, the financial system is developing rapidly in China, and financial agglomeration has gradually become an important organizational form of the financial industry. The role of financial agglomeration will enable the local economy to form economies of scale, which can speed up the dissemination of information in the local area, facilitate mutual business transactions, and promote the mutually beneficial behavior of shared resources. Under such a background, enterprises will become more competitive with each other. Only by constantly innovating, strengthening technological innovation, and eliminating backward industries can companies continue to move forward in this environment. The financial industry can bring financial assistance to enterprises’ technological innovation activities, and the economies of scale in the financial industry will bring convenience to enterprises. Therefore, in order to improve economic development, it is necessary to further deepen the relationship between financial agglomeration and technological innovation [3].
Based on the above research, this study uses computer technology combined with regional economic development to build an economic development evaluation model to evaluate and analyze regional economy.
Related work
In terms of regional economic research, the literature [4] established a double logarithmic linear regression model through empirical analysis, which reveals that the number of employees in the tertiary industry and the level of urbanization are the main factors influencing the development of regional tertiary industry in China. The literature [5] comprehensively evaluated the development level of the tertiary industry in 13 cities in Jiangsu Province using multivariate statistical methods such as factor analysis and cluster analysis. The literature [6] explored the main influencing factors of the tertiary industry in Nanjing through a multiple linear regression model, and pointed out that the development of tertiary industry in the region mainly relied on the improvement of the level of urbanization, urban consumption, and investment in construction capital. The literature [7] constructed a macro quality competitiveness evaluation index system, and established a macro quality index model using factor analysis to discuss the relationship between the macro quality index MQI and regional GDP. Based on the data of Jiangsu Province over the years, the literature [8] established a correlation model of fiscal revenue with GDP and tax revenue to perform regression analysis, and modified and fitted the linear logarithmic model of the three. The literature [9] established a linear regression model by analyzing the fiscal revenue and various data of Beijing over the years, and used the least square method to study the significance of fiscal revenue.
The literature [10] studies the dynamic relationship between technological innovation, financial capital, and economic growth from the perspective of complex systems, which breaks the long-standing thinking of neoclassical economics. The results of the study suggest that there is no exact date for the end and start of each phase or period, and most of the processes involved overlap each other. And, as each technological revolution spreads from one country to another, its spread is unbalanced, so there is a misplacement of the sequence of these events in different countries. The model is a long-term dynamic model and cannot explain some individual events (such as financial crises). The literature [11] conducted a theoretical analysis by establishing a dynamic game model with three departments and an empirical test by the ARDL-ECM boundary effect test model.
The literature [12] built a comprehensive index system for the coordinated development of regional economies from the aspects of industrialization, technological development, urbanization, Engel’s coefficient, and modernization. The literature [13] also proposed a regional economic coordinated development evaluation index system composed of three categories of indicators: regional economic development gap, regional social development gap, regional resource and environmental development gap. The literature [14] set up a comprehensive evaluation system of sustainable development in Wuhan from three aspects: economic growth, social progress, and sustainable development of the ecological environment. From the two dimensions of economic development and social development, the literature [15] selected eight areas of economic strength, structure, vitality and efficiency and residents’ quality of life, social stability medical care, science and technology education and culture, and public ecological environment to build an evaluation index system for the coordinated development of Ningbo’s economic society. In addition, the literature [16] considered economic growth, social progress, resource and environmental support, and sustainable development capabilities to establish a specific indicator system to construct and evaluate the urban sustainable development evaluation index system. The literature [17] established an evaluation index system for Liuzhou City and conducted a systematic study of social structure, economic benefits, quality of life, population quality, social order and social stability. Moreover, this literature evaluated the comprehensive development of Chengdu’s economic circle in terms of social and economic development, science and culture, people’s living standards, environmental conditions, infrastructure construction, health and medical conditions, and population employment structure. The literature [18] evaluated and analyzed the city of Qingdao in terms of total economic volume, structure, benefits, motivation and population, quality of life, and social policies, and comprehensively evaluated 15 sub-provincial cities from the four areas of population development, living standard, public service and social harmony.
The literature [19] applied the system dynamics method to put forward a system dynamics simulation model of the coordinated development of the economy and society of Shijiazhuang City, which provides a theoretical basis for the coordinated development of economy and society. Lizhu Zhang and others used the grey system theory to establish the economic and social coordinated development measurement model of Qingdaoand the DEA (Data Envelopment Analysis) coordinated degree model to analyze the coordinated development of resources, environment and economy. These are the analysis of the coordination model at the macro level. In addition, there are also many studies on the specific measurement of micro-coordination. The literature [19] constructed a distance coordination model and a dispersion coefficient minimization coordination model. The literature [20] proposed the degree of coordination of membership functions and described similar degrees of coordination of fuzzy membership functions. The literature [21] proposed the rescaled range analysis. The literature [22] deeply analyzed the coordinated development of regional economy based on game and other nonlinear economic system modeling methods by combining qualitative and quantitative research methods. Moreover, the literature used an evaluation system composed of a spatial model for coordinated economic development, a model for technological innovation decision-making incentives, and an institutional innovation model to conduct qualitative, quantitative, and empirical research on the coordinated development of regional economies. The article [23] implementated IoT-based Smart City is achieved by exploiting IoT and BigData Analytics using Hadoop ecosystem in real time environments. The article [24] reflects on IoT and its main role in the development of human behaviors and actions. The paper also deals with the compilation of various data from different databases connected to the Internet. The literature [25] addresses the numerous issues in the field of vehicle communication with the suggestion for a mutual unified and dispersed spectrum sensing model. The introduction of a mutual cognitive paradigm minimizes conflict and multiple unknown problems. The literature [26] discusses the issue, such as large amount of bigdata, and introduces the SmartBuddy framework for creating smart and adaptive ecosystems using human behaviors and human dynamics. The article [27] talks around the development of coordinated non-cyclic chart for video coding calculations for movement estimation in parallel reconfigurable computing frameworks. The partitioning algorithm moreover plays a key part in optimizing the encoding of images [28, 29].
Comprehensive evaluation model
At present, the development of comprehensive evaluation model theory has become mature. Scholars at home and abroad have proposed many excellent evaluation models, and each model has its own advantages. However, due to the different theoretical mechanisms that various models are based on, each model has its own advantages and disadvantages. Therefore, even if it is the same data source, the results and conclusions obtained by using different evaluation models are often different. In this paper, on the basis of summarizing the results of previous studies, an appropriate evaluation model is selected, namely the entropy weight-TOPSIS model. Several main comprehensive evaluation models are introduced as follows.
AHP is a decision analysis method proposed by American expert Saaty in the early 1970 s. This method takes a more complex multi-objective decision problem as a system and decomposes it into several subsystems. After that, this method decomposes each subsystem into several levels, and then fuzzy quantizes, ranks, and calculates the weights of indicators as a systematic method to solve the multi-plan optimization decision-making system method. Moreover, this method combines qualitative analysis with quantitative analysis, combines expert subjective judgment with objective facts, and hierarchizes the problems to make the results of comprehensive evaluation effective and reliable. The main analysis process of this method is as follows:
1) This method establishes a comprehensive evaluation index system, and divides the index into several levels based on the importance level. After that, this method compares the indicators of the same level with their relative importance and assigns values to the indexes by experts. The values of n indicators are b j .
2) The judgment matrix A is established, and the weight vector is calculated. By sorting the above b
j
values, a judgment matrix A is obtained:
Among them,
The geometric mean of each row is calculated, and the formula is as follows:
Then, the weight of each basic index is calculated, and the formula is as follows:
3) Consistency test of judgment matrix
The largest characteristic root of the judgment matrix A is calculated:
The consistency index of judgment matrix A is calculated:
By looking up the table, the average random consistency index RI is obtained, and then the random consistency ratio is calculated:
If CI < 0.1, it can be judged that the judgment matrix A meets the consistency requirement. The index weights obtained by the analytic hierarchy process can determine that the judgment matrix A meets the consistency requirements, and the index weights obtained by the analytic hierarchy process.
4) The comprehensive evaluation index of each program is calculated. The calculation formula of the comprehensive evaluation index of the jth program is as follows:
Among them, Y = (y ij ) m×n is a new matrix obtained by normalizing the decision matrix.
5) The larger the comprehensive evaluation index, the higher its development level in this field.
The TOPSIS method is a model proposed by C.L. Hwang and K. Yoon in the 1980 s. After decades of practical application, it has achieved good analysis results in the fields of economics, medical treatment, engineering, etc., and has many successful cases, and its development has matured. The advantages of the TOPSIS method are: 1) There are few restrictions on evaluation objects, which can be spatial objects or practical objects; 2) There are fewer requirements for indicators at all levels, data distribution, etc., and it is widely applicable to various samples, suitable for local analysis and system analysis; 3) It makes full use of the original data, so there is little loss of information in the process of data processing.
The TOPSIS method first introduced two concepts: positive ideal solution and negative understanding. The positive ideal solution is the theoretically optimal solution to the decision problem, and the values of all indicators reach the theoretical optimal value, However, the negative ideal solution is the opposite, which refers to the theoretically the worst solution to the decision problem, and the values of all indicators reach the theoretically the worst value. On the basis of these two concepts, the distance between each solution and the positive and negative ideal solutions is calculated to compare the advantages and disadvantages of the solutions. The optimal solution is the one that can satisfy the closest distance to the positive ideal solution and the farthest distance from the negative ideal solution. The basic calculation idea of the method is: first, it establishes an initial decision matrix, and then obtains a standardized initial matrix based on some data standardization rules, and finds the worst and best two in a limited scheme, that is, the so-called negative and positive ideal solutions. After that, the distance between each index and the positive and negative ideal solutions (usually Euclidean distance) is calculated separately. We assume that the decision matrix is X = (x ij ) m×n and the index weight vector is W = (w1, w2, ⋯ , w n ) T . The main calculation process of the model is as follows:
1) The dimensionless processing is performed on the decision matrix to obtain the matrix Y = (y ij ) m×n. At this time, it should be noted that the processing methods of the positive and negative indicators are different. After the non-dimensional processing, the positive and negative indicators are positive, that is, the value is proportional to the development level.
2) The weighted standardized decision matrix V is calculated:
3) The weighted standardized decision matrix is used to calculate the positive and negative ideal solution has monotonicity:
Positive ideal solution:
Negative ideal solution:
Among them,
4) The distance between each solution and its positive and negative ideal solutions is calculated. Generally, the Euclidean distance is used:
5) The relative closeness of each solution is calculated:
6) The relative closeness
In 1984, American mathematician C.E. Shannon first proposed the concept of information entropy. In his book “Mathematical Theory of Communication’’, the basic mechanism and principle were introduced in detail. The concept of thermal entropy is an index used to measure the degree of molecular chaos in physical thermodynamics, and information entropy is similar to this, which is an index to measure the amount of information.
By calculating the information entropy of each index, a large part of the original information of each index can be more comprehensively and objectively reflected. In general, the amount of information contained in an indicator is inversely proportional to the information entropy, that is, the smaller the information entropy, the larger the weight of the indicator in the comprehensive evaluation process. Conversely, the larger the information, the smaller the amount of information contained in the indicator, and the smaller the weight of the indicator in the comprehensive evaluation process. The entropy value can also be used to judge the randomness and disorder of an event and the discreteness of various indicators. As an objective weighting method, compared with other methods such as traditional multivariate statistical analysis methods, the entropy method has the following advantages: The calculation process is simple and easy to understand, it has few restrictions on the data distribution, and it does not need to assume a normal distribution or an approximate normal distribution as a premise.
Since the weight calculation in the entropy method is based on the actual observation value and objective data of the data, the weight result obtained by it has greatly reduced the influence of subjective factors in the weight giving process (such as information loss), which helps researchers to obtain more practical and objective results. The determination of the index weight also affects the quality of the comprehensive evaluation model to a large extent. However, the entropy method also has its limitations. Because the entropy method is too objective, the weights obtained may not match the actual economic conditions. Therefore, the economic interpretation of the index weights may not be as good as the subjective weighting methods such as AHP.
The specific calculation process of the entropy method is as follows:
1) The weight of the j-th index value of the i-th sample is determined:
2) The entropy value of the jth indicator is determined:
3) The entropy weight of the jth indicator is determined:
4) The composite index value (score) of the i-th sample is determined:
5) The higher the index, the better the sample evaluation.
Chinese scholar Julong Deng first proposed the “gray system theory” in 1982. After decades of research and application, it has been widely used in agriculture, geology, economic management and other fields. Among them, gray correlation analysis is the most representative. This method judges the correlation degree of factors by comparing whether the change curves of the factors are similar in geometry and the degree of similarity.
First, two concepts need to be clarified. In gray correlation analysis, the gray refers to the incomplete information available for a system, and the degree of correlation refers to a measure of the correlation between two factors in the system. If the relative change of these two factors is not strong, it means that their correlation is weak, otherwise, it can be considered that the two are highly correlated. This method uses a quantitative method to describe and compare the state and trends of system development and changes, and has the following advantages: 1) The calculation process is relatively simple; 2) The model belongs to a sequence model and is not presented in the form of a function; 3) There are no too strict restrictions on sample size and data distribution. However, when using this method for comprehensive evaluation, the reference sequence must be determined first.
We assume that there are m samples, n basic indicators, and x
ij
is the value of the jth basic indicator of the i-th sample.
X i ={ xi1, xi2, ⋯ , x in } is the comparison sequence of the i-th sample. The basic calculation steps are:
1) The reference sequence X0 = {x01, x02, ⋯ , x0n} is set, and X0 is an ideal value or an optimal value, which can be determined by oneself. In addition, the difference between the optimal values of the positive index, inverse index, and moderate index needs to be noted.
2) X0 = {x01, x02, ⋯ , x0n} and X i = {xi1, xi2, ⋯ , x in } are subjected to data processing to obtain the reference sequence Y0 ={ y01, y02, ⋯ , y0n } after data processing. After that, sequence Y i ={ yi1, yi2, ⋯ , y in } is compared.
3) The correlation coefficient ξ
ij
of the j-th basic index of the i-th sample is calculated.
In this formula: y0j - y ij = Δ ij is the absolute difference between Y0 and Y i in the J-th basic index;
ρ ∈ [0, 1]g is the resolution coefficient, and in general, ρ = 0.5.
4) The weight vector is set
Among them,
Then, the correlationdegree between Y
i
and Y0 is:
5 Analysis principle of entropy weight-TOPSIS model
This article mainly uses the entropy weight-TOPSIS model for calculation and analysis. This method is actually improved from the traditional TOPSIS method. The main idea of this method is to use entropy weight method to determine the weight of each index, and then use TOPSIS method to carry out comprehensive evaluation. This method also uses the idea of objective weighting by entropy weight method and the idea of TOPSIS method to approximate ideal solution, which can effectively eliminate the influence of human subjective factors. Compared with the simple entropy weight method and TOPSIS method, its effect is better. The main flow of the model is as follows:
(1) The entropy weight method is used to determine the entropy weight:
1) The weight of the value of the J-th indicator of the i-th scheme is determined:
2) The entropy value of the Jth indicator is determined:
3) The entropy weight of the jth indicator is determined:
Therefore, the weight vector obtained by pooling the entropy weights of each index is W = (w1, w2, ⋯ , w n ) T .
(2) The TOPSIS method is used to perform evaluations:
4) If it is assumed that there are m schemes and n indicators, then there is a decision matrix X = (x ij ) m×n. The decision matrix is processed by data normalization to obtain the matrix m Y = (y ij ) m×n.
5) The weighted standardized decision matrix V is calculated:
6) The weighted standardized decision matrix is used to calculate the positive ideal solution and the negative ideal solution, which are usually required to be monotonic in the TOPSIS method. The positive and negative ideal solution formula is as follows:
Positive ideal solution:
Negative ideal solution:
Among them,
7) The distance between each solution and its positive and negative ideal solutions is calculated. Generally, the Euclidean distance is used:
8) The relative closeness of each scheme is calculated:
9) The relative closeness
GDP is one of the most important indicators for measuring the regional economy in the world, and the development level of the tertiary industry is also an important indicator for measuring the development level of the service industry. In addition, residents’ consumption levels and per capita wages directly reflect the living standards and quality of people in the region, and investment in fixed assets is the driving force for sustained economic development. In short, these six indicators are closely related to each other, and together form a set of indicators, which can more comprehensively reflect the true level of regional economic development.
There are 32 areas selected in this article, numbered 1-32 respectively. In this paper, the number of classifications is 4, and after 45 iterations, the following membership matrix is obtained, as shown in Table 1, and the corresponding distribution diagram is shown in Fig. 1.
Membership matrix
Membership matrix

Distribution diagram of membership matrix.
Based on the above analysis combined with this research model, the results are shown in Table 2.
Regional economic classification results
Based on the above analysis, regional economic evaluation is carried out. Considering the convenience of practical application, a more unified index variable was selected to perform comparative analysis. The data published by existing statistical departments (such as the official website of the National Bureau of Statistics) is selected. Considering the comprehensiveness of the indicators, systematic selection of indicators is conducive to reducing the time for collecting data and improving work efficiency.
The coefficient of variation of each criterion layer in the three major regions of China and the weight of the three target layers of economic development, ecological energy, and social development are counted. Moreover, the data for 2010 and 2019 are compared. The specific results are shown in Tables 3 and 4, and the corresponding images are Figs 2, 3. The distribution corresponds to the weight and coordination evaluation index values of each target layer in the three major regions of 2010 and 2019 and is sorted by T value from largest to smallest.
Statistical table of evaluation index values of coordination degree of three major zones in 2010
Statistical table of evaluation index values of coordination degree of three major zones in 2019
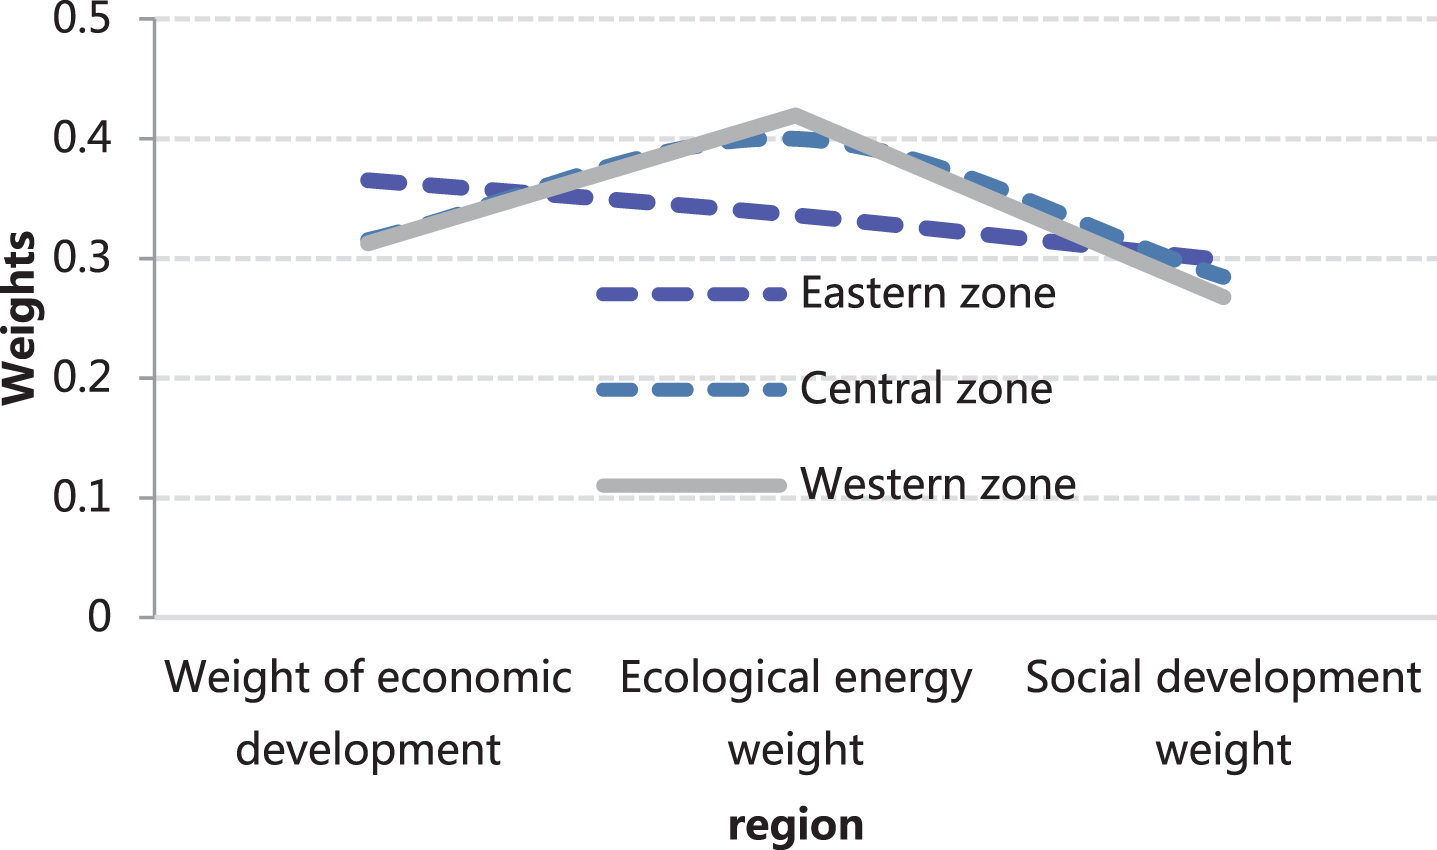
Statistical diagram of evaluation index values of the coordination of the three major regions in 2010.
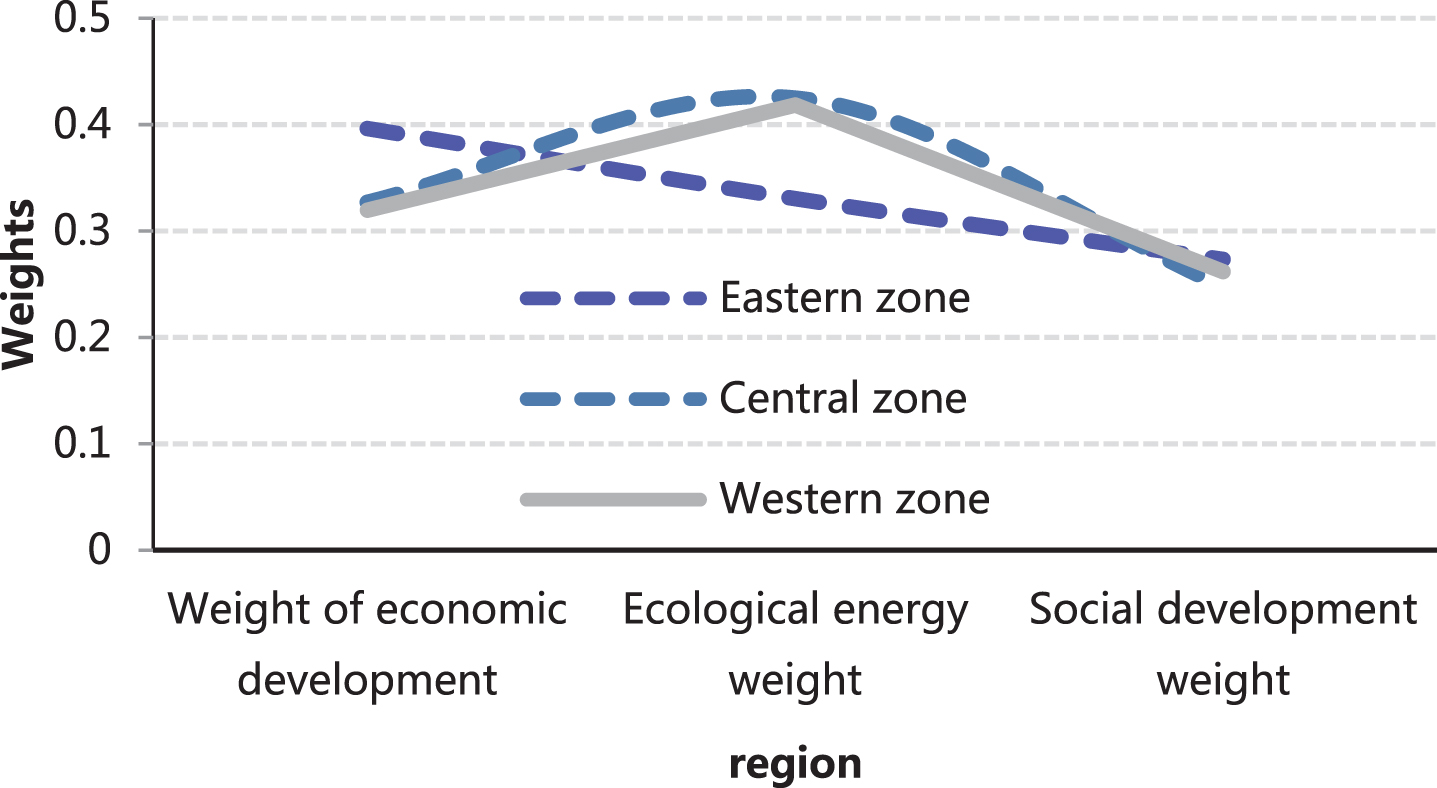
Statistical diagram of evaluation index values of the coordination of the three major regions in 2019.
It can be seen that the evaluation indexes of the regional economic coordination degree of the three major regions from 2010 to 2019 are not small. The best economic development among the three major regions in 2010 and 2019 is in the eastern region, which is consistent with the results described above. In 2010, only the coordination of the eastern zone is better than the national average, while in 2019, the eastern zone and the central zone are better than the national average. Moreover, the level of coordinated development in the central zone has risen steadily, and only the western zone is still below the national average. However, the coordinated development of regional economies in the three major areas has improved to a certain extent. The eastern zone has been relying on economic development to promote regional economic coordinated development. The ecological energy development in the central zone is quite different, which has a greater impact on regional coordinated development. The western region has always been at a disadvantage. From the calculation of the elastic coefficients of the economy, ecology and society of various provinces and cities in the country, it can be concluded that economic development is still an important part of the coordinated development of regional economies. In this regard, the western region does not have much advantage. However, Analysis of the status quo shows that the western region has great potential, and many indicators of economic development have higher rates of growth, and have greater economic vitality and development space. Therefore, the state should vigorously support the development of the western region and quickly promote the coordinated development of the regional economy in the western region.
Next, the accuracy of the regional analysis of this study is studied. The research method is to conduct regional economic evaluation in recent years through the model of this study and compare the results with real data.32 regions of the country are selected as the evaluation regions, and the evaluation errors are used as the output results. The obtained research results are shown in Table 5 and Fig. 4.
Error distribution table

Error distribution diagram.
In order to more clearly study whether the error of this study exceeds the requirement, the error should not exceed 0.005. In the error distribution diagram, the error limit is added, and the result is shown in Fig. 5.

Comparison diagram of error distribution and error limits.
As shown in Fig. 5, the errors of this study are below the standard limit, so the errors of this study do not exceed five thousandths, which meets the previously set requirements. It can be seen that this research model has a certain effect.
The goodness of fit of the model in this study is relatively high, and most of the variables can pass the significance test at the level of 10%. The impact of economic development in various regions will be more or less affected by technological innovation and financial industry development. However, at present, the most important influencing factors of regional economic development are labor input and capital factors, which are basically consistent with the results discussed in the previous section. Through horizontal comparison, it is found that the technological innovation and financial agglomeration in eastern, central and western regions have different effects on economic development. In the eastern region, technological innovation activities and financial industry development have a positive effect on economic development. In addition, the degree of development of the financial industry in the central region will have a positive effect on economic development, but technological innovation is not significant. However, the financial agglomeration in the western region has a negative effect on economic development, and technological innovation is not significant.
Using the evaluation model to evaluate the comprehensive strength of regional economic development, and to study the current status and differences of regional economic development, it belongs to the comprehensive evaluation method. The main steps are as follows: (1) The purpose of the comprehensive evaluation is determined; (2) The indicators at all levels are selected and a multi-level comprehensive evaluation indicator system is constructed; (3) The dimensionless method of the determined index value; (4) The weight of each index is determined; (5) According to the indicators, the comprehensive evaluation model is determined; (6) The relevant calculation results are calculated: (7) The calculation results are comprehensively analyzed. In the comprehensive evaluation model, there are a distinction between a subjective weighting method and an objective weighting method, and each method has its advantages, disadvantages, and scope of application. It is determined to select the entropy weight-TOPSIS model as the comprehensive evaluation model of this paper. One of the main meanings is that the model combines the advantages of the entropy weight method and the TOPSIS method, which is beneficial to eliminate the interference of human subjective factors in the process of determining the index weight. Moreover, this study sorts out and explains the main principles and calculation process of the model, including data preprocessing, weight determination process, comprehensive index calculation process and other steps. In addition, the effectiveness of the method proposed in this study is analyzed through examples. The results show that the method has certain effects.
Footnotes
Acknowledgment
National Social Science Project: Research on the measurement and promotion path of China’s economic efficiency under the constraints of resources and environment, No. 15CJL014.