
Abstract
Power quality of distribution network is an emerging issue due to rapid increase in usage of non-linear loads on the one hand and utilization of sensitive devices on the other hand. Especially, harmonic emission is an important concern in both electric utilities and end users of electric power. Therefore, an accurate and rapid harmonic analysis method is of interest. New technologies have enabled the investigation of electricity consumption mode at an unprecedented scale and in multiple dimensions. However, an effective method that can capture the complexity of all the factors relevant to understanding a phenomenon such as ultrahigh harmonics (2–15 kHz). How to detect the super high order harmonic accurately has become the premise and foundation of the study of super high order harmonic. The key challenge in developing such approaches is the identification of effective models to provide a comprehensive and relevant systems view. An ideal method can identify super high harmonics and predict outcomes, by measured data across several dimensions variation. In this paper, the data integration, current methods and available implementation is discussed. Finally, the current challenges in integrative methods is discussed.
Introduction
Driven by the progress of science and technology and the demand of users, the development of distribution network from the current intermediate form to the future advanced form is gradually accelerating. On the power side, the application of distributed generation, electric energy storage and comprehensive energy technology promotes the clean and diversified energy sources of distribution network; on the grid side, the power electronics application in the primary electrical network and the full coverage of the secondary information network greatly improve the controllability and observability of the distribution network; on the load side, a large number of new load terminals such as smart home, electric vehicle, comprehensive energy and so on appear, and will form a deep game in the market environment with the participation of multiple stakeholders, which makes the distribution network more complex. With the continuous development of new energy [1–5] utilization and smart grid [6–10], active distribution network [11,12, 11,12], the development of energy Internet [14], the topology of power grid is becoming larger and larger, and the composition of load is becoming more and more complex. At the same time, the demand of power users for high-quality power is becoming increasingly urgent. Improving the power quality has become an important topic to ensure the power grid economy. In the future, distributed power microgrid, electric vehicle will be connected to the power grid on a large scale, more power electronic devices and non-linear equipment will be used, power harmonic injection will cause more and more serious impact, a large number of harmonic injection into the power grid will reduce the efficiency of power use, make the equipment overheat, aging, failure, cause errors in the secondary system, etc., which will not only harm the power The safe operation of the system also brings economic losses to power users.
Power electronic technology is still developing rapidly, and its application scope almost permeates into all fields. One of the important signs of the development of this technology is that the switching speed of the thyristor has been greatly improved. For example, the switching frequency of the inverter (DC / AC converter) has been increased from the early tens of Hertz, thousands of hertz to tens of kilohertz or even hundreds of kilohertz. With the vigorous development of renewable energy, especially the input of a large number of solar photovoltaic inverters (PV inverters) and the application of various switching power supplies, the super high harmonics in the range of 2 kHz∼15 kHz in the power grid (mainly in the low-voltage power grid) increase rapidly, and the cases of its harmful effects are also rising. In addition, the public power grid is generally used for signal transmission and a large number of harmonics are injected into the power system, which not only endangers its safe operation, but also brings economic losses. On the load side, distributed generation, DC distribution network and Microgrid technology are booming, intelligent mobile devices and electric transport tools are becoming more and more popular, and the rectifier and inverter based on power electronic transformation technology are still important requirements for flexible and efficient use of electric energy, which will inevitably lead to the negative side gradually moving towards a high degree of power electronics [13]. In this context, the massive access of new energy generation and energy storage, as well as the diversified demand of users for power supply, accelerate the process of power electronics in the distribution network, and bring a series of new theoretical and technical challenges to the operation control and management maintenance of the intelligent distribution network [14]. Super high order harmonic has different characteristics from low-frequency harmonics, which need different analysis techniques. Because of the complexity of super high order harmonic signal, generally, the measurement and analysis of super high order harmonic of equipment can be carried out in two different fields: frequency domain and time domain. After proper data processing, different data representations are obtained [15]. Therefore, how to extract the super harmonics effectively becomes the basis and premise of its analysis and research.
Wavelet packet decomposition
Harmonic refers to the components which are larger than the integral times of fundamental frequency obtained by Fourier series decomposition of periodic non sinusoidal AC flow. It is usually called high-order harmonic, while fundamental wave refers to the components whose frequency is the same as that of power frequency (50 Hz). At present, the harmonic detection technologies at home and abroad are based on instantaneous reactive power theory, Fourier transform, Prony Algorithm and wavelet analysis detection methods. Fourier transform is regarded as an effective method of harmonic analysis, which plays an important role in the field of steady-state waveform analysis. However, due to its own defects and spectrum leakage, the phase and amplitude obtained by Fourier transform are quite different from the actual situation. Prony series, as an extension of Fourier series, retains the characteristics of high accuracy and convenient use of Fourier algorithm, and also makes up for the limitations of its inability to extract attenuation features. Prony algorithm is a mathematical model to describe the signal of equal interval sampling data. It uses the linear combination of exponential function to accurately calculate and analyze the attenuation factor, amplitude, frequency and initial phase of the signal. But Prony algorithm is relatively sensitive to noise, and in the case of too much noise, it is easy to be interfered, affecting the analysis results.
Fourier analysis method is a fixed window function analysis method. In the field of steady-state waveform analysis, Fourier transform is regarded as an effective method of signal analysis. However, due to its own defects and spectrum leakage problems, the phase and amplitude obtained by it are quite different from the actual situation, so it is impossible to analyze the non-stationary and time domain of the sequence signal. Wavelet analysis is a kind of time-frequency localization analysis method with fixed window area but changeable shape, that is, time and frequency windows can be changed. By selecting a set of bases to determine a fixed window, wavelet analysis truncates the time-domain sequence signal, and then transforms it to frequency-domain analysis, which can observe the time-domain and frequency-domain changes at the same time. Wavelet transform can accurately calculate the local details of the signal, which is suitable for extracting the transient signal in the power signal. It can decompose the signal into high-frequency part and low-frequency part. Because it only decomposes the low-frequency signal in the process of decomposition, and no longer decomposes the high-frequency signal, its frequency resolution decreases with the increase of frequency.
Wavelet analysis not only has the advantages of localization of traditional short-time Fourier transform (DFT), but also overcomes the disadvantage that the window size does not change with frequency. As a new transform method, wavelet analysis provides a time-frequency window that changes with frequency, which is an effective theoretical basis in harmonic detection of power system. But wavelet analysis only decomposes the low frequency signal. The frequency range of Super high order harmonic signal is 2–15 kHz, which is in the high frequency range of signal.
Wavelet packet transform is to decompose the signal in its frequency range at multiple levels, further decompose the high-frequency signal which is not decomposed in the multi-resolution decomposition, and adaptively select the corresponding frequency range according to the characteristics of the decomposed signal to match the signal spectrum, thus improving the time-frequency resolution. Therefore, in the ultra-high harmonic analysis, the wavelet packet decomposition is small it has more extensive and practical value and significance.
The specific wavelet function in wavelet packet decomposition consists of a set of specific wavelet filter coefficients. When the wavelet function is selected, the corresponding set of wavelet filter coefficients will be known. Low pass filter and high pass filter with different dimensions are constructed by wavelet filter coefficients. Low pass filter can be seen as a smoothing filter. These two filters, low pass and high pass, are also called scale and wavelet filters respectively. As shown in Fig. 1.

Schematic diagram of wavelet decomposition.
where A represents low frequency signal, D represents high frequency signal. S is an original signal.
The first task of harmonic signal management is to extract the power signal information from the line for signal processing. Commonly used signal processing methods include Fourier transform, wavelet transform, etc [6]. Among them, Fourier transform is widely used in the processing of stationary and linear signals, but the user’s electric signal is random and has the characteristics of non-stationary and non-linear. Fourier transform can only obtain high frequency resolution when the signal changes slowly. Wavelet transform only decomposes the low-frequency part of the signal, but no longer decomposes the high-frequency part, that is, the detail part of the signal. Therefore, wavelet transform can well represent a large class of signals with low-frequency information as the main component, and can’t well decompose and represent the signals with large amount of detail information (small edge or texture). Especially for the super high order harmonics in power system, it can’t be well resolved.
Wavelet packet transform is the improvement and development of wavelet transform. It can provide more precise analysis ability for signals. It can further distinguish useful signals and noise signals by decomposing the high-frequency parts which are not subdivided in wavelet transform. Moreover, this kind of decomposition has neither redundancy nor omission, so it can make better time-frequency division for signals containing a lot of medium and high-frequency information partial analysis. It is defined that the subspace Unj is the closure space of function Un(t), and U2nj is the closure space of function U2n(t), so that Un(t) satisfies [12]:
If
Wavelet packet reconstruction is the inverse process of wavelet packet decomposition. Wavelet packet reconstruction algorithm:
Know
Then,
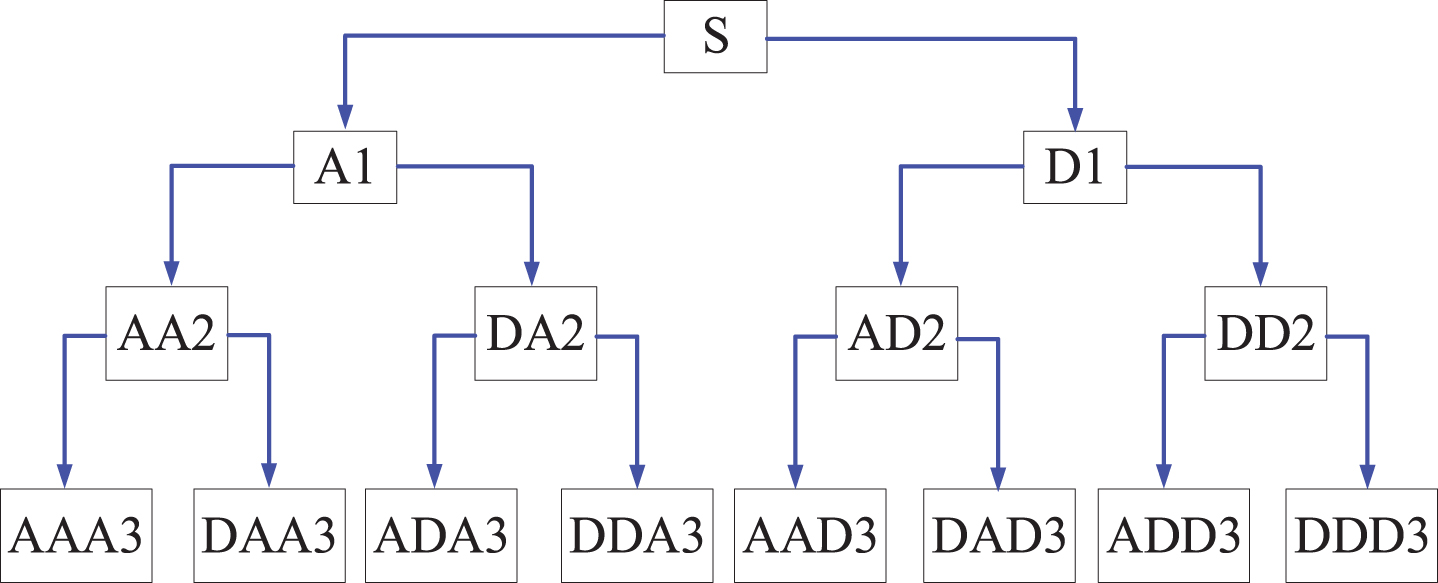
Assuming the scale of decomposition is 3, the wavelet packet decomposition of signal s is shown in the figure.
A represents low frequency, D represents high frequency, and the number of serial numbers at the end represents the number of layers of wavelet classification. The decomposition has the following relations: S = AAA3 + DAA3 + ADA3 + DDA3 + AAD3 + DAD3 + ADD3 + DDD3
With the increasing complexity and diversification of power electronic technology, a large number of power electronic devices with nonlinear, unbalanced and impulsive characteristics cause the continuous deterioration of power quality of distribution network. The injection of UHF harmonics in power system not only endangers its safe operation, but also brings economic losses. With the rapid increase of the capacity and quantity of the nonlinear load in the power grid, the condition of multiple harmonic sources coexisting is increased, and the dynamic characteristics of the parameters of the power grid, such as fluctuation and mutation, are also enhanced, which brings great difficulties to the identification of harmonic sources and the division of responsibilities. In order to study this change, the model of power electronization in distribution network is built.
The power electronic modeling of the distribution network is shown in Fig. 3. The DC distribution network is connected to a node in the AC distribution network. After VSC1 is connected to the grid, the DC grid bus voltage is 4 kV. VSC1 adopts constant DC voltage control and constant reactive power control. After VSC1, it is connected to three-phase full bridge DC / DC circuit (DAB). The high-voltage side of DAB is 4 kV, the low-voltage side of DAB is 2 kV, the low-voltage side of DAB is 2 kV, and the DC bus is connected to 0 23 mW photovoltaic, rated photovoltaic light 1000, temperature 25°C. DC bus connected to VF controlled inverter, reference voltage 0.38 kv, frequency 50 Hz, followed by rated 300 kW load. The voltage level of the AC system is 0.38 kV and the frequency is 50 Hz. There are two loads in the AC distribution network, 30 kW and 20 kW respectively.
Wavelet packet decomposition tree.
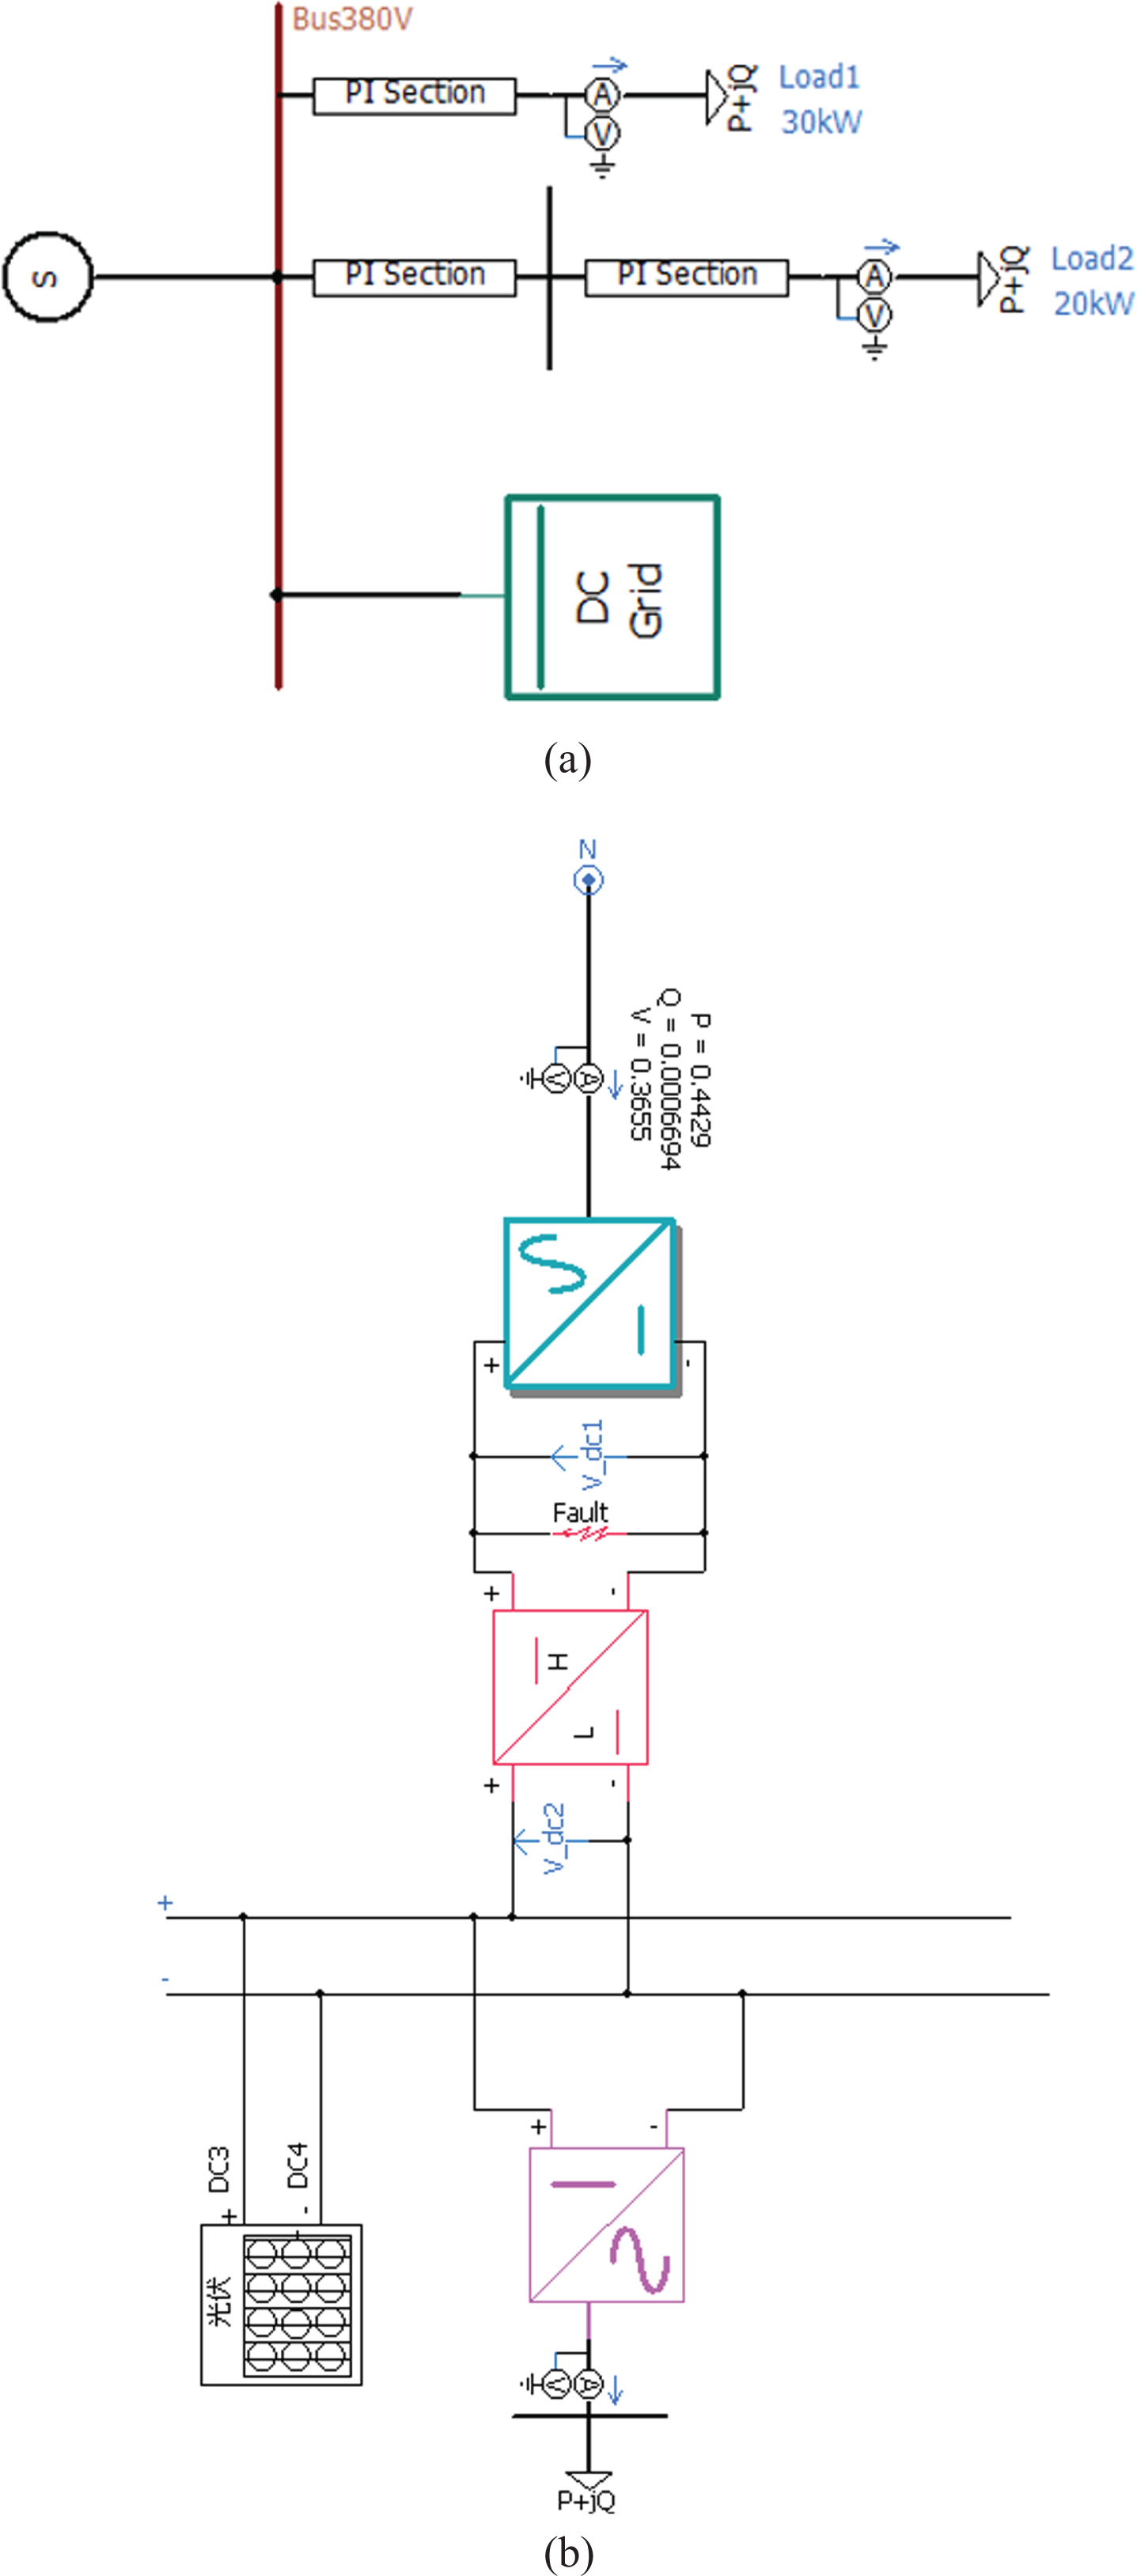
Power electronic model of DC distribution network. (a) AC / DC distribution network model (b) DC grid internal structure.
With the wide application of a large number of distributed energy high-density access and flexible transmission and other kinds of new power distribution equipment based on power electronic converter and the growing of distributed power sources, the increasing proportion of power electronic converter in the distribution network leads to the increasingly serious problem of ultra-high harmonics (within the range of 2kHz–15 kHz). It has become the main content of power quality research. Along with the popularization and application of power electronic technology and continuous introductions of distributed power, a series of power quality problems, such as power quality disturbance, voltage fluctuation, disturbance interaction, disturbance frequency transfer and so on, have emerged while changing the parameters and characteristics of the traditional power system source network load. The problem of ultra-high harmonic is also becoming more and more serious. Among them, the interaction of super high harmonics among multi converters, converter, cable and filter will further lead to series parallel resonance of super high harmonics. It is of great urgency and practical significance to carry out the research of high-order harmonics in distribution network based on power electronic technology and distributed generation.
According to the distribution network model built in Fig. 3, the voltage on the bus obtained after operation is shown in Fig. 4. In order to identify the influence of stable disturbance of power electronic equipment, the harmonic of steady-state voltage in Fig. 4 is identified.

Bus voltage diagram of distribution network.
In order to analyze the steady-state signal in the distribution network, the steady-state signal of the bus voltage in the distribution network as shown in the figure is extracted and analyzed, and the extracted steady-state signal is shown in Fig. 5(a). Among them, Fig. 5(b) –Fig. 5 (i) are the coefficients of each node after three-level decomposition of the wavelet packet of the bus voltage steady-state signal of the distribution network.
The frequency-domain analysis of each signal in Fig. 5 (b) –Fig. 5 (i) can obtain the corresponding spectrum curve as shown in Fig. 6.
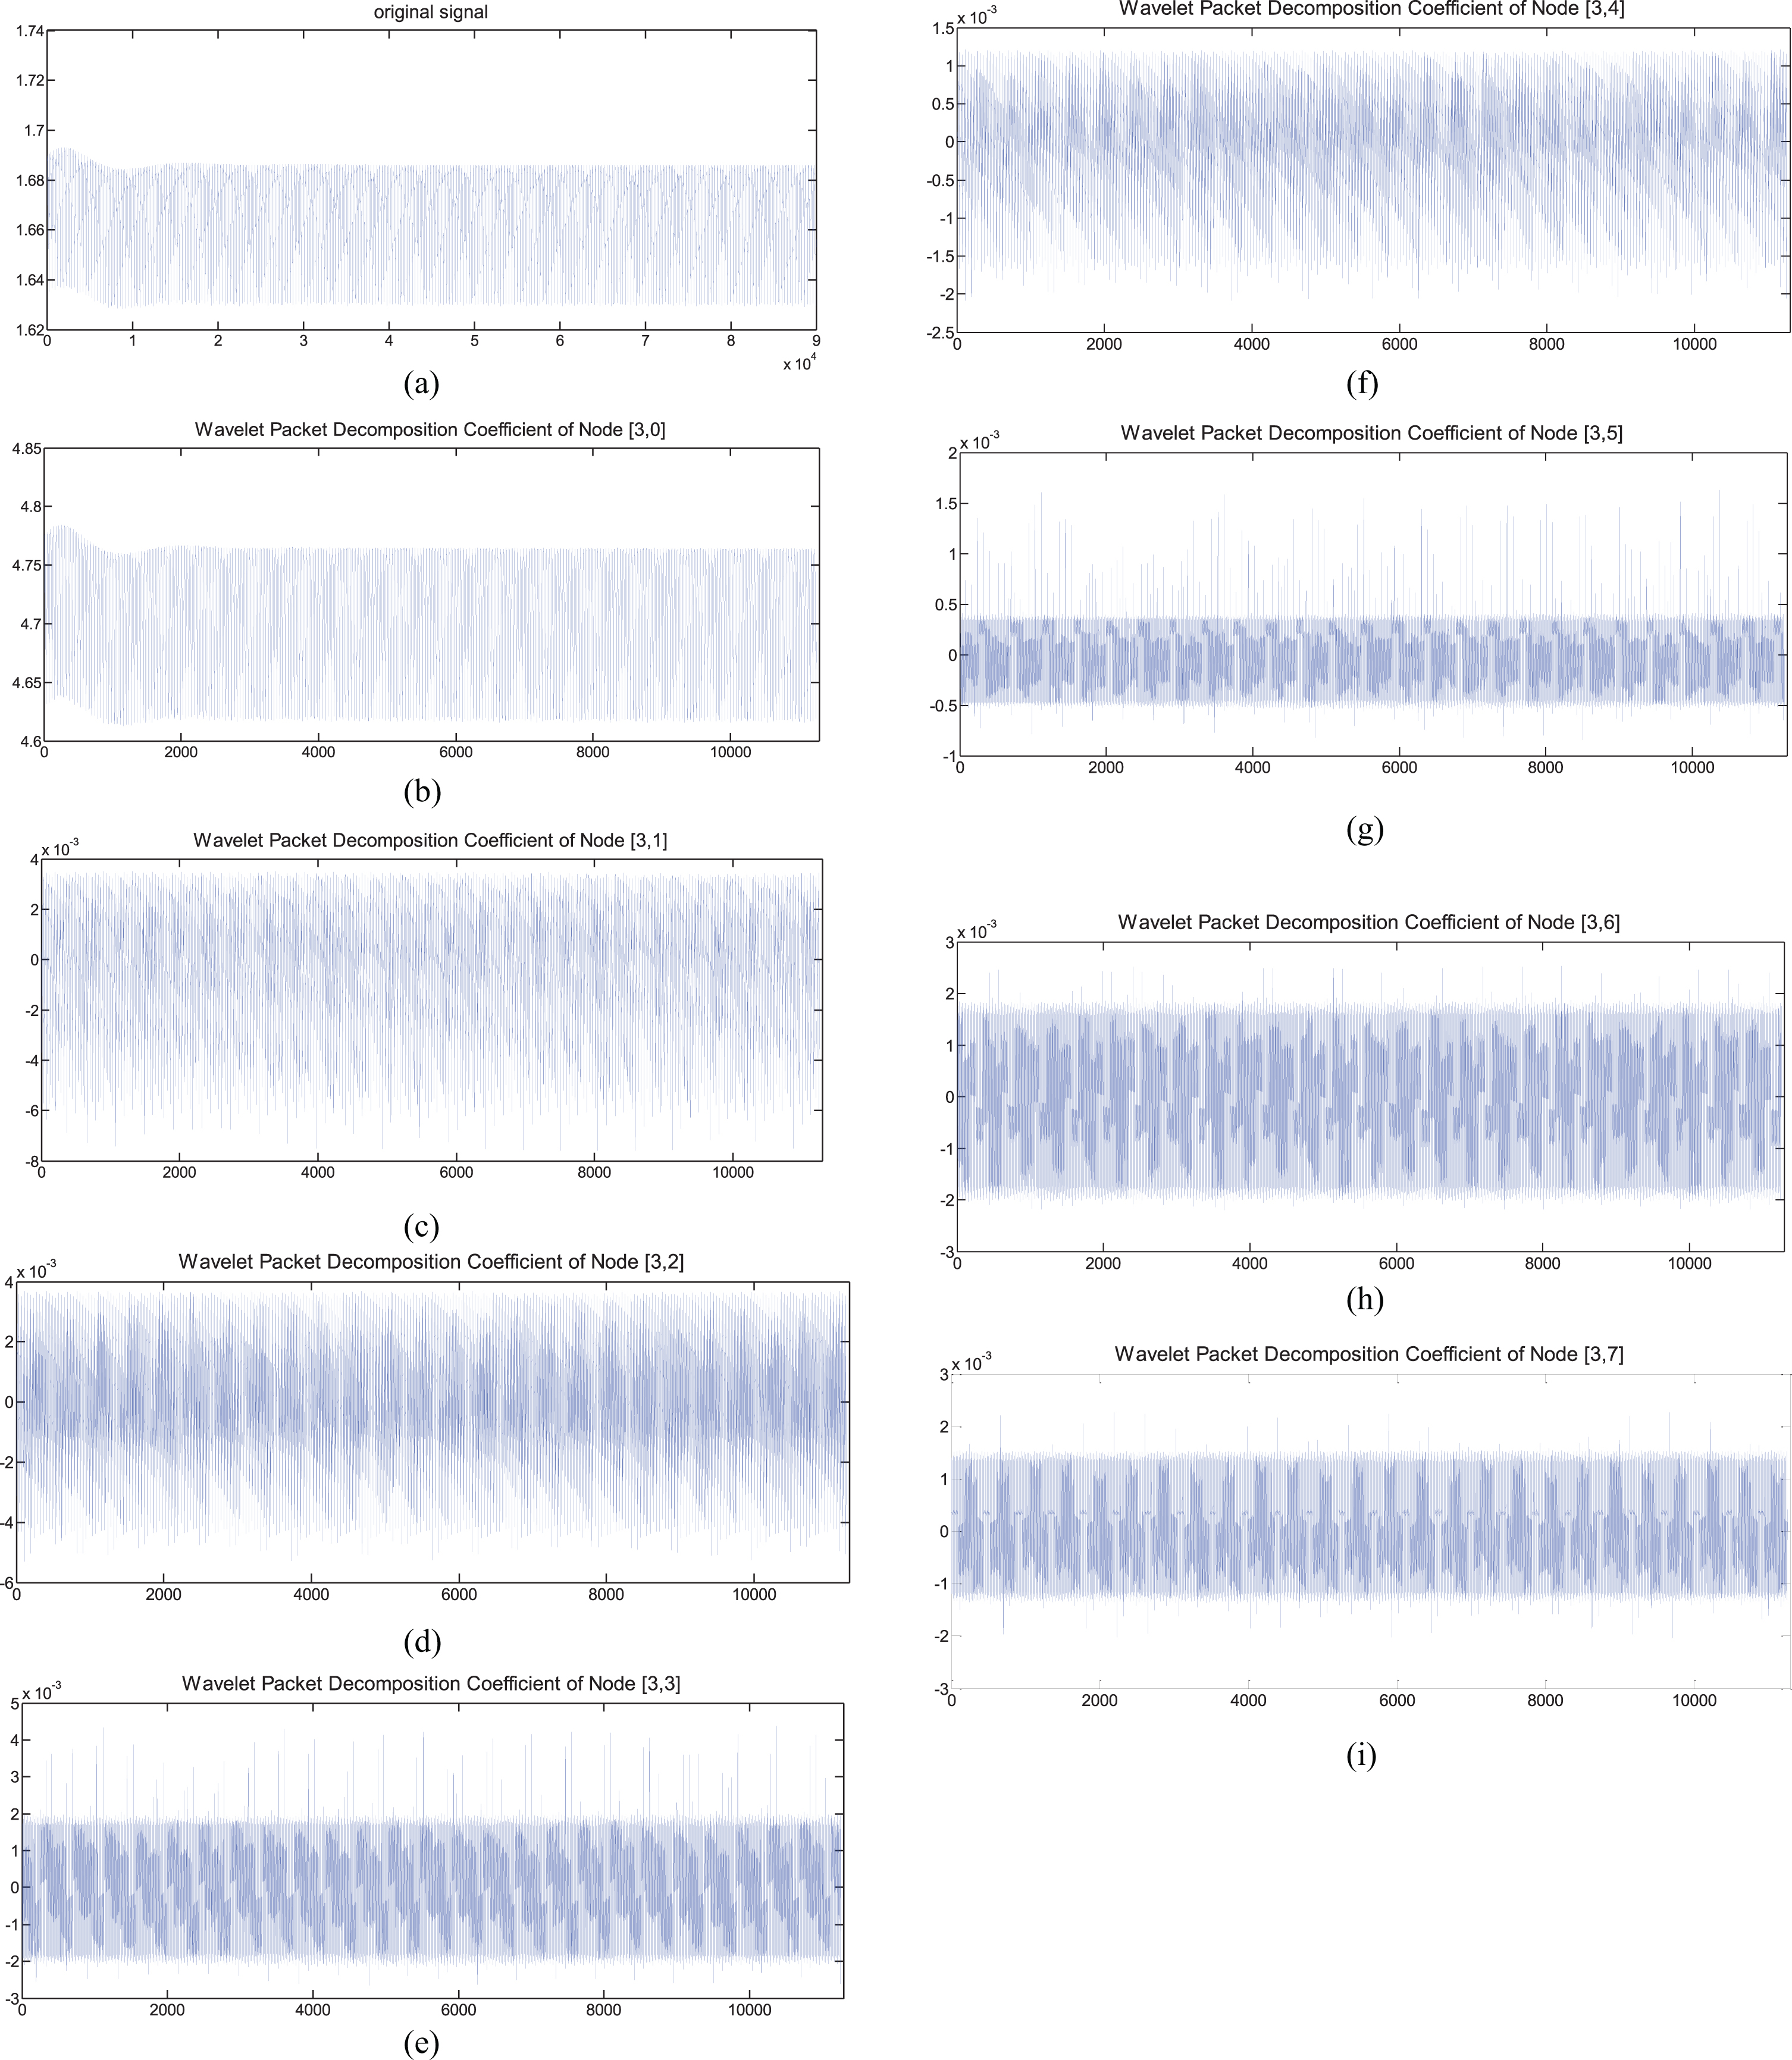
Wavelet packet decomposition of bus voltage. (a) original signal. (b) –(i) coefficients of each node of wavelet packet decomposition.
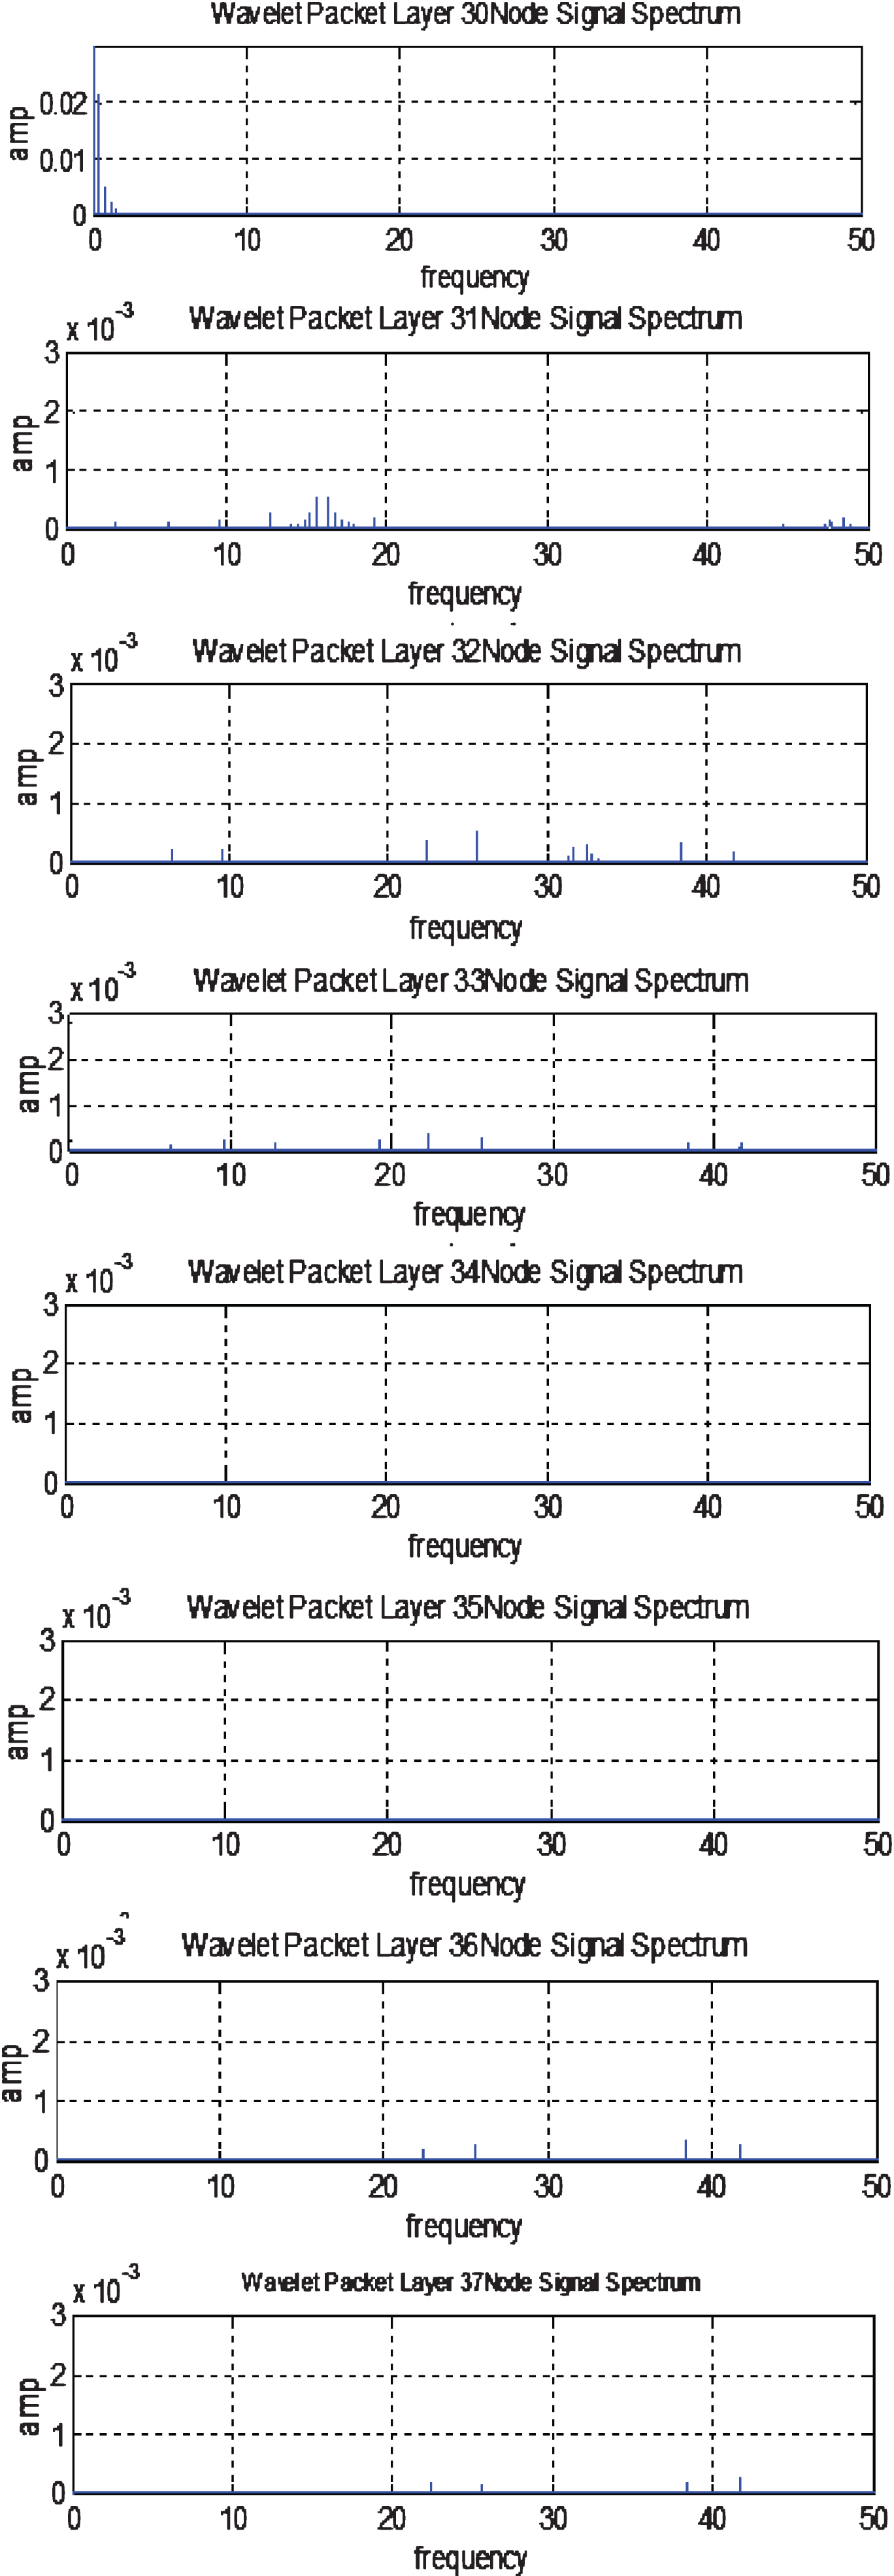
Spectrum of each node of wavelet packet decomposition tree.
The sampling frequency of the signal is 100 kHz. According to the sampling theorem, Nyquist’s sampling frequency is 50 kHz. Three layers are divided. The last layer is a frequency band. The interval length of each frequency band is the same, which is 50 / 8 = 6.25 kHz. As shown in Fig. 6, the 1st, 2nd, 3rd, 4th, 7th and 8th subgraphs in the figure have obvious frequency amplitude, and the corresponding frequency segments are: 0–6.25 kHz, 6.25 kHz–12.5 kHz, 18.75 kHz–25 kHz, 12.5 kHz–18.75 kHz, 43.75 kHz–50 kHz and 37.5 kHz–43.75 kHz. Among them, the amplitude in the first frequency band 0–6.25 kHz is one order of magnitude higher than that in other frequency bands. The optimal wavelet tree is the optimization of wavelet tree according to the principle of optimal entropy based on the wavelet packet decomposition. Its main feature is trying to make the decomposition have the maximum regularity and find out the inherent law of the signal. In signal analysis and processing, entropy is a measure of information regularity. The smaller entropy is, the stronger information regularity will be [15]. In the process of wavelet packet decomposition, if the entropy value of any decomposed node n in the generated wavelet tree is set as Ent(N), the corresponding nodes of the two groups of coefficients are N1 and N2 respectively. If E nt (N1) + E nt (N2) > E nt (N), then the decomposition of N-point will be cancelled. Otherwise, N1 and N2 will be kept as the sub nodes of IV. Then the N-point decomposition is cancelled. If not, N1 and N2 are kept as the sub nodes of IV. Finally, the optimal wavelet tree is used to extract the energy value of each surrounding sub node as the characteristic value of voltage signal. Compared with the wavelet packet decomposition, the optimal wavelet tree can not only find out the inherent characteristics of the signal more effectively, but also reduce the dimension of the signal characteristic.
The optimal wavelet packet tree after three-layer wavelet packet decomposition of bus voltage steady-state signal in distribution network is shown in Fig. 7. The coefficients of AAA3, DAA3, AAD3, DAD3, ADD3 and DDD3 nodes constitute the optimal wavelet packet tree coefficients of wavelet packet hierarchical decomposition of bus voltage steady-state signal in distribution network. The corresponding signal components are: (wavelet packet layer (30, 31, 34, 35, 36 and 37) node signal spectrum) in Fig. 6. It can be seen from Figs. 6 and 7 that the main coefficients constituting the steady-state signal of the bus voltage in the distribution network are the node coefficients in Fig. 6 (b) and Fig. C as shown in Fig. 6.

Optimal wavelet packet tree of bus voltage steady state signal in distribution network.
After the distributed generation is connected to the distribution network, it is likely to lead to harmonic pollution, voltage fluctuation and other power quality problems, which seriously affect the safety and reliability of the distribution system and the power supply quality of users. In this paper, the influence of DG access on the power quality of distribution network is taken as the research direction, and the influence of DG access on the power quality of each part of distribution network and the high-order harmonics caused by it are studied. Meanwhile, the research of super high harmonics is a fast developing field. A large number of harmonics injected into the power system not only harm its safe operation, but also bring economic losses. With the rapid increase of the capacity and quantity of the nonlinear load in the power grid, the condition of multiple harmonic sources coexisting is increased, and the dynamic characteristics of the parameters of the power grid, such as fluctuation and mutation, are also enhanced, which brings great difficulties to the identification of harmonic sources and the division of responsibilities. According to the characteristics of super high harmonics, this paper uses the combination of wavelet packet and Fourier analysis method to obtain the spectrum characteristics of super high harmonics, and uses the optimal wavelet tree 66 to analyze the main frequency of super high harmonics.
Footnotes
Acknowledgments
This article was supported by the Science and Technology Project of China Southern Power Grid Co., Ltd. under Grant YNKJXM20190910 and the Yunnan Applied Basic Research Project under Grant Number 2017FB091.