
Abstract
This study proposes a framework implementing triangular estimation for better modeling and forecasting time series. In order to improve the performance of estimation, we employ two sources of triangulation to generate a time series, which is statistically indistinguishable with the latent time series hidden in a system. Thanks to Bayesian hierarchical estimation, which is akin to deep learning but more sophisticate and longer history, the framework has been validated by a large amount of records in vegetable auctions. The hierarchical Bayesian estimation and Monte Carlo Markov Chain particle filters used in hidden Markov model are appreciated during the massive bootstrapping of data. Our results demonstrate excellent estimation performance in discovering hidden states.
Introduction
Challenges exist in the implementation of agriculture planning. Most farmers believe effective planting is impossible because uncertainty, crisis, and risk cannot be foreseen and accommodated. Additionally, the planting season leaves no much flexibility because each crop has its own life cycle, which cannot be altered easily. Market prices also fluctuate after a massive yield destruction because of natural disasters. Interestingly, market prices may fluctuate without obvious reasons. Most farmers believe a well-planned cultivation scheme can only be possible if the future market prices and harvest yield rates are fixed over a long period. However, such a situation is impossible in reality.
Additionally, unlike the business practices in most industry, agriculture produce as much larger deviation than other products do. Price is mostly determined by auction markets through a quasi-relation of demand-supply-price. Factory planning can be done against a set of customer orders with pre-negotiated prices. In the agriculture business, an ordinary farmer may not expect the produce can be bought in a promised price without a preset contract. Instead, farmers guess future trends of prices through a history of transactions. Without the help of scientific management, farmers mostly gamble in low bet efficiency. Because all farmers look at the same price history, they may make the same ‘optimal planting decision’ in choosing variety and quantity. This excessive over-supply usually makes produce price plunge. Whenever a loss is encountered, the government is obligated to allocate tax money to subsidize the losses, and consumers must buy produce in high prices. That is, the inefficiency of management has not been properly handled in agriculture business.
Figure 1 manifests the motivation of this study. The graph shows the transaction quantity (upper blue line) and price (lower red line) for sweet potatoes in four consecutive years. The supply quantities oscillate yearly and prices response reversely. Apparently, the most profitable timing is unlikely at the high and low peaks of production. An experienced farmer usually uses their intuition to guess a right timing and quantity for their cultivation plan. Traditionally, because of multiple constraints imposed by the natural characteristics of crops, such as weather, temperature, and scale of economies, people mistakenly believe that they have limited ability to forecast the future demand of crops.
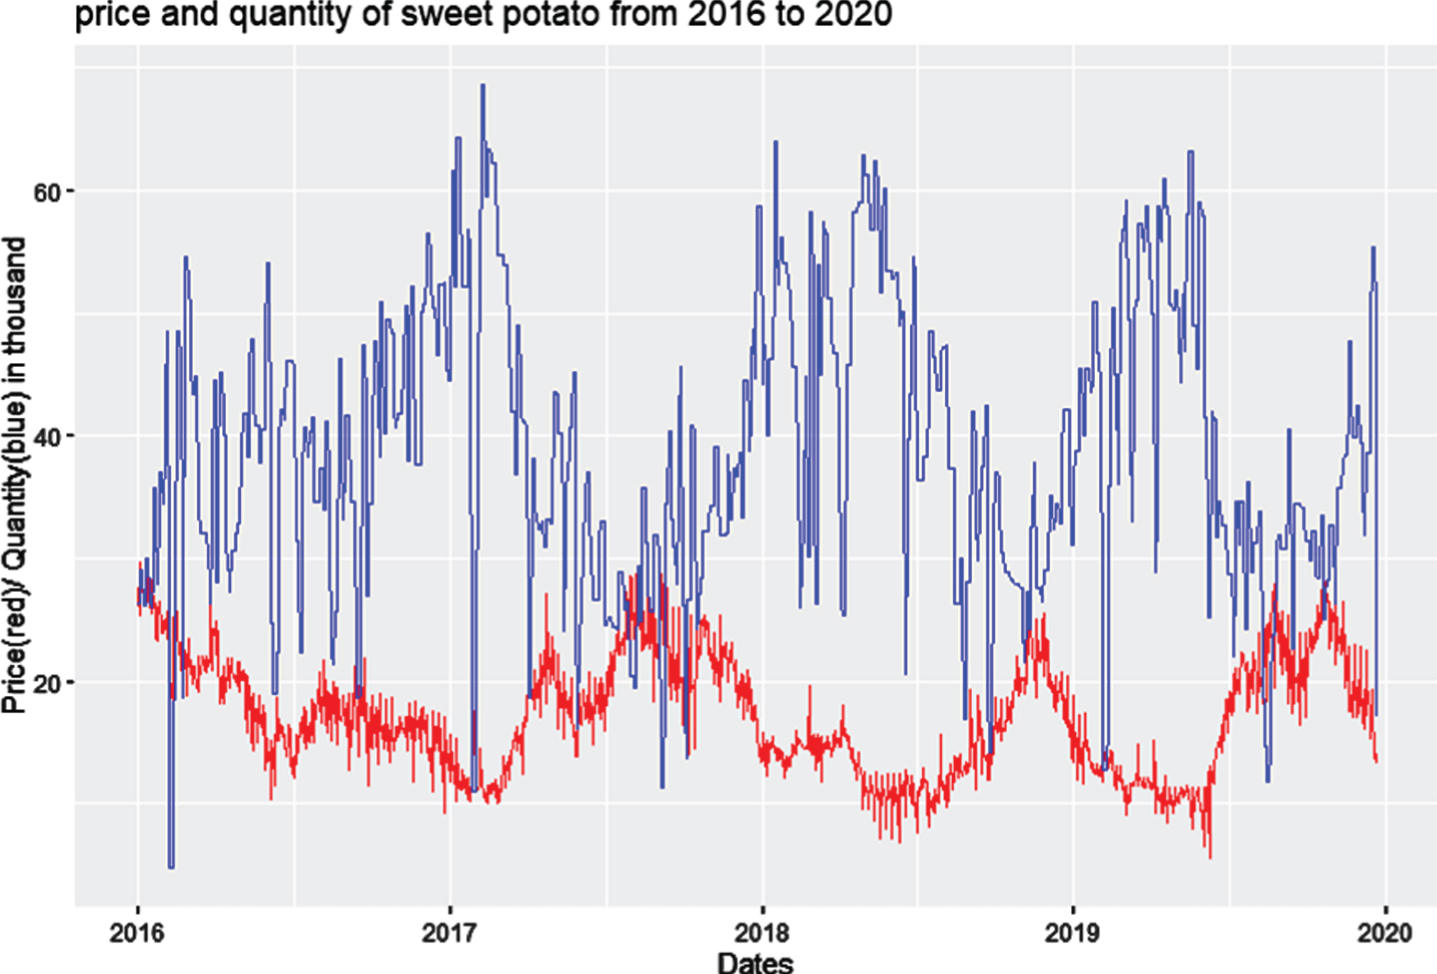
Transaction quantities and price for sweet potatoes in four consecutive years.
According to farmers’ intuition, or a long-established cobweb theory, this paper aims to perform an accurate forecasting to future crop production. Under the same goal of our research objective, this study answers several research questions. If farmers plant an increased number of crops if they envision an increase in the probability of high demand and high profit, how the future crop production affects by this factor? If this intuition is toward the right direction, can scientific approaches help farmers avoid mistakes and improve their managerial yields.
This study is related to three streams of literature. We are mostly concerned with business and practical aspects of the agriculture supply chain as well as with the mechanism to make the system sustainable. To make the research practical, big data analytics and deep learning in generative models are investigated. Stochastic behavior is investigated to tackle uncertainty in agriculture activities.
Agricultural forecasting
Forecasting from real-world data requires intensive amounts of learning effort and involves time-dependent statistic techniques. For this reason, this study exploits machine learning in the stochastic process and in stochastic modeling, that is, system identification or, in other fields, parameter identification. Recent advances in applying stochastic machine learning in demand forecasting include nonparametric forecasting, time-frequency feature extraction for nonparametric estimation, data assimilation in model-based forecasting, and noise reduction in the sourcing time series. Ref. [1] reviewed methods of data assimilation for stochastic decision making when data comes from multi-sources.
Nonparametric forecasting has been studied for a long time. Ref. [2] proposed a Bayesian wavelet network approach for nonparametric regression. Ref. [3] employed wavelet decomposition to perform nonparametric forecasting, and Ref. [4] performed nonparametric forecasting by using a functional wavelet kernel. Ref. [5] estimated parameters of service-dependent demand in a multi-period newsvendor using statistical learning methods. Ref. [6] investigate the influence of uncertainty in agriculture business.
Forecasting in artificial intelligence
The Bayesian approach lies in the center of all kinds of statistical methods. Algorithms based on Markov Chain Monte Carlo (MCMC) methods recently became the convention in statistical machine learning. To estimate joint probability densities, hierarchical Bayesian learning and MCMC methods were used in the algorithm. MCMC methods represent a broad range of integration techniques and can approximate a multidimensional integral by generating samples through an ergodic Markov chain. This chain ensures the generated samples converge to the desired distribution according to the ergodic theorem.
Data assimilation
When data come from versatile sources or granularity, an elaborate tool is needed to fuse the data. The concept of data assimilation originated from geosciences, which is now a well-developed discipline for a wide variety of fields. Ref. [7] explained the fundamental Bayesian statistics used in data assimilation, including ensemble Kalman filtering, MCMC sampling, and hierarchical Bayesian modeling. Ref. [8] reviewed the stochastic processes in data assimilation, which inferences high-quality data measurements based on the frequent low-quality observations and rare accurate observations.
Data assimilation mostly handles sequential problems, and hence a tractable algorithm is needed for computational feasibility. Ref. [9] conducted an importance sampling using the Monte Carlo method, or the so-called particle filters to approximate Bayesian updating in the large space of posterior probabilities. Ref. [10] simultaneously performed state-space and parameter estimations on the same time by using an ensemble Kalman filter. Ref. [11] applied a convolution particle filter to estimate unknown parameters in state-space representation.
To fuse the data from multiple sources perfectly, advanced statistical techniques are needed. Ref. [12] proposed a data fusion-based risk assessment framework for human health by using Dempster-Schafer theory and system biology approach. The research of agricultural time series methods has been established. Ref. [13] employed a filter approach to solve an e-waste recycling supply chain planning problem with the advantage of fault tolerance.
Proposed framework
This study uses partially observed Markov process (POMP) models as a fundamental computation platform. The models are also known as hidden Markov models (HMM) or state space models, which are powerful for time series analysis. The model includes a vector of observable measurements and internal states of unobservable process, which could both be contaminated by noises. POMP can be considered a generalization of a mixture model, where the hidden or latent variables, which control the mixture component to be selected for each observation are related through a Markov process, rather than being independent of each other. The internal Markov process may be characterized by a transition density distribution, while the mapping from the internal states to external observations can be specified through measurement density distribution. We focus on Monte Carlo statistics, where the process and noises are nonlinear and non-Gaussian.
Forecasting requires an intensive amount of learning efforts in estimation and involves time-dependent statistics techniques. As such, we cannot expect to capture the original data generation process perfectly in a designated model. That is, the knowledge to perform forecasting is not exact. On the other hand, model-less or synthesized approximation could be a suitable complement in this regard. However, the pure fitting method often suffers from over-fitting problems when the sampling or training data is not comprehensive enough. The popular ten-fold verification method only relies on a partial sampling from the entire space. Hence, a good fitting result may not apply to the newly acquired test dataset. We apply a hybrid method to adopt the advantages of both model-based and model-free approaches.
Data assimilation refers to the quantitative methods by which the observations of variables are combined with system behaviors to provide estimates of internal states and key parameters. Data assimilation applies sparse observed information to estimate system internal states by making assumptions based on that the system behaviors are typically governed by a set of pre-defined equations or statistical models. Through the help of Bayesian methods, forward system equations, and some observations, some unmeasured data can be readily estimated without knowing the detailed parameters which will gradually be estimated via the assimilation process. The parameters of the pre-defined system need not be known in advance and they can be estimated while the assimilation proceeds. The application of assimilation can therefore significantly reduce the measurement required.
Demand estimation
Despite the inverse problems from the multi-scale modeling being ill-posed, backward inferences become possible through recently developed Bayesian techniques. Through solving the inverse problems, we can obtain hidden states, cause-effect relations, missing values of measurements, and consequences of controls. A suggested treatment can therefore be derived once all internal states are clear.
The estimation of the unmeasured demands needs not be accurate nor from a single measuring source. True demand can be estimated in insufficient information. New evidences can be derived from observations that result from the common causes. Solving a parameter estimation problem is highly complicated and mostly nonlinear and combinatorial. Combining recent advances in machine learning and stochastic achievements offer an excellent means to achieve the goal. In the classification work, the adaBoost classification algorithm successfully combines the merits of multiple algorithms to tackle the challenges. In this paper, the machine learning work is supported mainly by the high-efficiency MCMC and a regression tree through adaBoost.
To estimate the joint probability densities, the hierarchical Bayesian learning and MCMC methods were used in the algorithm. The MCMC methods represent a broad range of integration techniques and can approximate a multidimensional integral by generating samples through an ergodic Markov chain, thereby ensuring that the generated samples converge to the desired distribution based on the ergodic theorem.
Training algorithm
In the regression tree, the regression is boosted by an algorithm of decision tree. Given a set of data (x1, c1) , ⋯ , (x
n
, c
n
) with input predictor x
i
∈ X ⊂ R
p
and output response c
i
in a finite set C ={ 1, ⋯ , L }, we want to find a classification rule Γ (x) ↦ c that minimizes the misclassification error rate
As shown in Fig. 2, the key variables are subject to be hidden from being observed. For example, in our application, the demand of agriculture produce is not observable in the auction market data. However, we can “guess” a possible demand from transaction quantity and price. In Fig. 2, we apply the triangulation assimilation and estimate the hidden demand from the evidence E and observation O.
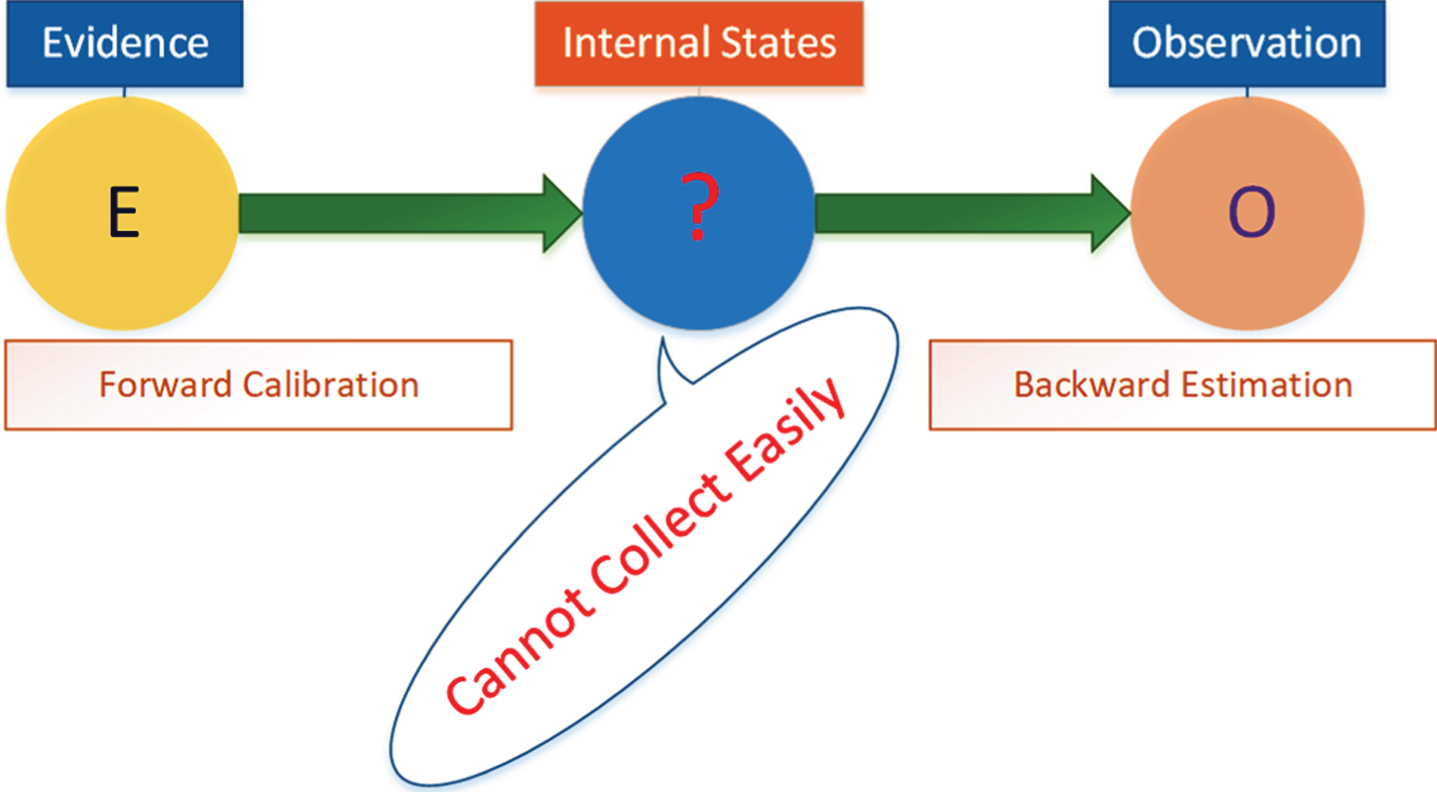
Our proposed triangulation assimilation algorithm.
In a simple model, the market prices are determined by the rules of a demand-supply relationship. Farmers have heterogeneous expectations concerning product prices and update their beliefs according to common climate estimations and to market conditions [15].
A comparison to conventional methods
In Fig. 3, traditional linear context of time series analysis was tested first. The testing data in this study was acquired from the auction market governed by Taiwan agriculture and food agency. On the graph, the time series of transaction quantities are decomposed into seasonality and stationary parts for celery. We can obvious see the year periodicity for the crop.
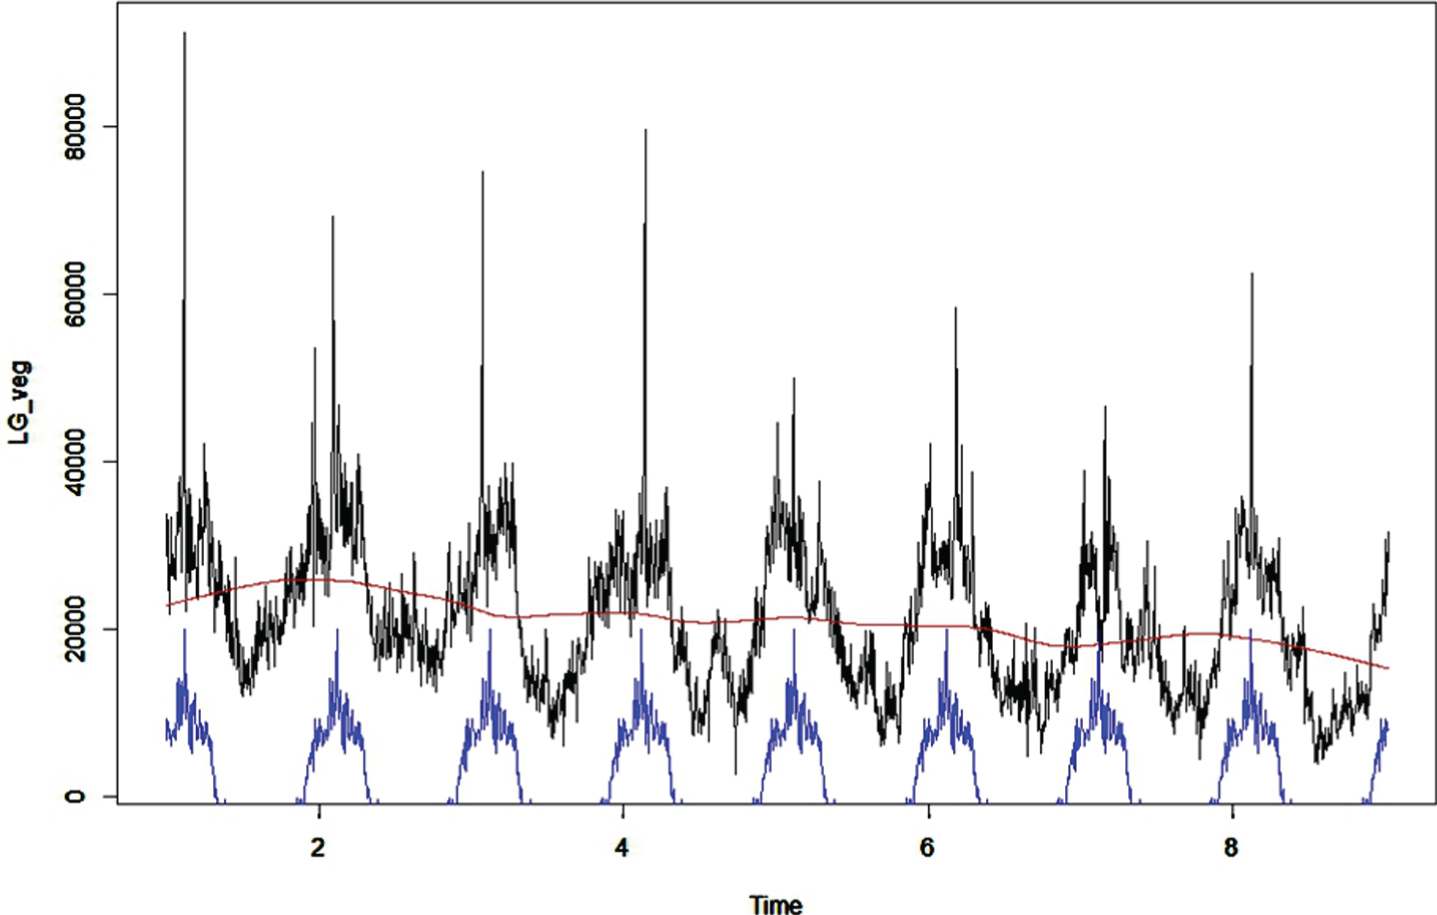
Seasonality decomposition of time series Datasource: http://amis.afa.gov.tw/main/Main.aspx.
With stationary time series, we tried on a forecasting using a conventional Holt-Winters algorithm, as shown in Fig. 4. The confidence interval becomes wide as time goes by for this one-step forecasting method.
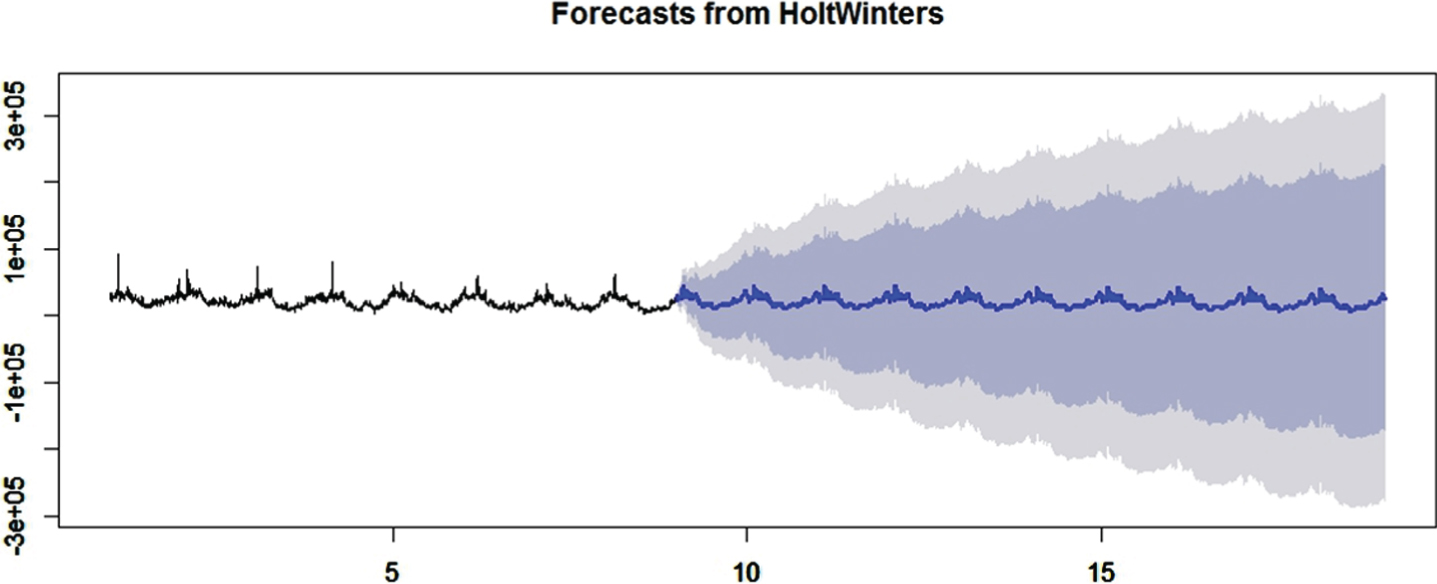
The one-step forecasting in Holt-Winters.
Our assimilation method predicts the entire time series at once. The prediction was made in a model with identified parameters through training time series. After obtained the parameters, we then simulate a new time series in eight years.
We first try to match the price as a Gompertz process. The model postulates that the random value of the next time step, Xt+1, depends on the value at time t with a tendency coefficient K and decaying constant r The observation values Y t are lognormally distributed and are subject to an error in measurement. The internal process carries an independent and identically-distributed (iid) lognormal random variable ɛ t ∼ Normal (0, σ2).
Therefore, the process is given as
As shown in Fig. 5, the upper subgraph is the original price data and lower graph is the simulated celery prices. The newly simulated series are generated based on the same set of parameters. The two series need not be point-wisely matched but they should share the same statistical properties. However, the series still look similar in the first three years (1000 days). With this Gompertz model, we can forecast the corp’s future trend by estimating the model’s internal parameters and the values of random errors.
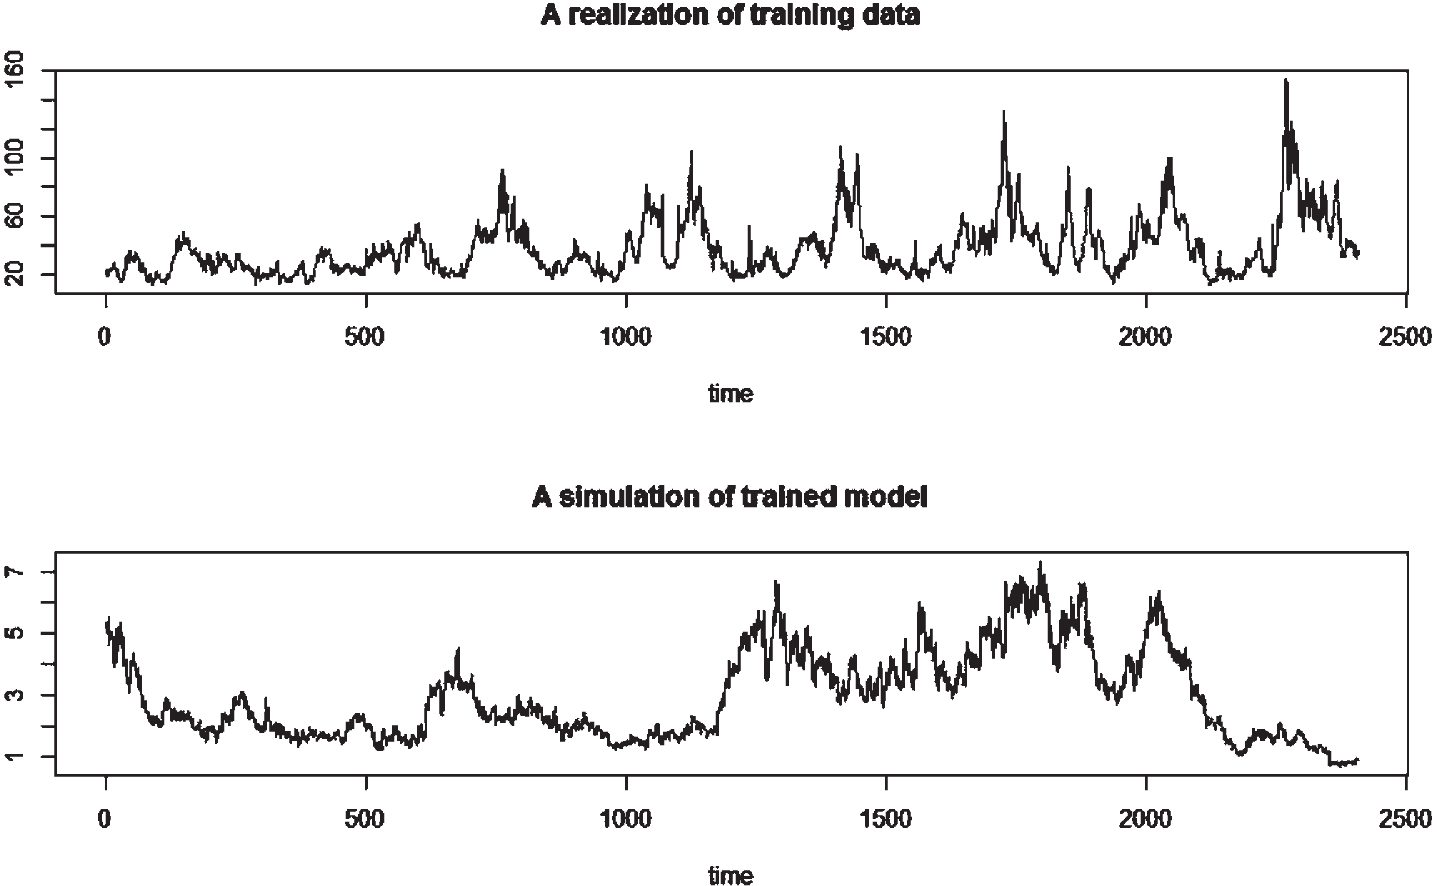
Prediction of celery prices in eight years.
By taking transaction quantity as independent variables for additional evidence in the triangulation, we can obtain a well-matched simulated series for celery prices, as shown in Fig. 6.
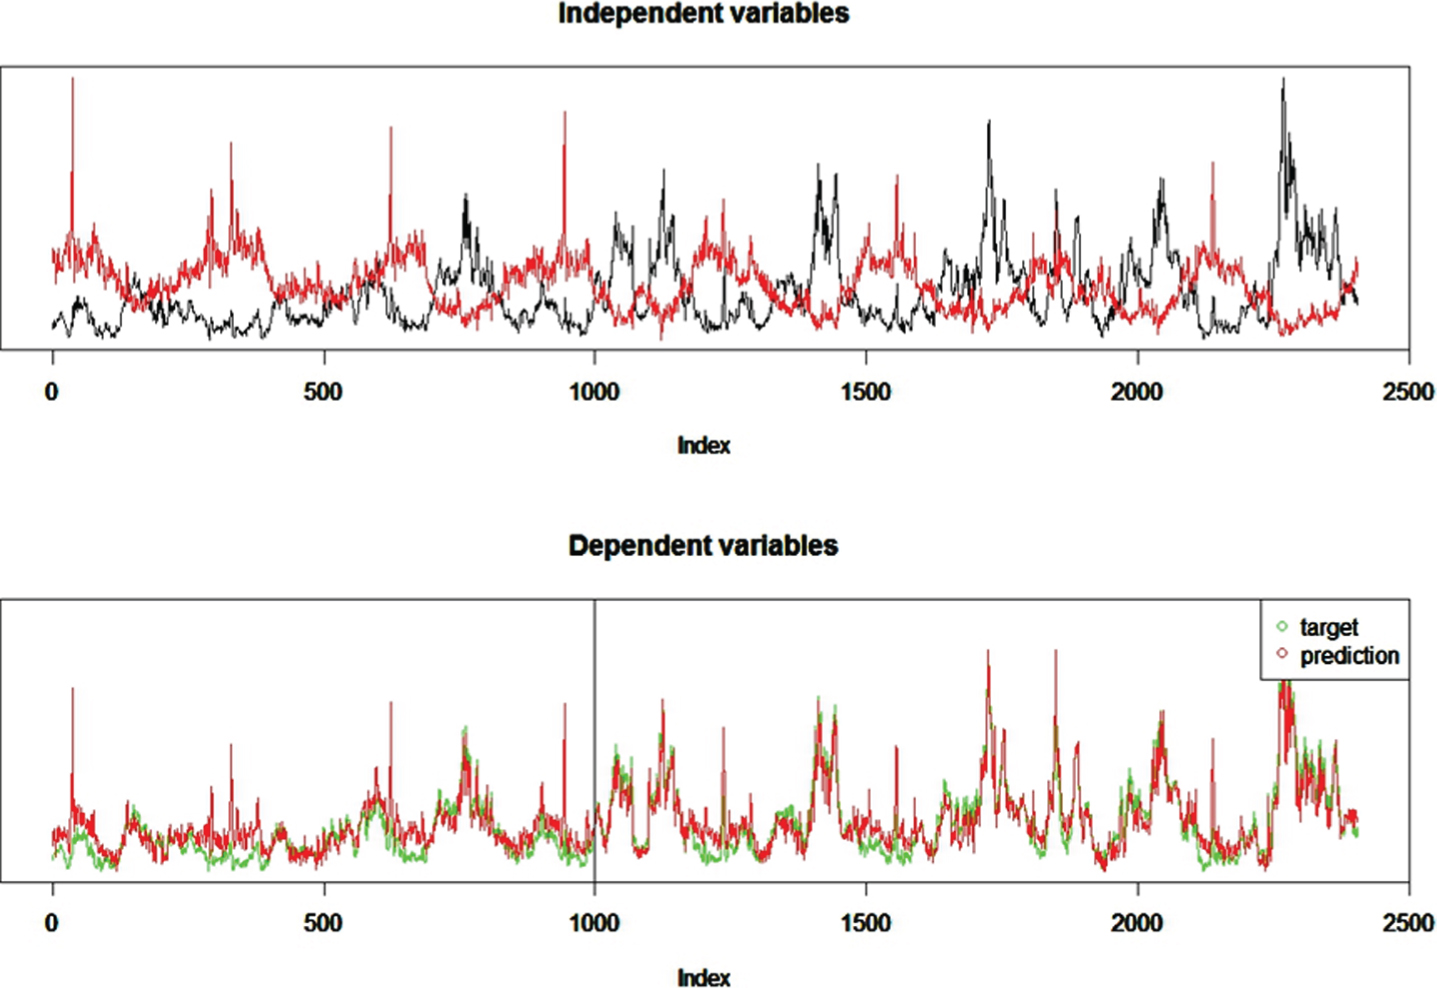
The price prediction in triangular estimation.
We then next test our proposed algorithm on triangulation assimilation from two sources.
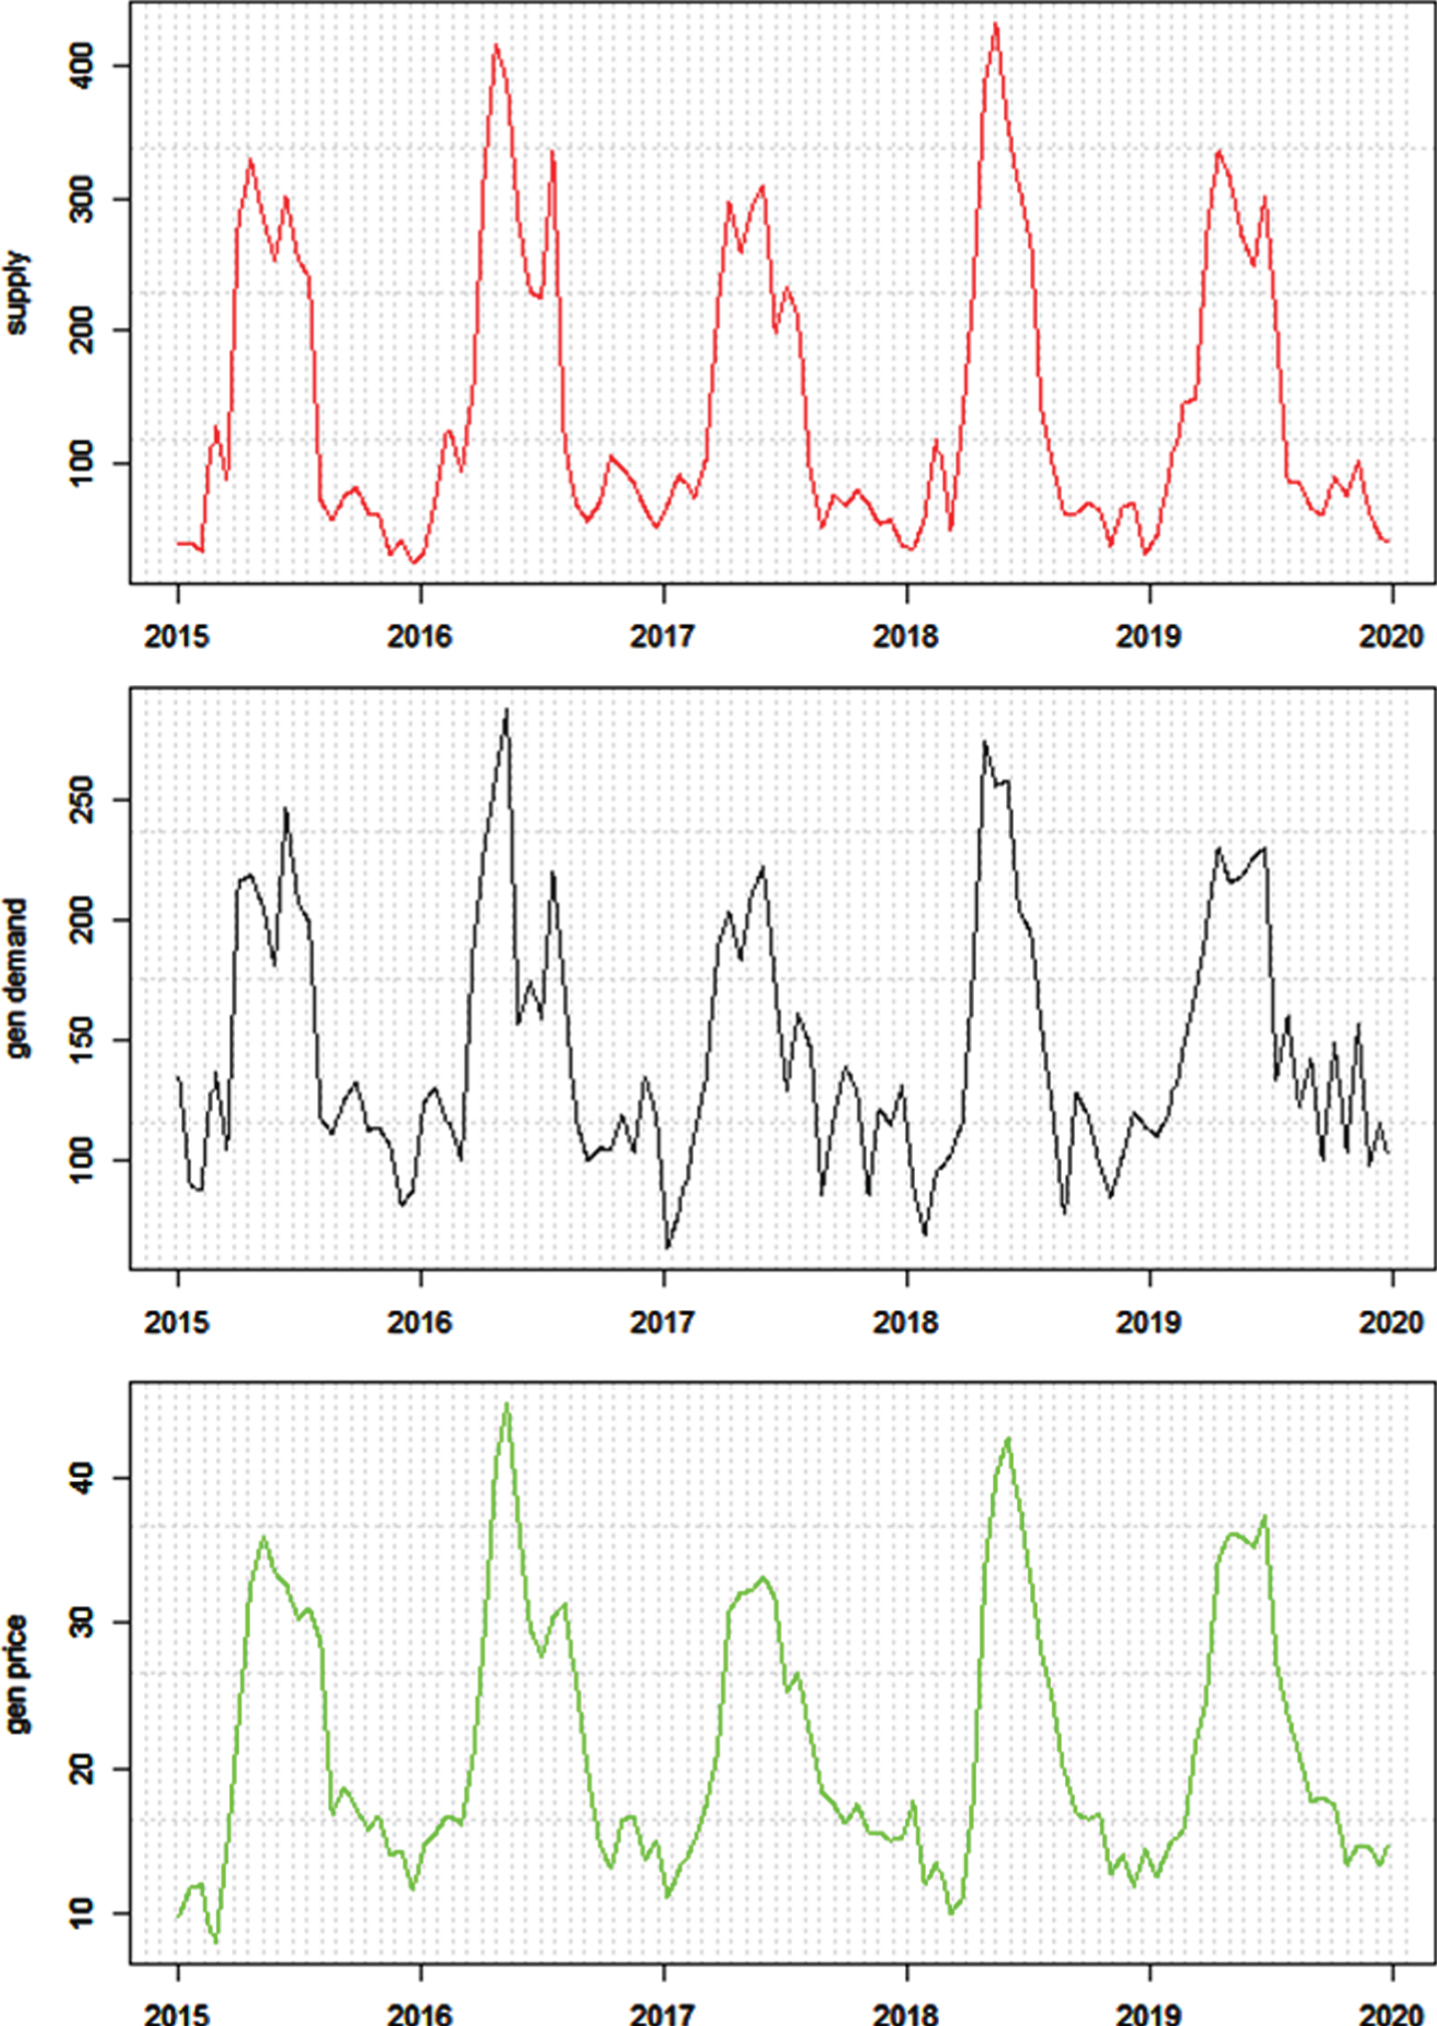
Given the transaction quantity as supply and the observable transaction price, we estimate the demand as shown in Fig. 7. We use forward model to infer demand series and then use price to match the estimated demand in backward model. The forward is formulated as an ordinary autoregression moving average series ARMA (2,1) with heterogeneous variable: supply. The backward model also formulates the demand as a time series but use the difference between supply and demand as an influence driver for price change, which shown in the forth subgraph of Fig. 7. The ARMA parameters converge well as shown in the fifth subgraph of Fig. 7.
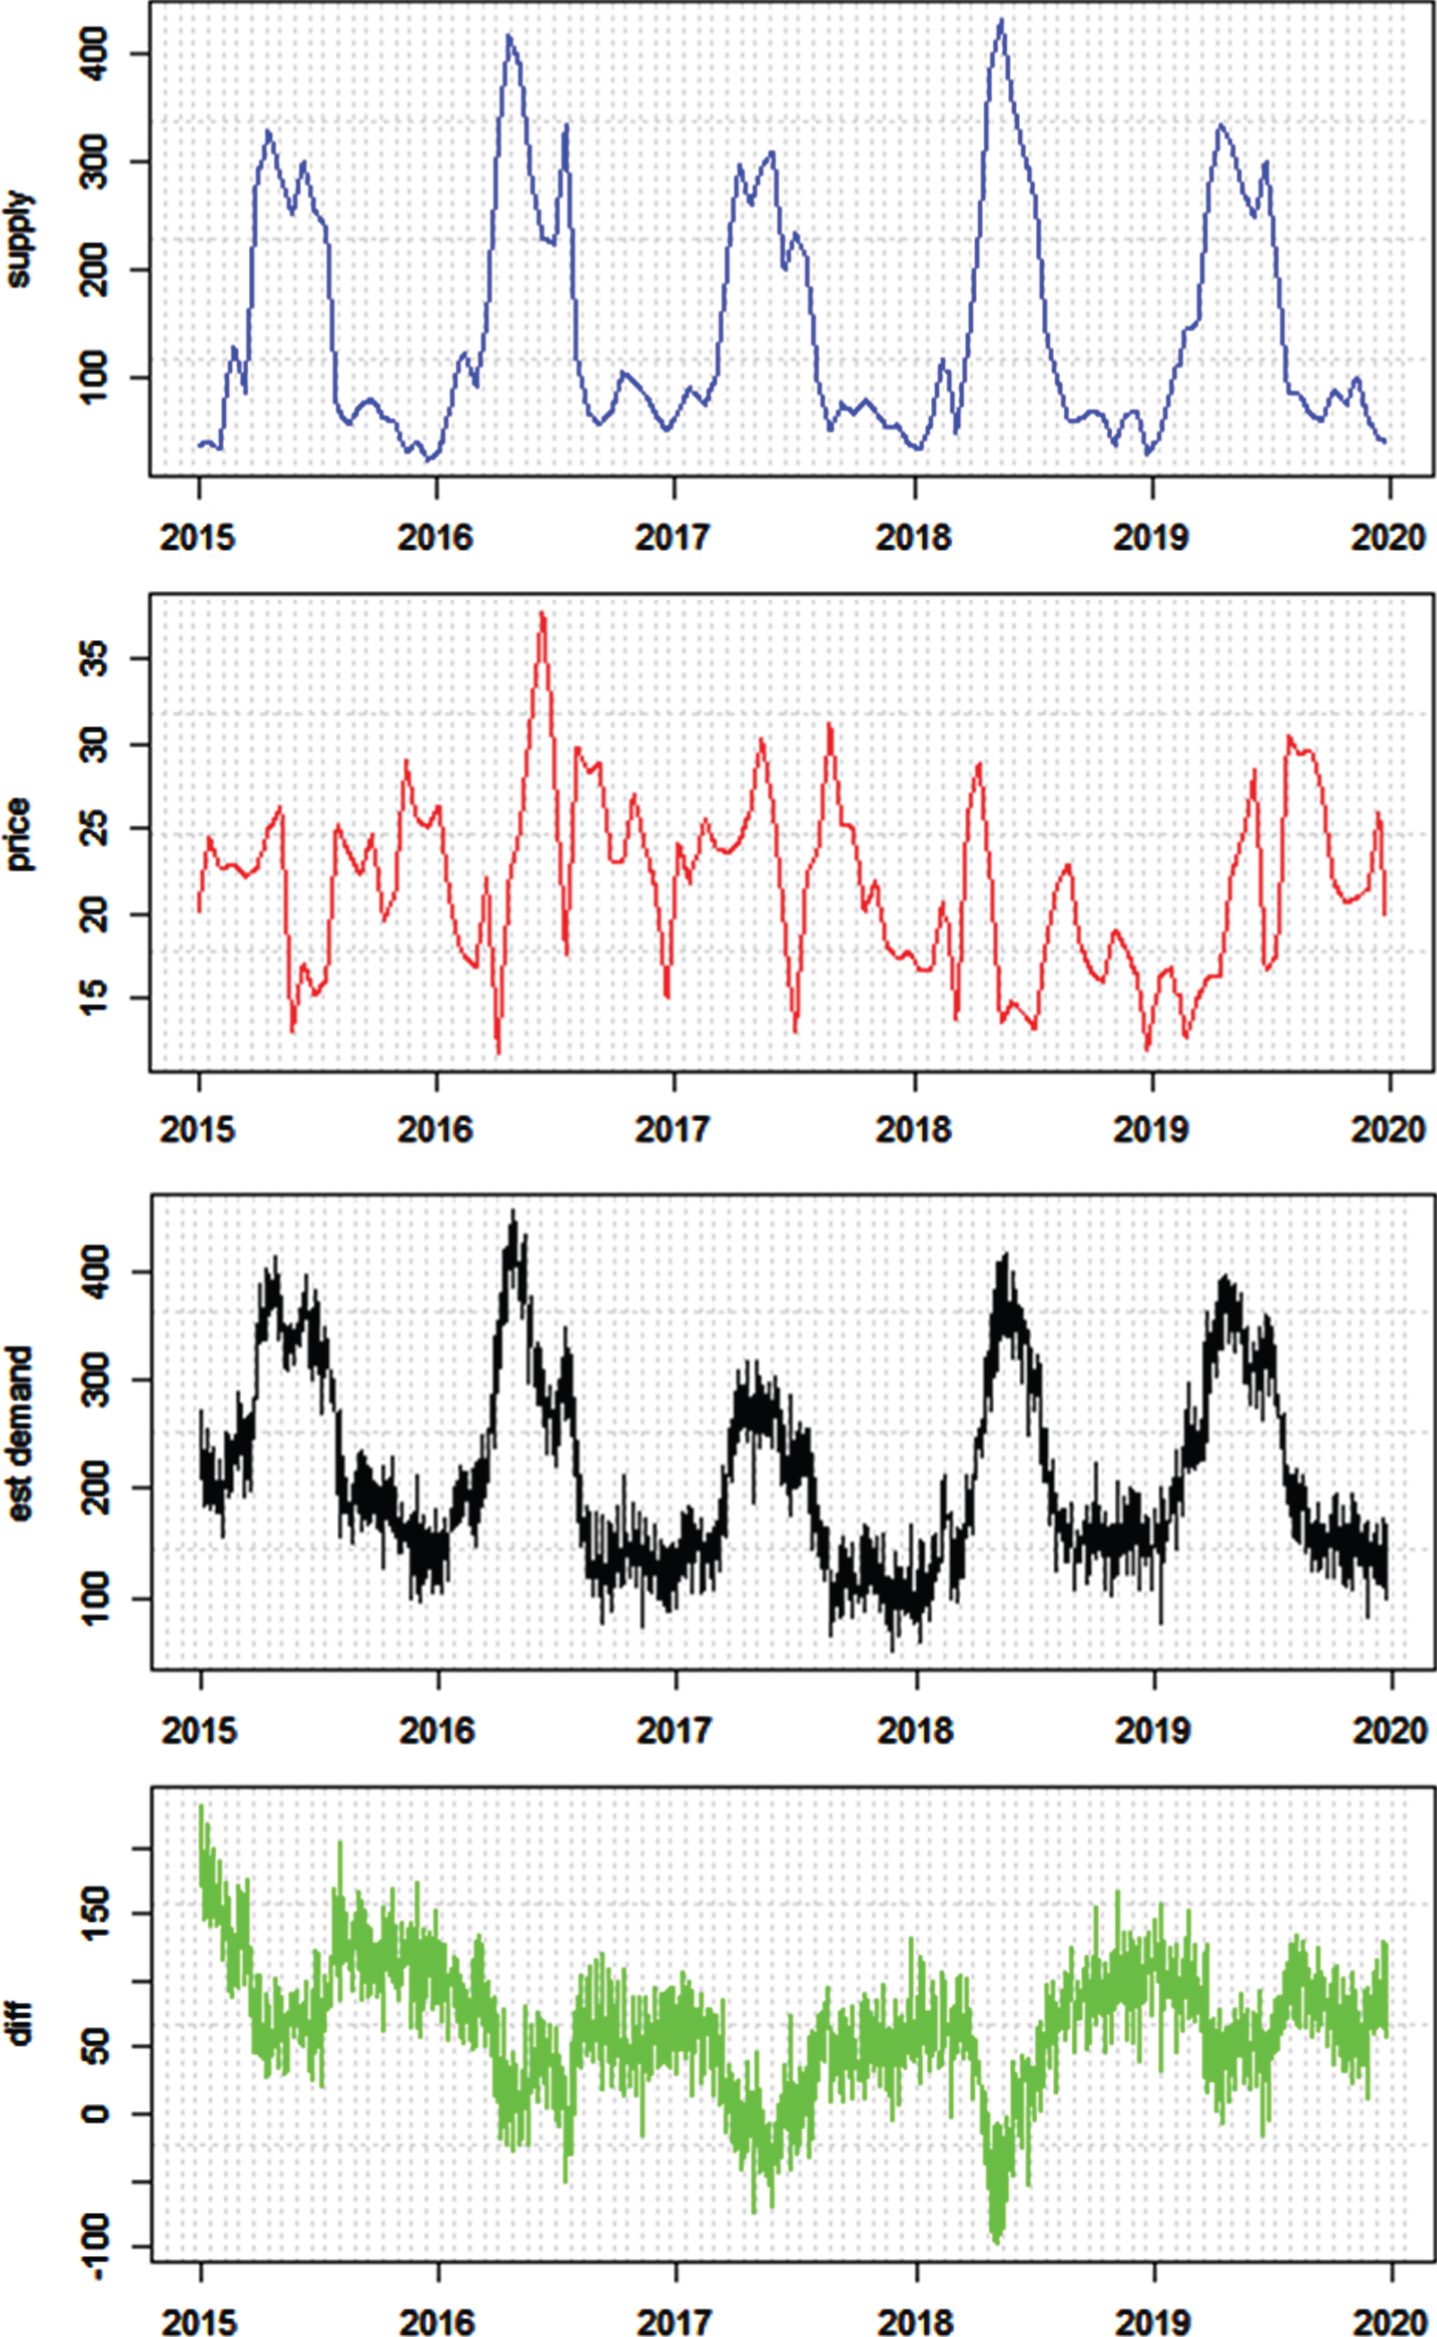
Parameter estimation and prediction in triangular estimation for the demand of pineapple from 2015 to 2019. The unobserved demand states are estimated for the entire 5 years.
The estimated demand in Fig. 7 has difficulty to verify the fidelity of estimation. This situation is common in many real-world applications, because hidden states, such as mind activities or purchase intentions, cannot be easily recorded. In our triangulation framework, we use a generative approach to verify our algorithm. As shown in Fig. 8, instead of collecting ground truth data, we simulate the internal data Sknown and compare the difference to Sestimated, in order to prove the correctness of prediction algorithm and parameters.
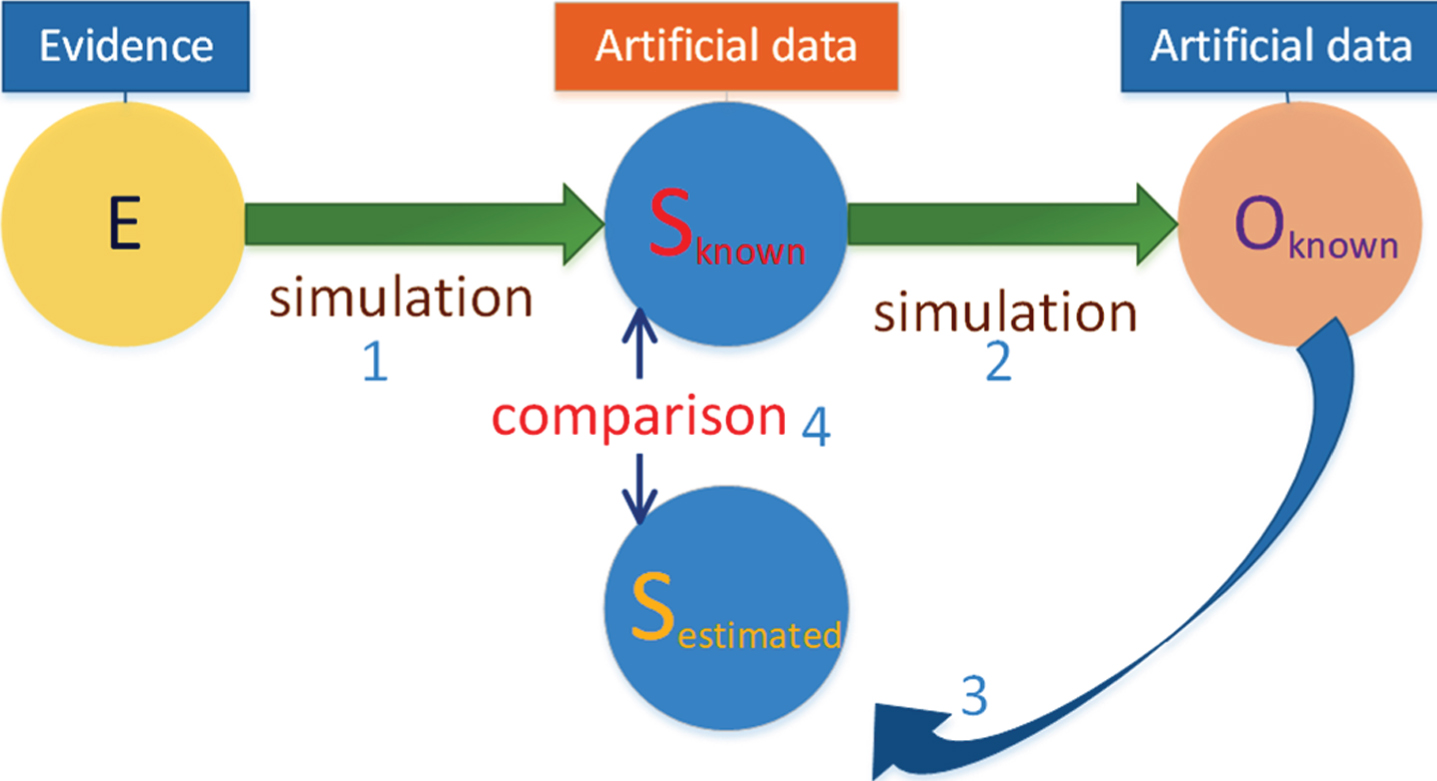
The generative framework to verify our triangulation estimation algorithm.
Because we artificially generate the demand series (Sknown), we must generate the price series (Oknown) as well. The Oknown in Fig. 8 is generated in the third subgraph of Fig. 9.
The generated time series of the triagulation frameworks. The series in the subgraphs are (E), (Sknown), (Oknown) from the top to the bottom.
Taking the step of triangulation assimilation again for the artificial series, we obtain a re-estimated demand series in the second subgraph of Fig. 10. The re-estimated demand is indeed akin to the artificial “ground truth” and the mean relative difference between the two series is 0.16. Therefore the triangulation assimilation performs well in estimating the hidden states.
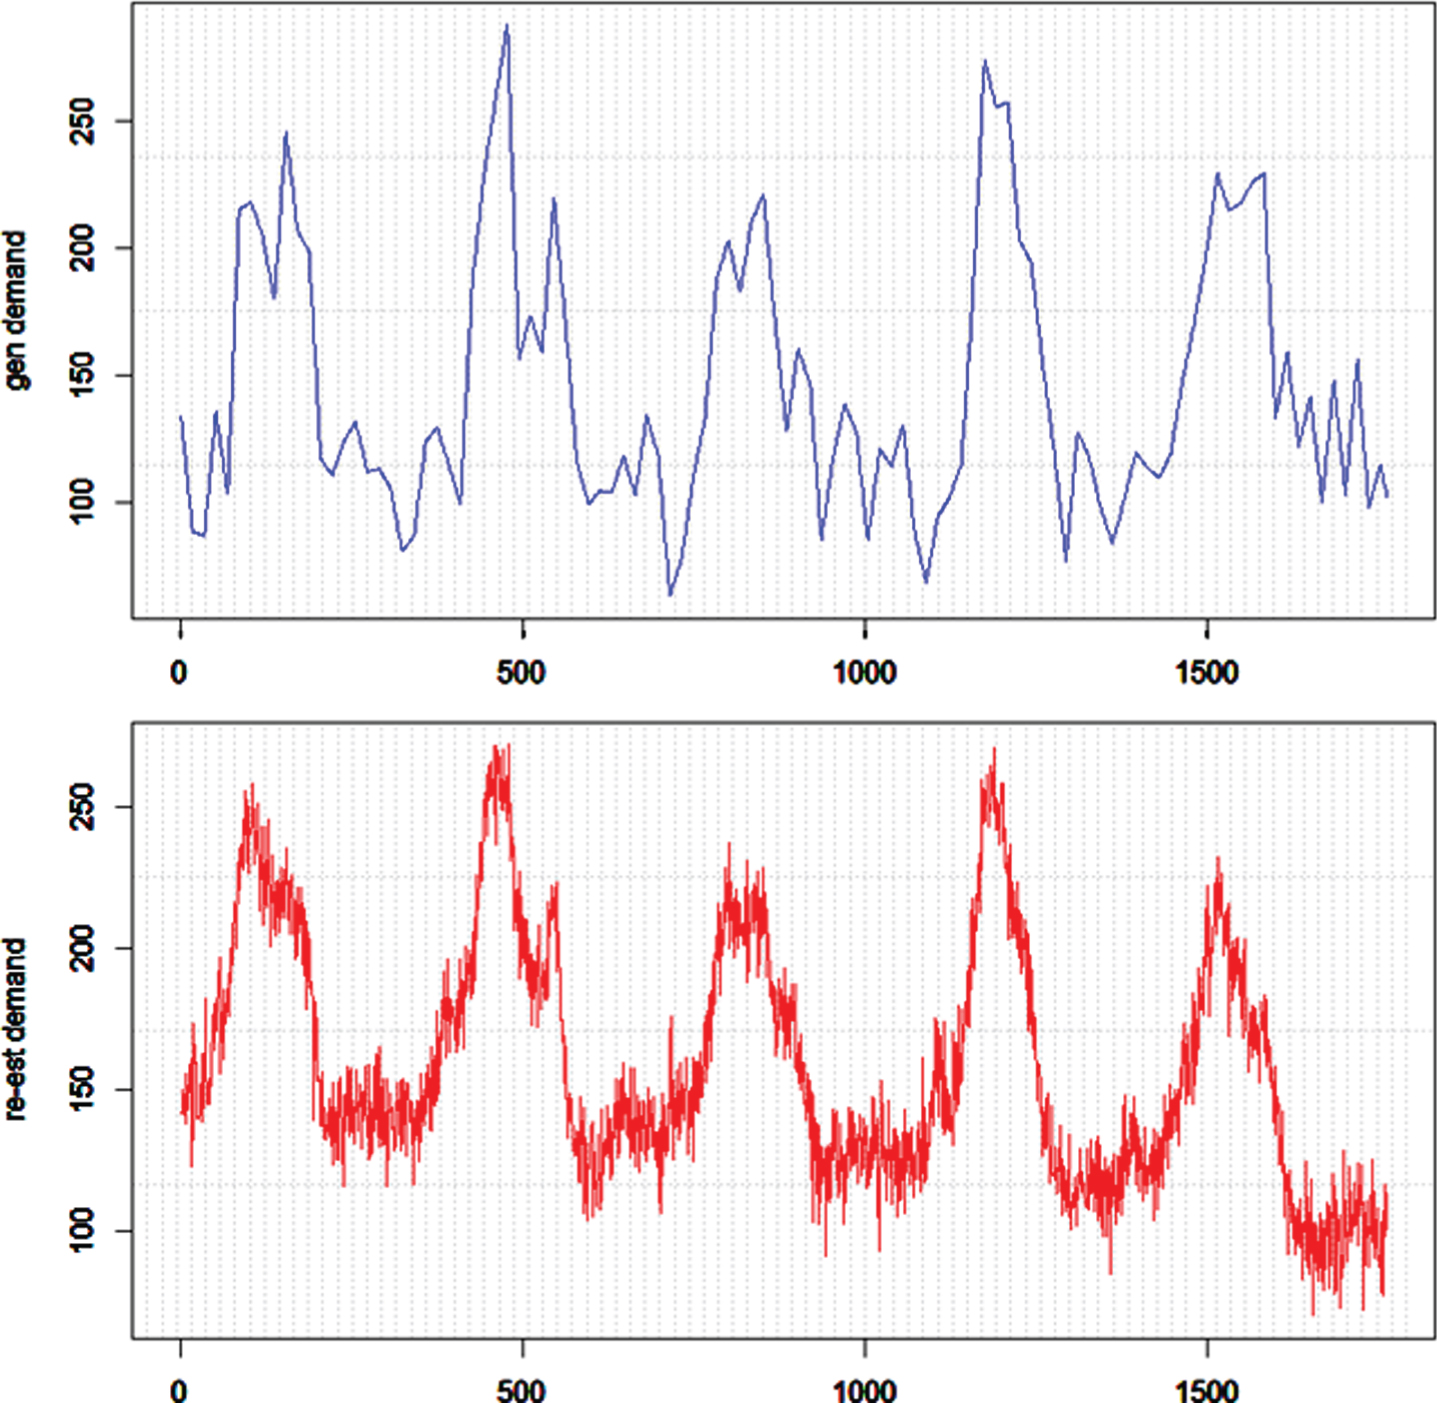
The comparison between Sknown and Sestimated . .
Our framework is novel in helping investigate the effects of business and managerial insights in terms of statistical optimization and triangulation assimilation. We established a modeling framework for time series forecasting and focus on model identification as well as time series prediction for applications that are difficult to acquire ground truth data. The novelty in this study attributes to the dual source algorithm of triangulation to generate a time series that replicates the hidden time series in a system.
This study discovers meaningful insights in hidden information. Our triangulation assimilation restores the hidden information in applications of time series. Our re-estimated hidden time series is proven similar to the true time series.
This study extends the field of operations management in a holistic view of time series analysis in real-world analytics.
Footnotes
Acknowledgments
This work was supported in part by the Ministry of Science and Technology, Taiwan, under Grant Number MOST 107-2221-E-153-005-MY2, 107-2410-H-992-014-MY2. This work was also supported in part by the “Intelligent Manufacturing Research Center” (iMRC) from the Featured Areas Research Center Program within the framework of the Higher Education Sprout Project by the Ministry of Education (MOE) in Taiwan