
Abstract
Atrial fibrillation (AF) is a type of paroxysmal cardiac disease that presents no obvious symptoms during onset, and even the electrocardiograms (ECG) results of patients with AF appear normal under a premorbid status, rendering AF difficult to detect and diagnose. However, it can result in deterioration and increased risk of stroke if not detected and treated early. This study used the ECG database provided by the Physionet website (https://physionet.org), filtered data, and employed parameter-extraction methods to identify parameters that signify ECG features. A total of 31 parameters were obtained, consisting of P-wave morphology parameters and heart rate variability parameters, and the data were further examined by implementing a decision tree, of which the topmost node indicated a significant causal relationship. The experiment results verified that the P-wave morphology parameters significantly affected the ECG results of patients with AF.
Introduction
Atrial fibrillation (AF) is a type of paroxysmal cardiac disease that is most commonly found in patients with arrhythmia in clinical practice. Its symptoms include increased heart rate and irregular heartbeat, which are likely to cause blood clots and increase the risk of stroke, heart failure, and dementia [1]. According to statistics released in the United States, 45% of patients with AF are older than 75 years. The prevalence rate is 0.95% overall and is respectively 0.1% and 9% for individuals younger than 55 years and older than 80 years, which implies that the prevalence of AF increases with age. Furthermore, the prevalence rate is estimated to increase by a factor of 2.4 by the year of 2050, with a prevalence exceeding 50% for people older than 80 years [2]. Other statistics have indicated that AF is also highly correlated to hypertension, diabetes, excessive alcohol use, and other heart diseases such as valvular heart disease, heart failure, and coronary artery disease, and the prevalence rate among men is higher than that among women [3].
AF results from abnormal electrical discharge generated within the atrial chambers, which affects the electrophysiological responses of the heart and causes irregular heartbeats. AF can be categorized into three types according to the level of severity and the duration of symptom presentation since the time of onset: (1) paroxysmal AF, in which patients exhibit symptoms for no more than 7 days and usually self-recover from an attack within 24 hours; (2) persistent AF, in which patients exhibit symptoms for more than 7 days and are less likely to recover without taking medication or undergoing electrical cardioversion; and (3) permanent AF, in which patients exhibit symptoms for more than a year and are unlikely to recover by taking medication or undergoing electrical cardioversion [1]. According to studies conducted in Canada, paroxysmal and persistent AF are expected to deteriorate into permanent AF, and the level of deterioration is associated with age, heart rhythm, and cardiomyopathy [4]. The reason behind this phenomenon is that most patients, regardless of the type of AF, experience no symptoms at the onset of AF; only few patients experience chest pain, palpitation, or dyspnea. Therefore, most patients are unaware that they have AF and fail to receive treatment early, which results in incurable permanent AF [5].
AF is a very common disease in the emergency department, costing about $6 billion in the United States each year, and about 15% return to hospital in 30 days. Currently, in clinical practice, AF is detected using an electrocardiogram (ECG); however, in a premorbid status, the ECG results of patients with paroxysmal AF are identical to those of individuals without AF, making AF identification difficult [6].
Machine learning is one of the methods that can be used to identify AF. However, the feature parameters used to classify AF are not easy to determine. Therefore, this study used the ECG database provided by the Physionet website (https://physionet.org), filtered the data, adopted various parameter-extraction methods, and eventually obtained 31 ECG parameters, namely P-wave morphology and heart rate variability (HRV) parameters. In addition, the data were further analyzed using a decision tree to verify the ability of different parameters on identifying AF.
Materials and methods
Data set description
The data set used in this study is the online atrial fibrillation paroxysmal database provided by Physionet (https://physionet.org), which is the most commonly consulted database for AF research. It contains the ECG data of 50 healthy individuals and 50 patients with paroxysmal AF, and each ECG datum offers a 30-minute record; among the collected data, no obvious AF onset symptoms were detected. This study adopted the lead II ECG signal provided by the database with a sampling frequency of 128 Hz [7, 8]. The database was also used by Parvaresh and Ayatollahi [9] to employ an autoregressive model for predicting the onset of AF and by Asgari et al. [10] to conduct a wavelet transform and operate a support vector machine for detecting AF symptoms.
Data preprocessing
ECG signals are collected by calculating the electrical potential differences among the electrodes placed on test subjects. ECG readings may be affected by various factors such as the incorrect placement of electrodes, patients’ body movements, electrode staining, the amount of moisture and contaminants on the skin, and disturbances in the surrounding environment [11].
Luo and Johnston [12] stated in their literature review that both the software and hardware of ECGs often combine low-pass filters, high-pass filters, and band-stop filters together. Mains hum in the range of 50–60 Hz, varying by country, can be eliminated using a band-stop filter [13]. ECGs can be antialiased by applying a low-pass filter, and the problem of baseline wander can be solved by employing a high-pass filter.
Figure 1 displays the ECG raw data obtained from the Physionet database of a patient with paroxysmal AF. This study used Matlab to combine a low-pass filter, high-pass filter, and band-stop filter together for the elimination of noise disturbance.
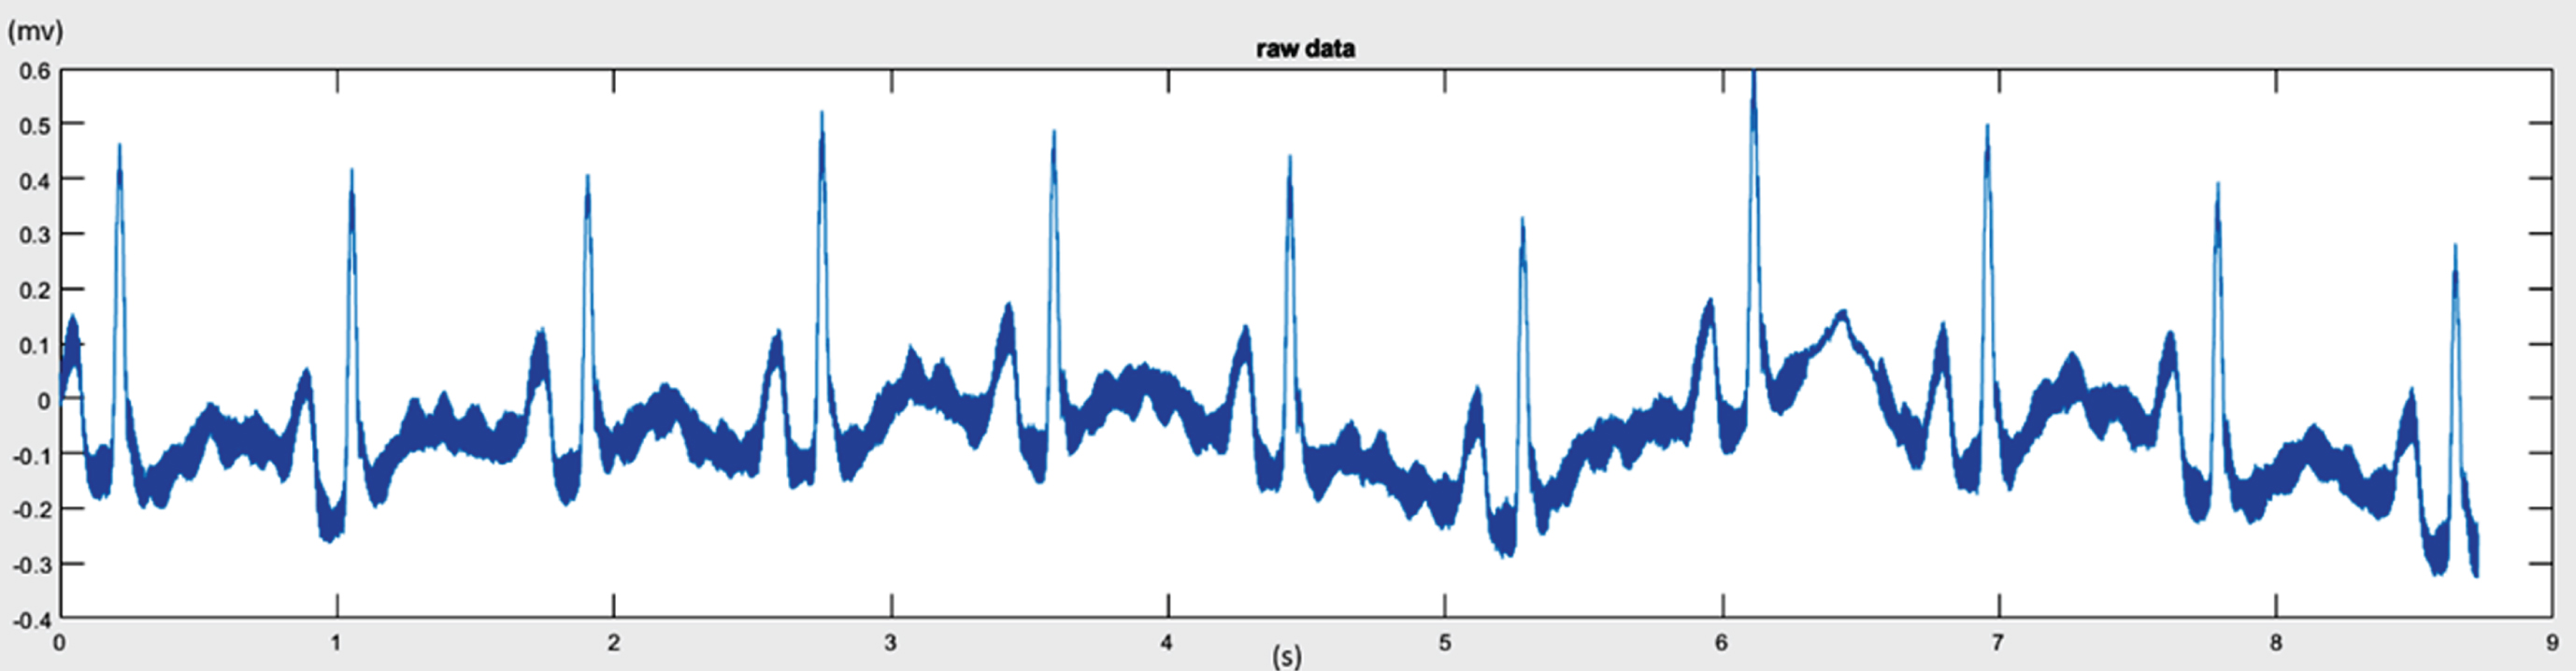
ECG raw data.
Because of the presence of mains current in mains-powered audio equipment as well as ubiquitous AC electromagnetic fields from ECG appliances, 50/60 Hz electrical noise can be heard as mains hum. Therefore, ECG data are likely to include mains hum. For example, after the data underwent fast Fourier transform (FFT), the range of the mains hum could be observed, as indicated by the circled area in Fig. 2.
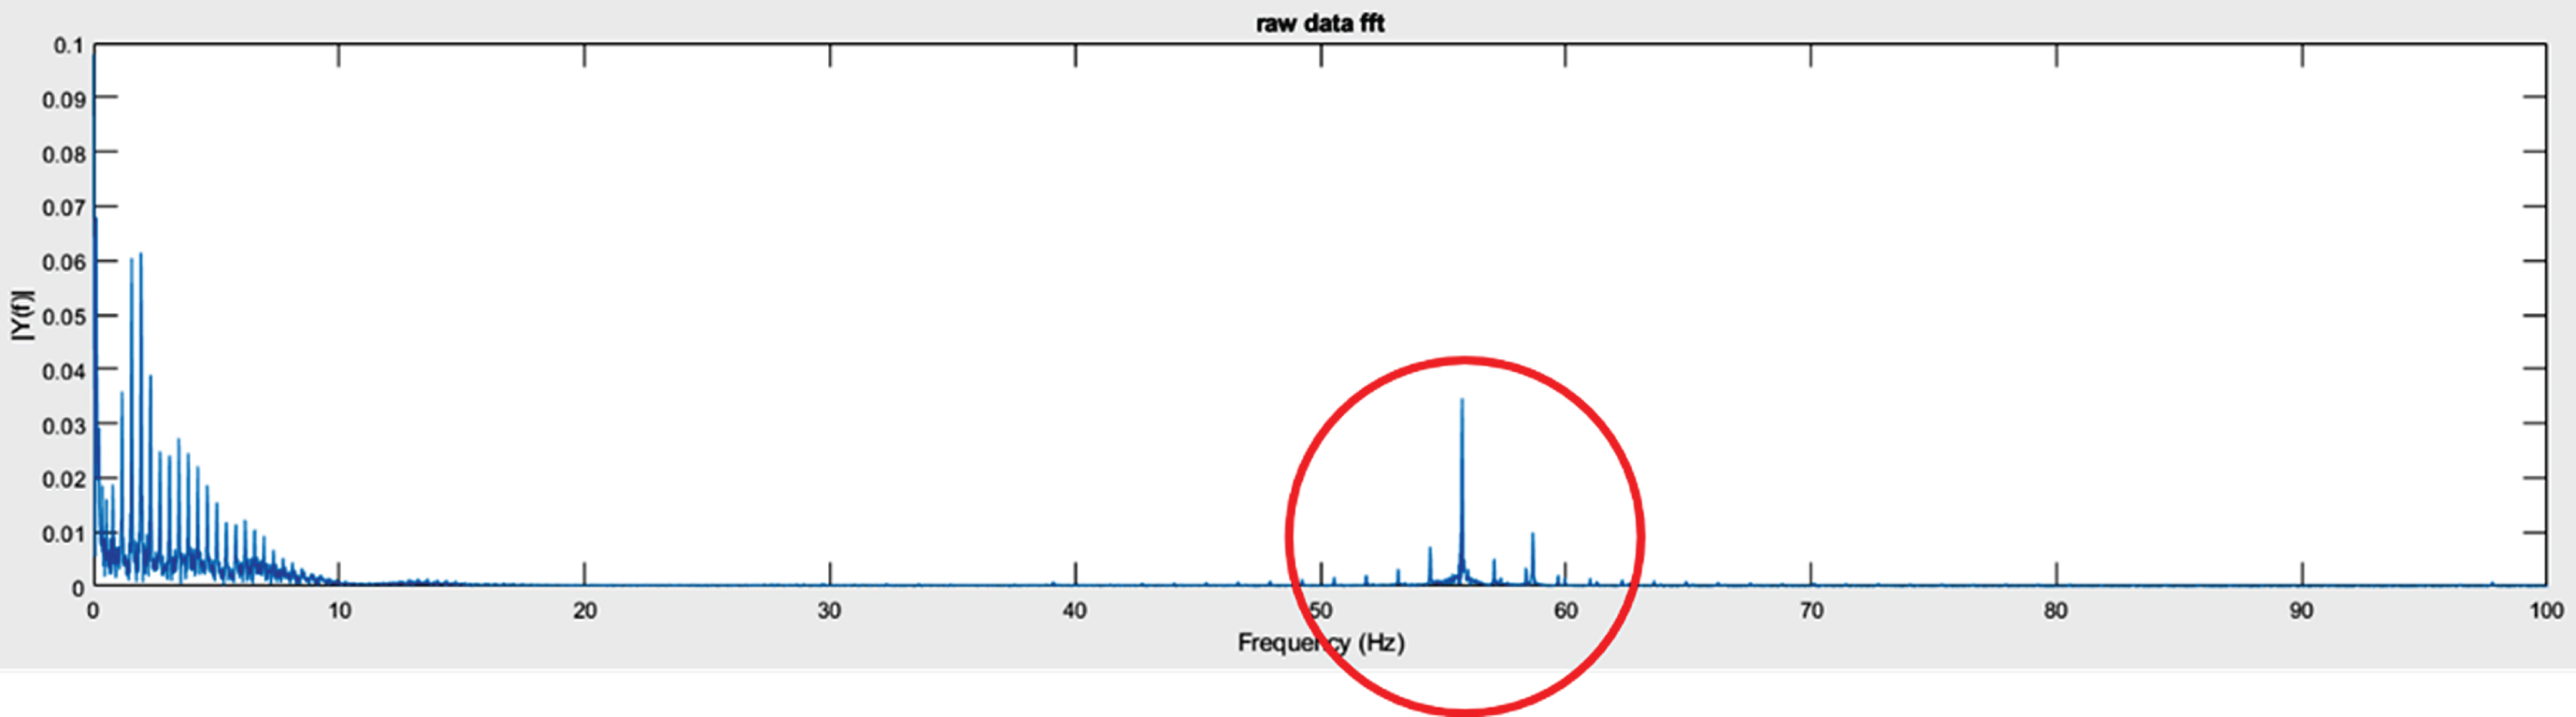
Mains hum observed under fast Fourier transform.
A set frequency range is used for the band-stop filter to weaken the signals that fall in the specified range. This frequency range used in this study was 50–60 Hz; as indicated by the output displayed in Fig. 3. Compare Figs. 2 and 3, noise in the range of 50–60 Hz was eliminated.
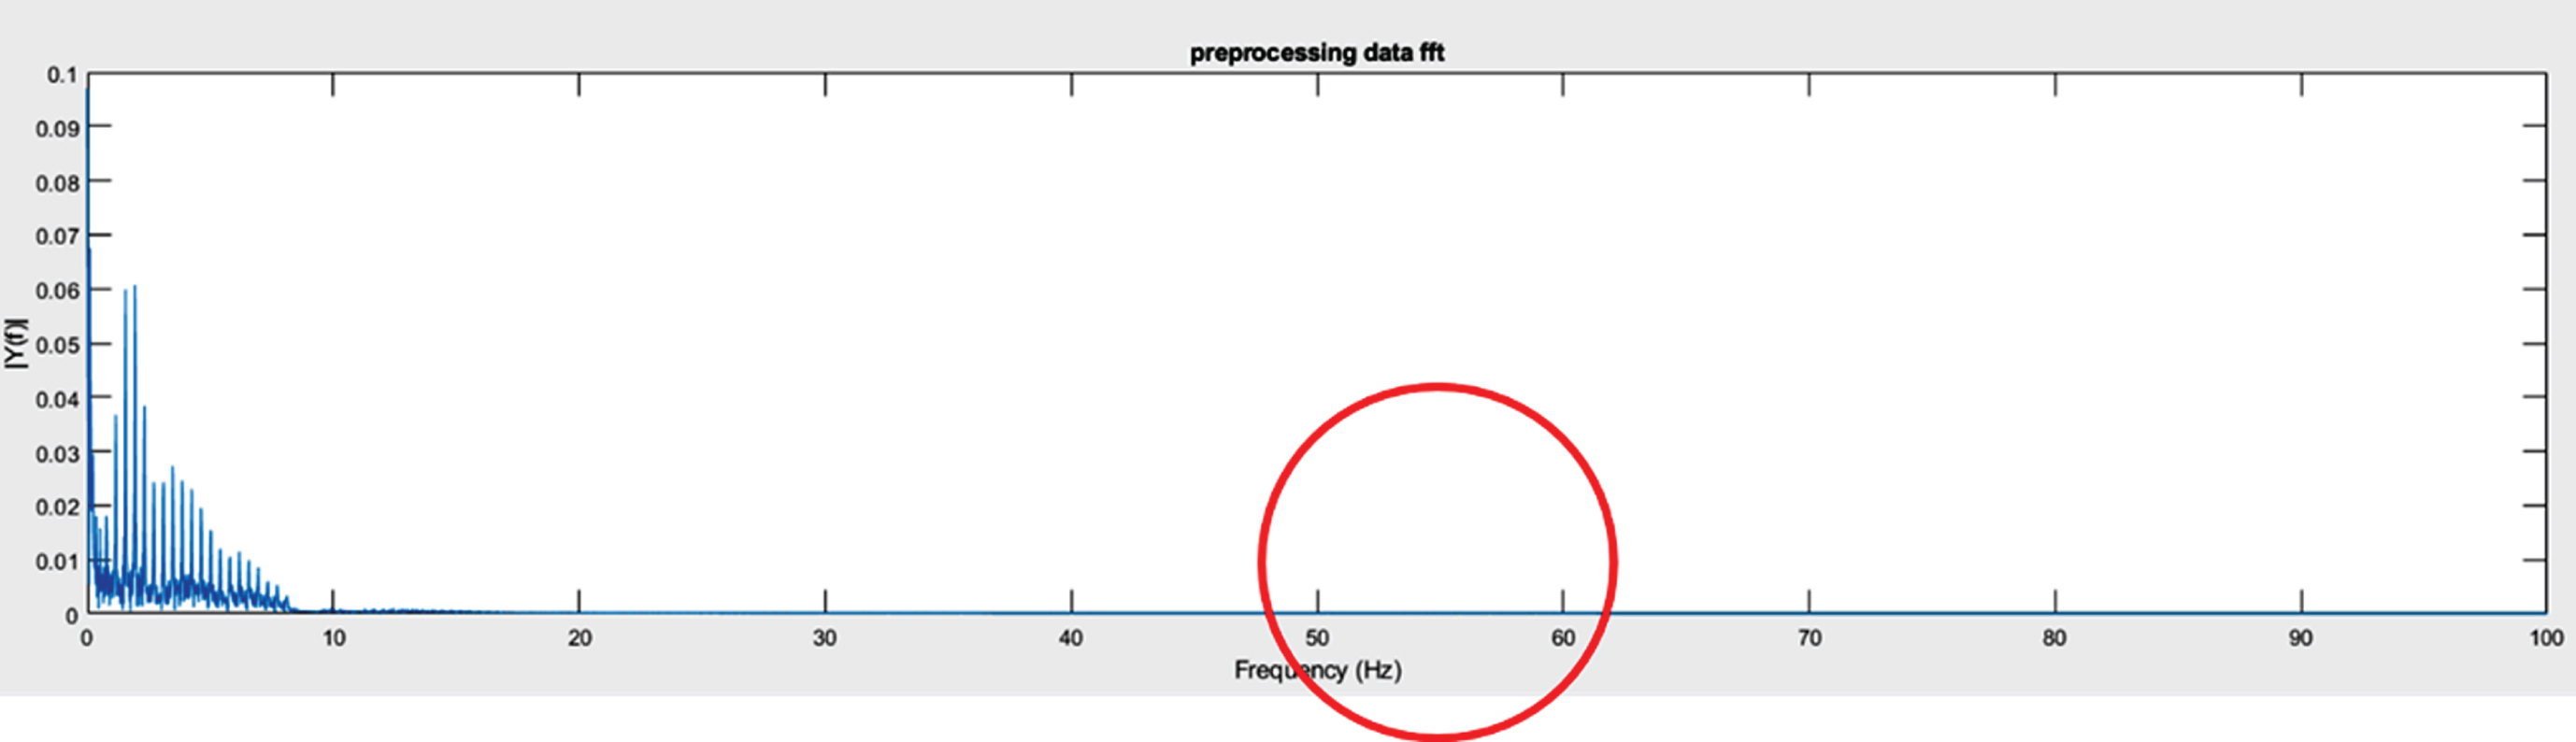
Elimination of mains hum by using a band-stop filter.
Furthermore, noise disturbance in an ECG also includes sounds from breathing and other sources that generate high-frequency noise. The low-pass filter was set at a frequency of 150 Hz for excluding noise with a frequency higher than 150 Hz, which results in antialiased waveforms [12]. As shown in Fig. 4, the jittering curves are removed, and waveforms are notably smoother than those in Fig. 1.
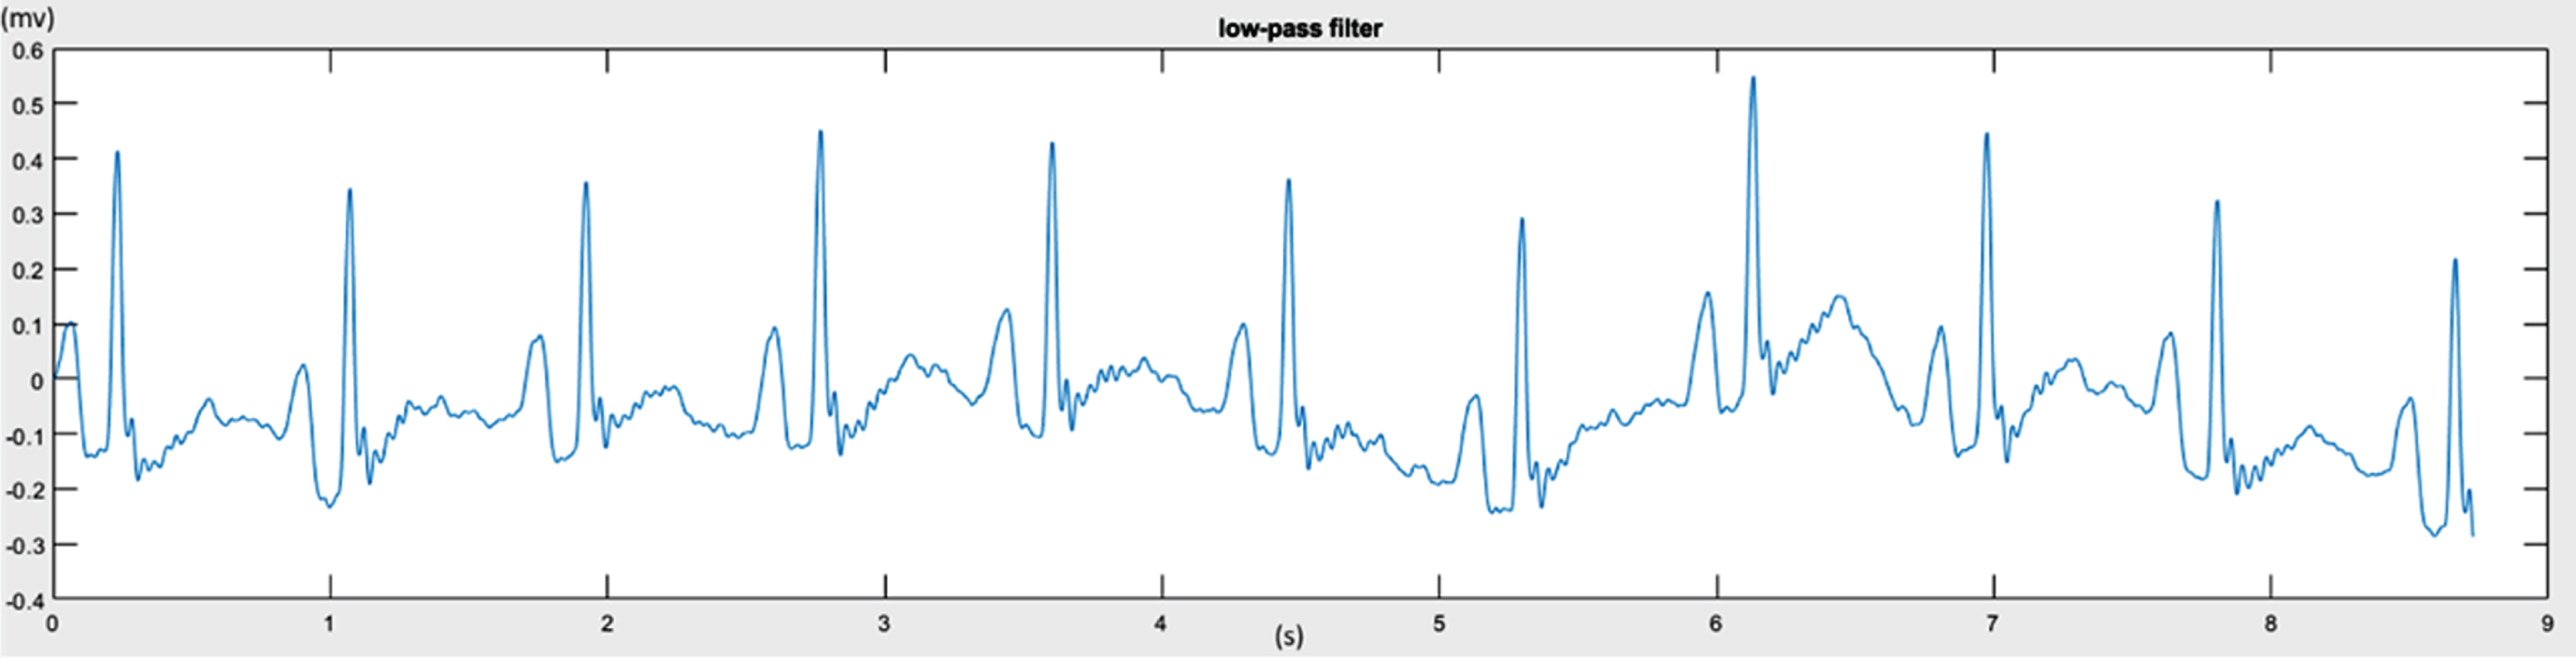
Antialiasing signals by using a low-pass filter.
It is conceivable that ECG signals may exhibit different levels of baseline wander and irregular jittering due to reasons such as insufficient voltage stability of the ECG equipment and damaged electronic tubes in the capacitance device and signal amplifier. A high-pass filter was designed accordingly and set with a cutoff frequency of 0.05 Hz to eliminate noise with a frequency lower than 0.05 Hz and maintain a horizontal baseline [12]. As indicated in Fig. 5, the baseline values of the ECG amplitude are more concentrated and approach 0.
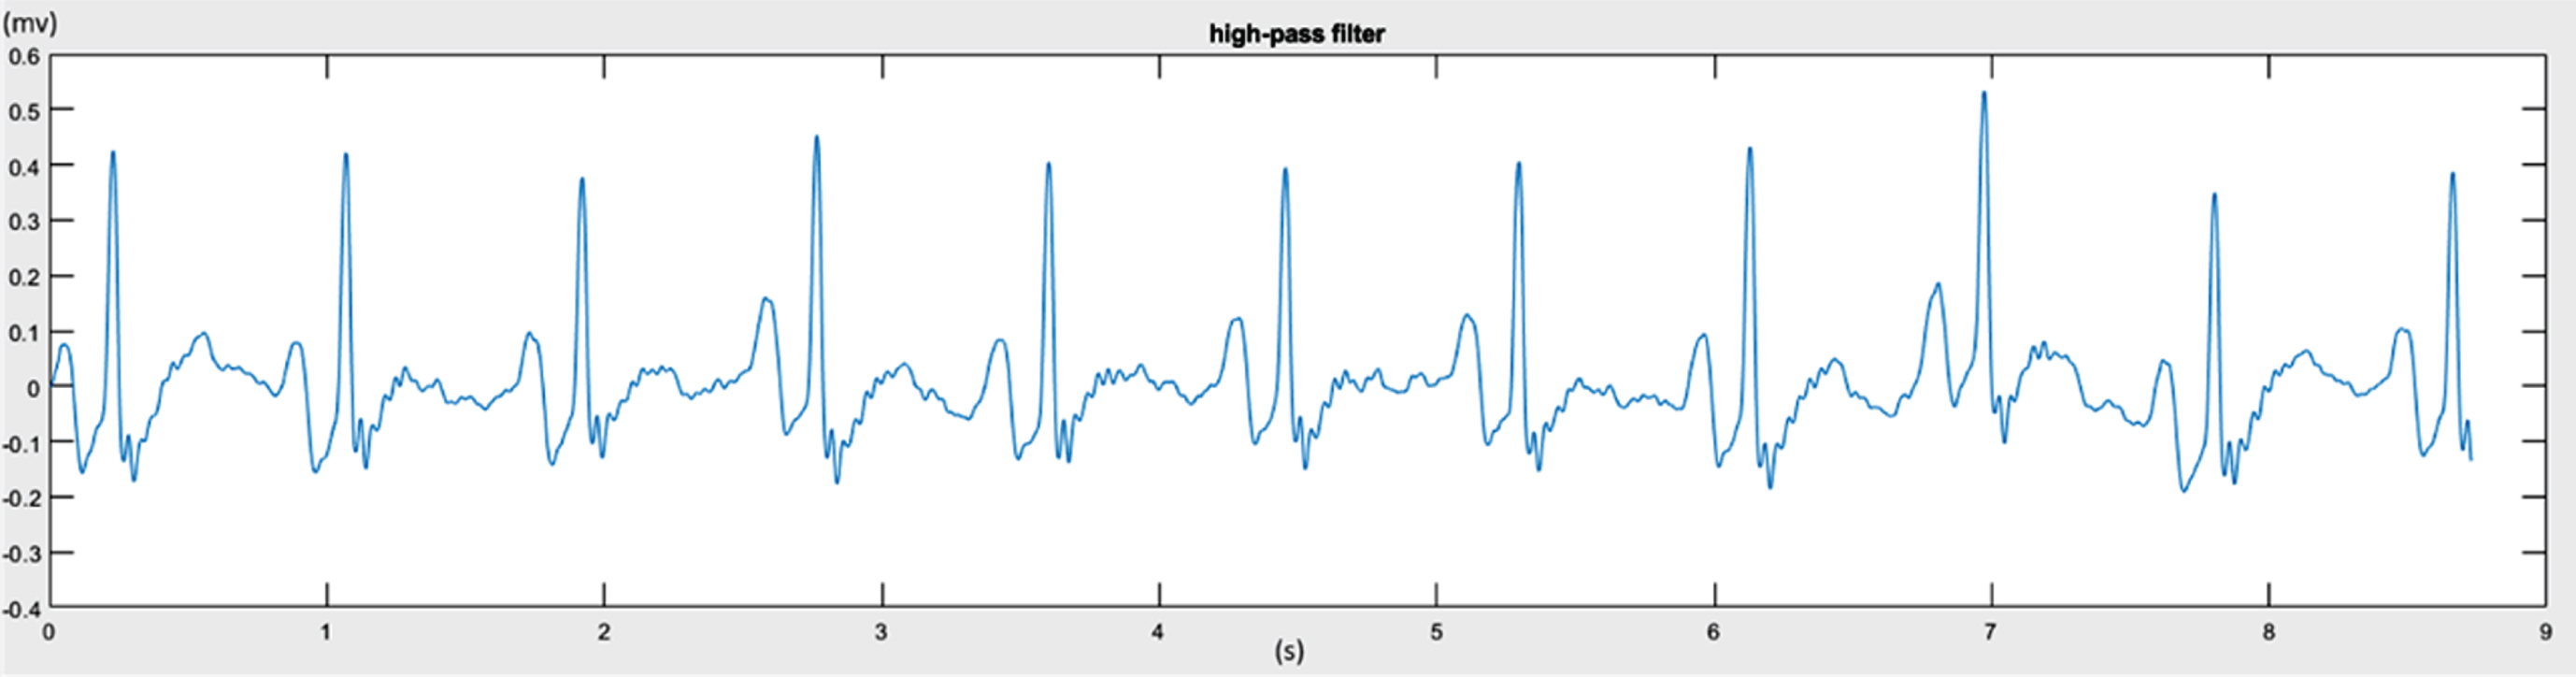
Baseline reduction using a high-pass filter
The ECG feature parameters extracted could be divided in the following two categories: P-wave morphology parameters and HRV parameters. This study obtained 6 P-wave morphology parameters (Table 1) and 25 HRV parameters (Table 2); the HRV parameters consisted of 11 time-domain parameters, 7 frequency-domain parameters, and 7 nonlinear parameters. A total of 31 parameters were extracted to serve as the input values during AF data mining, as indicated with brief description in Tables 1 and 2. The ECG feature extraction process is detailed as following sub-sections.
P-wave morphology parameters of the ECGs
P-wave morphology parameters of the ECGs
Heart rate variability parameters of the ECGs
In the present study, the width of the P-wave measured for a particular heart pulse (PW), amplitude of the P-wave (PA), and distance from the beginning of the P-wave to its maximum (PD) were extracted [14]. Other studies have also adopted Gaussian function fitting on the P-wave to obtain
Gaussian function variables as morphology parameters [15–18]. The Gaussian function fitting on the P-wave is given by
P-wave morphology assessment with a Gaussian function enables optimization through acquisition of the lowest standard deviation and further generation of a waveform with improved fitting performance. The author adopted the hybrid Taguchi–genetic algorithm to conduct P-wave fitting and search for the three most suitable parameters (A, C, and W) for the Gaussian function to acquire optimal P-wave fitting of a Gaussian curve. Details regarding the optimized P-wave fitting method can be found in the research by Tang et al. [19].
Time-domain methods
Calculation with the time-domain method is simple, and the method can be directly applied in a series of consecutive RR intervals [20]. The most commonly measured parameters are the average heart rate per minute (
Frequency-domain methods
Frequency-domain methods were adopted to estimate the spectrum based on the RR interval sequence [20]. Before conducting spectrum estimation, the cubic spline interpolation method was applied for converting the RR interval sequence into an interval sampling sequence. Spectrum estimation was performed using two approaches: the Welch periodogram and autoregressive (AR) modeling. With the Welch periodogram, the RR series was divided into several overlapping segments, each of which was processed with a window function to reduce leakage effects; the spectrum was further estimated by acquiring the average value of the FFT spectra processed by a window function. Through AR modeling, an AR model with a specific order was employed for modeling on the RR series, and the spectrum was further estimated according to the modeling parameters. By using spectral decomposition, AR spectra could be categorized into different spectrum components.
Subsequently, spectrum estimation was arranged into three segments: very low frequency (VLF), low frequency (LF), and high frequency (HF). Under the circumstance of a short-term HRV record for a typical human subject, the common limitations of these segments were 0–0.04 Hz (VLF), 0.04–0.15 Hz (LF), and 0.15–0.4 Hz (HF). The maximum power of the HRV measurements (i.e. VLF power, LF power, and HF power), the LF/HF power ratio, and the total spectral power were individually extracted from the VLF, LF, and HF segments.
Nonlinear methods
Poincaré plot is the most commonly used method for obtaining nonlinear HRV parameters [21]. A distribution diagram was generated in accordance with the distance between two adjacent RR intervals, and the randomness of the time sequence can be observed from the diagram, in which the radii of the minor and major axes of the elliptical distribution are presented as SD1 and SD2.
The Poincaré plot presents the activity of the human parasympathetic system in clinical practice. The research of Park et al. [22] adapted the two parameters SD1 and SD2 acquired from this measure and presented them as an essential index for examining AF, which indicates their valuable contribution to the prediction of AF.
Entropy is an index that determines whether information is certain. A higher entropy rate suggests a higher degree of uncertainty and unpredictability in the data. Approximate entropy is a measure that quantizes the uncertainty and unpredictability of time sequence data and is also a practical method and index for analyzing medical data. The calculation of sample entropy is similar to that of approximate entropy.
The calculation of the long-range and short-range correlation of the time sequence can be conducted through detrended fluctuation analysis. After the long-range and short-range distribution points have undergone first-order linear fitting using the least square method, the obtained slopes α1 and α2 can serve as a correlation index [23]. This section presents the nonlinear parameters most commonly applied in HRV analyses.
Decision tree
A decision tree is a tree-like structure that presents the rules that can be followed in decision-making and is also the most fundamental tool for classification learning. Each node represents the parameter or threshold that divides the categories, and the growing branches eventually become and demonstrate the classification rule. A decision tree is implemented by applying an algorism for the calculation of the conditional probability and information gain to decide what parameter should be placed on each node. The parameters placed on the higher nodes of the decision tree suggest better performance in classifying information [24–26].
Results and discussion
A decision tree was adopted as the data mining method in this study; higher nodes on the decision tree indicate improved performance in data acquisition and ability to categorize the results [27]. Figure 6 presents a classification rule diagram of a decision tree created using the R programming language. According to Fig. 6, the P-wave parameters A and W as well as the Poincaré plot parameter SD2/SD1 serve as crucial keys to the decision tree, signifying whether the eigenvalues of Gaussian function fit support the classification of the model. In terms of the classification of AF-related data, the P-wave morphology is likely to provide the most beneficial parameters, which corresponds to other studies that report a significant correlation between ECG P-waves and AF [17, 28].
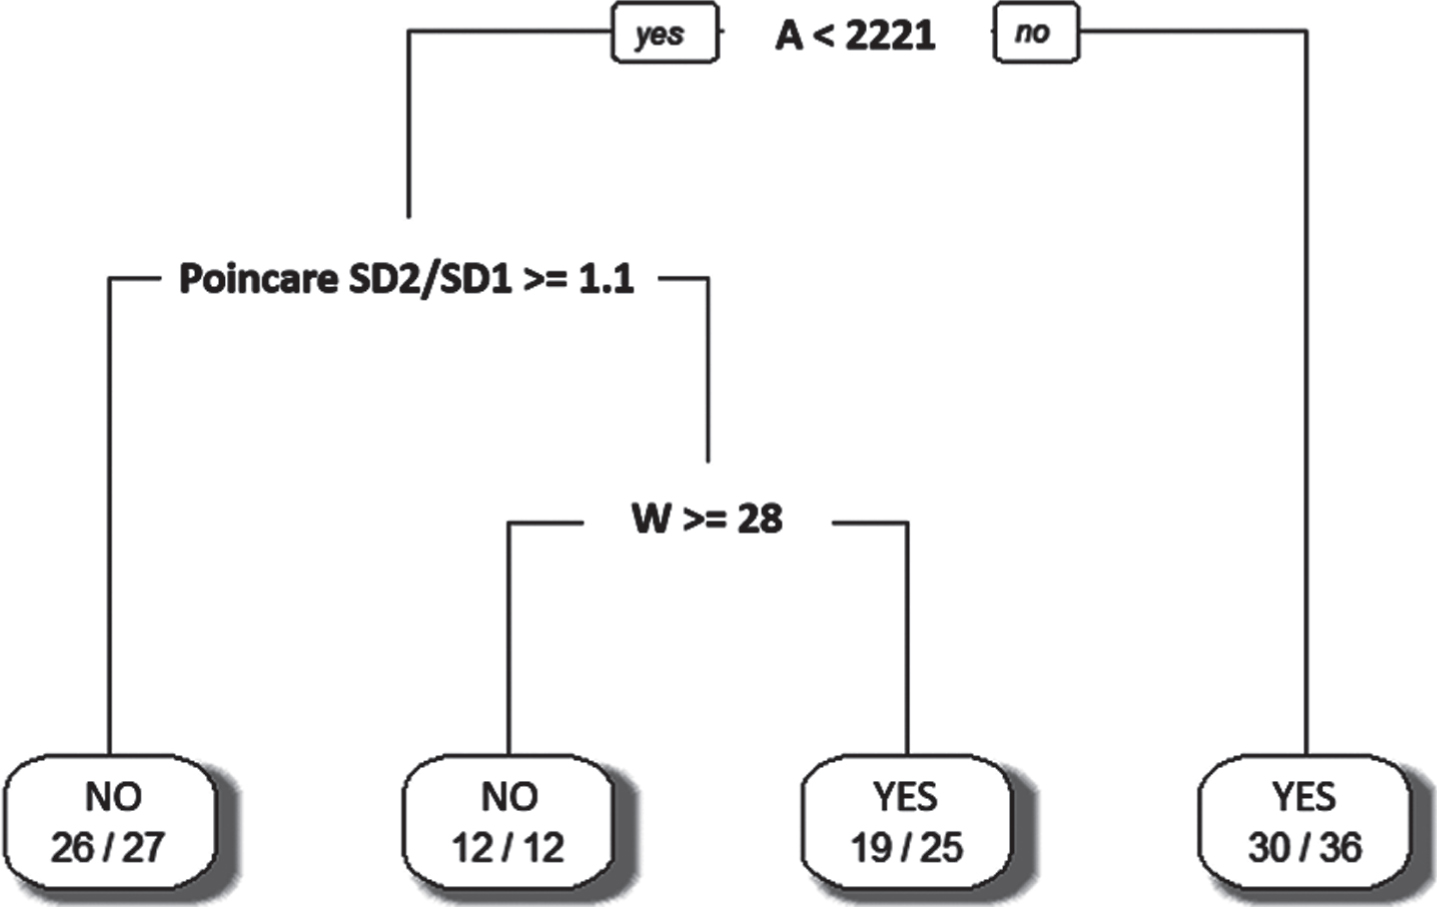
Classification rule diagram of a decision tree.
By using the gradient boosting decision tree algorithm in the R programing language, the importance of each parameter in the data classification can be calculated, as shown in Fig. 7. The result suggests that the parameters A, W, and the Poincaré plot SD2/SD1 play crucial roles in data classification, which supports the result of the decision tree.
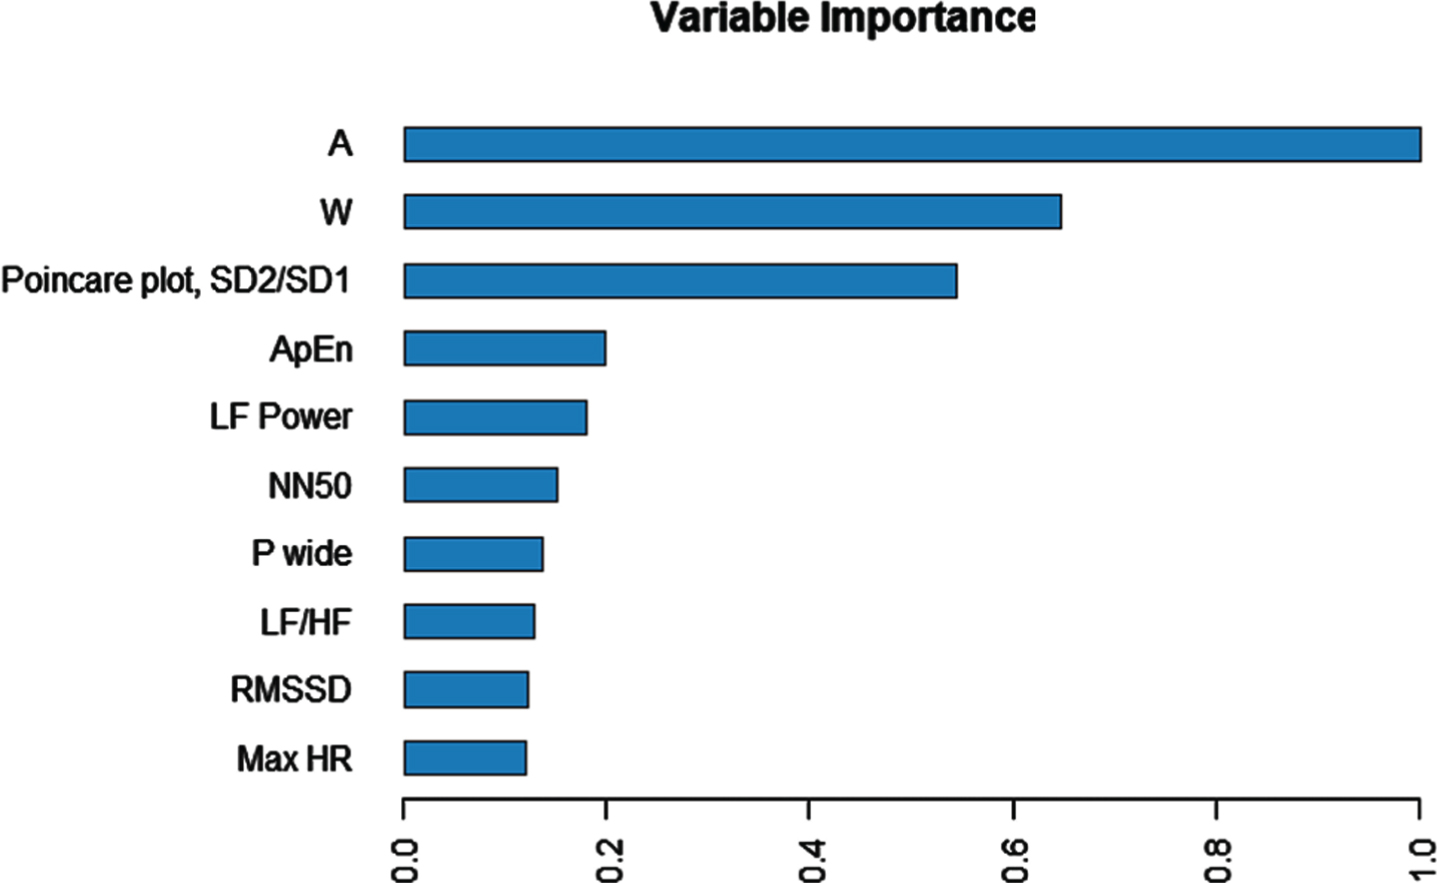
Importance of each parameter in a gradient boosting decision tree.
The parameters A and W in the Gaussian function determine the height of the P-wave crest and the length of the P-wave, respectively. Aytemir et al. [29] suggested that the length and height of a P-wave obviously differ between a healthy individual and a patient with AF.
Furthermore, a greater Poincaré plot SD2/SD1 value indicates smaller differences in the distances between adjacent RR intervals and thus a stable heart rhythm. Park et al. [22] trained a support vector machine using Poincaré plot parameters and successfully detected AF. This implied that the parameters extracted by the Poincaré plot are applicable in differentiating between the ECGs of a healthy individual and those of a patient with AF.
Obviously, other studies only investigate feature parameters of a single physical property, but in this study, we consider existing feature parameters with different physical properties and further verity their ability of different parameters on identifying AF.
AF affects more than 6 million people in the United States and 33.5 million people worldwide, many of whom are unaware of the severity of the complications that may occur. Therefore, it’s important to detect AF for receiving treatment early. In clinical practice, ECGs are used to detect AF, but the ECG results of patients with paroxysmal AF are identical to those of individuals without AF, making AF identification difficult. Although machine learning can be used to identify AF. However, the feature parameters used to classify AF are not easy to determine.
This study filtered ECG data and adopted several parameter-extraction methods to obtain the features in the ECG, namely P-wave morphology parameters and HRV parameters. A total of 31 parameters were acquired, and a decision tree was used to conduct data mining. The results of the decision tree and the gradient boosting decision tree confirmed that P-wave parameters have a significant effect on the ECGs of patients with AF.
The diagnosis of AF is highly challenging during patients’ premorbid status because ECG signals appear normal at first glance. Accordingly, the P-wave morphology parameters identified in this study can be used to establish an explainable artificial intelligence (AI) model in the future and enable humans to comprehend the reasons behind the decisions made by explainable AI.
Footnotes
Acknowledgments
This work was supported in part by a grant from the Chi-Mei Medical Center and Kaohsiung Medical University Research Foundation 109CM-KMU-013. This work was also supported in part by the Ministry of Science and Technology, Taiwan under grants MOST 108-2221-E-214-020 and MOST 108-2221-E-037-007, the National Sun Yat-Sen University-Kaohsiung Medical University (NSYSU-KMU) joint research project (NSYSUKMU 108-P006), YUAN-IACR-19-25 (ST107008), and the “Intelligent Manufacturing Research Center” (iMRC) from the Featured Areas Research Center Program within the framework of the Higher Education Sprout Project by the Ministry of Education (MOE) in Taiwan.