
Abstract
This paper proposes a Wi-Fi-based indoor human detection system using a deep convolutional neural network. The system detects different human states in various situations, including different environments and propagation paths. The main improvements proposed by the system is that there is no cameras overhead and no sensors are mounted. This system captures useful amplitude information from the channel state information and converts this information into an image-like two-dimensional matrix. Next, the two-dimensional matrix is used as an input to a deep convolutional neural network (CNN) to distinguish human states. In this work, a deep residual network (ResNet) architecture is used to perform human state classification with hierarchical topological feature extraction. Several combinations of datasets for different environments and propagation paths are used in this study. ResNet’s powerful inference simplifies feature extraction and improves the accuracy of human state classification. The experimental results show that the fine-tuned ResNet-18 model has good performance in indoor human detection, including people not present, people still, and people moving. Compared with traditional machine learning using handcrafted features, this method is simple and effective.
Introduction
In recent years, with the widespread deployment of Wi-Fi devices, wireless signals are ubiquitous in our lives [19]. Wireless networks are used not only to transmit digital data, but also to detect changes in the surrounding environment that few people notice. Typical applications include activity recognition, indoor positioning, human detection for intruder detection, and home children and elderly monitoring [7, 24]. Although some cameras and wearable devices can do this, they still encounter certain limitations. The former is not suitable for situations where there is insufficient light or a high degree of privacy, while the latter is usually uncomfortable [26, 28].
The principle of a wireless indoor human movement detection system is that the generated wireless signals are transmitted through multipath transmission. Reflection and scattering will cause multiple superimposed signals to be received in an indoor environment [8]. These signals are physically affected by the presence or movement of people in the transmission space and generate various environmental characteristic information. In this work, there are two challenges to overcome: 1) How to extract useful information about the state of indoor people from multipath superimposed signals? 2) How to process useful information to quickly and effectively detect human states?
In the currently widely used orthogonal frequency division multiplexing (OFDM) system, data is modulated and transmitted simultaneously on multiple subcarriers of different frequencies. We have a value that estimates the channel in each subcarrier, called channel state information (CSI). The CSI describes how signals propagate from a transmitter to a receiver and reveals the combined effects of scattering, fading, and power decay with distance. Thus, to address the above challenges, we obtain CSIs in the physical layer of typical commercial Wi-Fi devices and then analyze this information to detect the human movement in the indoor environment.
The CSIs carry characteristic information reflecting the state of people during transmission. First, our method captures useful amplitude information from CSIs and converts the amplitude information into a two-dimensional (2D) signal matrix. In addition, we explored the deep convolutional neural network (CNN) models to classify 2D signal matrices relative to different human states in various typical indoor environments. Then, the CNN models are used to automatically extract the human state features from the signal matrices instead of using handcrafted features for traditional machine learning. Finally, different human states can be easily distinguished, including human-free, human stills, and human movements.
Compared with the traditional machine learning classification, the CNN models based on “self-learning” nature can effectively improve the classification accuracy of indoor human movement.
In summary, the contributions of our work are as follows: Explore and visualize Wi-Fi amplitude signals for different environments and propagation paths. We can observe real signal changes that reflect human states. This work shows that Wi-Fi signals can be converted into image-like data. Utilizing CNNs can provide good results without the handcrafted features used in traditional machine learning approaches. This work shows that the ResNet-18 CNN model can be used to distinguish CSI data under different human state scenarios.
The rest of this article is organized as follows. We review the work in Section 2 and in Section 3 outline the system design for classifying human states based on CNNs. In Section 4, the settings of the experimental environment and the visualization of the signals are introduced, and the results of the indoor human detection are provided. Finally, Section 5 concludes this work.
Related work
Along with Wi-Fi technology, there are two models for detecting the state of people in an indoor environment, including received signal strength indication (RSSI) and channel state information.
Received signal strength indication
Because the received signal strength (RSS) information is easy to capture, RSSI has been applied to indoor Wi-Fi detection in many papers [8, 27]. The traditional approach to these papers is to detect stationary and moving object detection based on RSSI through wireless local area network nodes [18]. The RSSI variance determines whether the object is moving, and the least squares of the RSSI can be obtained by linear regression. When the gradient is positive, the moving direction of the object is consistent with the direction of the access point (AP).
For example, Yang et al. explored intrusion detection based on the GREEK (Grid-based Kneighborhood Clustering) algorithm [25]. First, the noise on the RSSI is filtered by an Alpha-trimmed averaging filter. Then, the mean and variance of the RSSI form a 2D grid space as input data for k nearest neighbor (kNN). kNN can detect the presence of intrusions based on 2D data distribution. However, RSSI information is a superposition result and is easily affected by multipath effects and environmental noise. Its value shows large fluctuations and its stability is poor [27].
Channel state information
Compared with RSSI, CSI can effectively deal with multipath effects in indoor environments and detect environmental changes more accurately than RSSI [3, 14]. Therefore, pioneer efforts have explored CSI for indoor positioning, intruder detection, contactless sleep monitoring, and real-time fall detection [12, 29].
The popularity of machine learning, support vector machines (SVMs) are also widely used for classification problems. Wang et al. presented a SVM-based indoor human activity recognition using wireless signals [20]. They used 24 features, including standard deviation, signal entropy, median absolute deviation, etc. These features come from the channel frequency response (CFR), which is available in CSI form. Since the magnitude of the CFR varies with the states of the indoor people, the information of these features can be used to classify the states by SVM.
Wu et al. proposed a DeMan system based on CSI amplitude and phase information to detect the presence and movement of people in the room [23]. First, according to the variance of the channel state signal, the movement or stationary of the object can be simply classified by a 5-second duration envelope. Then, the correlation coefficient matrix of the CSI amplitude and phase of the moving state is used as their maximum eigenvalue to prevent errors. When people are still in the indoor environment, DeMan believes that human breathing is an inherent indication of human presence. As a result, DeMan can detect both moving and stationary people.
Deep convolutional neural networks
Most existing methods use handcrafted features extracted from CSI signals and then use classifiers to distinguish human states. This approach means that feature engineering must be completed. Therefore, system performance depends on the success of feature engineering.
CNN’s impressive performance in image recognition has attracted many researchers to develop different models. A CNN consists of many convolutional and subsampling layers optionally followed by one or more fully connected layers. The spatial convolution layer uses filters to extract features, and can have multiple filters to extract different types of features on the input image. That is, CNN has the capability of feature learning and does not require handcrafted features.
AlexNet [9] is a deeper network that has been previously applied to ImageNet, with five convolutional layers, and then three fully connected layers. Compared with traditional methods, its accuracy is greatly improved. The improvement of VGG [16] to AlexNet is to replace several larger convolution kernels (11×11, 5×5) in AlexNet with several 3×3 convolution kernels. It also deepens the network and gets better results. Inception (GoogLeNet) [17] has made an innovation. This is not the concept of deepening the network like VGG. Instead, it adds a structure called Inception to replace the original simple convolutional layer with training parameters several times smaller than VGG. And the accuracy is better.
Deep Residual Network (ResNet) [4] designed a residual module that allows us to train deeper networks. Similar to GoogLeNet, ResNet also uses the global mean pooling layer to train a 152-layer residual network using the residual module. Higher accuracy than VGG and GoogLeNet. In DenseNet [5], since each layer receives feature maps from all previous layers, the network can be thinner and more compact, that is, the number of channels can be fewer. Thus, it has higher computing and memory efficiency. SqueezeNet [6] uses a model compression technique called deep compression to reduce the size of the parameter file. It achieves AlexNet-level accuracy on ImageNet with 50x fewer parameters. As a result, it can be more easily loaded into other hardware with limited memory, and it can be more easily transmitted over a computer network.
In this work, the proposed method captures useful amplitude information from CSI and converts this information into 2D matrices. The 2D matrices are used as input data of the CNNs to distinguish different human states. This eliminates the need for complicated feature engineering. Our method takes advantage of CNN’s success in feature learning and visual recognition to detect the state of indoor people based on CSI.
Materials and methods
CSI signal processing
The inherent flaw of RSSI is considered to be the multipath effect, but multipath is an inherent characteristic of the indoor environment. In order to fully describe the characteristics of each independent path, the wireless transmission channel is considered as a time-varying linear filter, the so-called channel impulse response (CIR) [21]. The CIR describes the reception results of all multipath signals including the line-of-sight (LoS) path. Channel frequency response (CFR) is the Fourier transform of CIR. CFR consists of amplitude-frequency response and phase-frequency response. Both CIR and CFR exhibit small-scale multipath effects and have been widely used for channel measurement [27].
In the early days, special instruments were often used to measure CIR or CFR. CFR can now be obtained from CSI by using a commercial Wi-Fi network interface card (NIC) and modifying the NIC firmware [3]. Consider N CSIs within a time window T, where each CSI on a subcarrier k sampled at time t
i
, i ∈ [1, N] is a complex number
A group of CSIs H (i) reveals n sampled CFRs at the granularity of subcarrier level. In this study, a group of CSIs with 30 subcarriers (n = 30) are collected simultaneously at the receiver. That is, the CFR contains 30 subcarriers. The signal matrix is a complex matrix of 30 subcarriers. The amplitude and phase information of an antenna can be obtained from Eqs. (3) and (4). As an example, Fig. 1 shows the amplitude and phase information of an antenna when a person changes from standing to moving and then back to standing. As shown in Fig. 1, we can observe that the amplitude can reflect the change but the phase does not. Therefore, in this study, the amplitude information will become our input data.

Examples of (a) amplitude and (b) phase information.
The proposed system hardware consists of three main components: 1) Intel 5300 NIC with three antennas as a wireless signal receiver. 2) Toshiba laptop computer with Linux Ubuntu 10.04. 3) TOTOLINK N150RT wireless router as a transmitter operating in 2.4 GHz IEEE 802.11n AP mode. The laptop has an Intel 5300 NIC installed so that the laptop can communicate with the N150RT wireless router. At the same time, a wireless channel test tool, named CSI-Tool [3], is installed in the laptop to collect CSI signals during communication. The Intel 5300 NIC has three antennas, and we extend them all to the outside to improve signal quality, as shown in Fig. 2.

Laptop computer with three extended antennas.
From each packet received by the CSI-Tool, we can extract a 30 × 3 CFR matrix. Each column of the CFR matrix corresponds to an antenna, and each row corresponds to a subcarrier. Then, the CFR amplitudes are calculated according to Eq. (3).
In order to classify the state of a person using CNNs, we need to convert the CFR amplitude matrix into a 2D matrix like an image. We collect CSI signals for a certain time and also normalize the amplitude values to the range of 0 to 255. We use a sliding window of size 30 packets to build a 30 × 3 × 30 matrix. The three antenna signals can be regarded as R, G, B channels. In this way, the CFR amplitudes are converted into a sequence of 30 × 30 color image-like matrices, which are input data for subsequent CNNs. The flowchart of the proposed method is shown in Fig. 3.

The flowchart of the proposed method.
By converting amplitude data into 2D images, CNNs can be used to classify these data into different categories. CNNs automatically extract features from a large amount of data by transforming multiple layers of linear or nonlinear activation functions to achieve feature learning and recognition. In this study, ResNet-18 was chosen because of its small number of parameters, high performance, and fast convergence speed for image classification tasks. In addition, the 2D amplitude images must be scaled because the size is 30 × 30, which is different from the image size required by the ResNet-18 model. The PyTorch framework effectively computes multi-dimensional tensors and supports array calculations through GPU, so it is used in this work.
Most CNNs provide pre-trained models based on the ImageNet dataset [1]. Therefore, the model may not have enough information about the particular CFR images. Transfer learning allows users to use a small amount of newly labeled data to leverage old data to construct high-quality classification models for new data. Accordingly, we will use the transfer learning framework to improve the accuracy of the ResNet-18 model. We start with a pre-trained base model and add a new classifier on top of the base model to make the network output suitable for our task. We then unfreeze a few of the top layers of the frozen base model and jointly train the newly added classifier layer and the last layers of the base model. This allows us to fine-tune higher-order feature representations in the basic model to make it more relevant to our specific task. Here, we unfreeze the top two layers of the frozen base model and use a dense layer with 512 input features and three output neurons as a new classifier to classify human-free, stationary, and movements categories.
Experimental environment setup
To evaluate the performance of our method, we performed real experiments in two indoor environments, one in our laboratory and the other in the student’s bedroom. Figures 4 and 5 show these two environments. The distance between the transmitter and the receiver is 3.7 meters. All these devices are placed at a height of 0.75 meters.
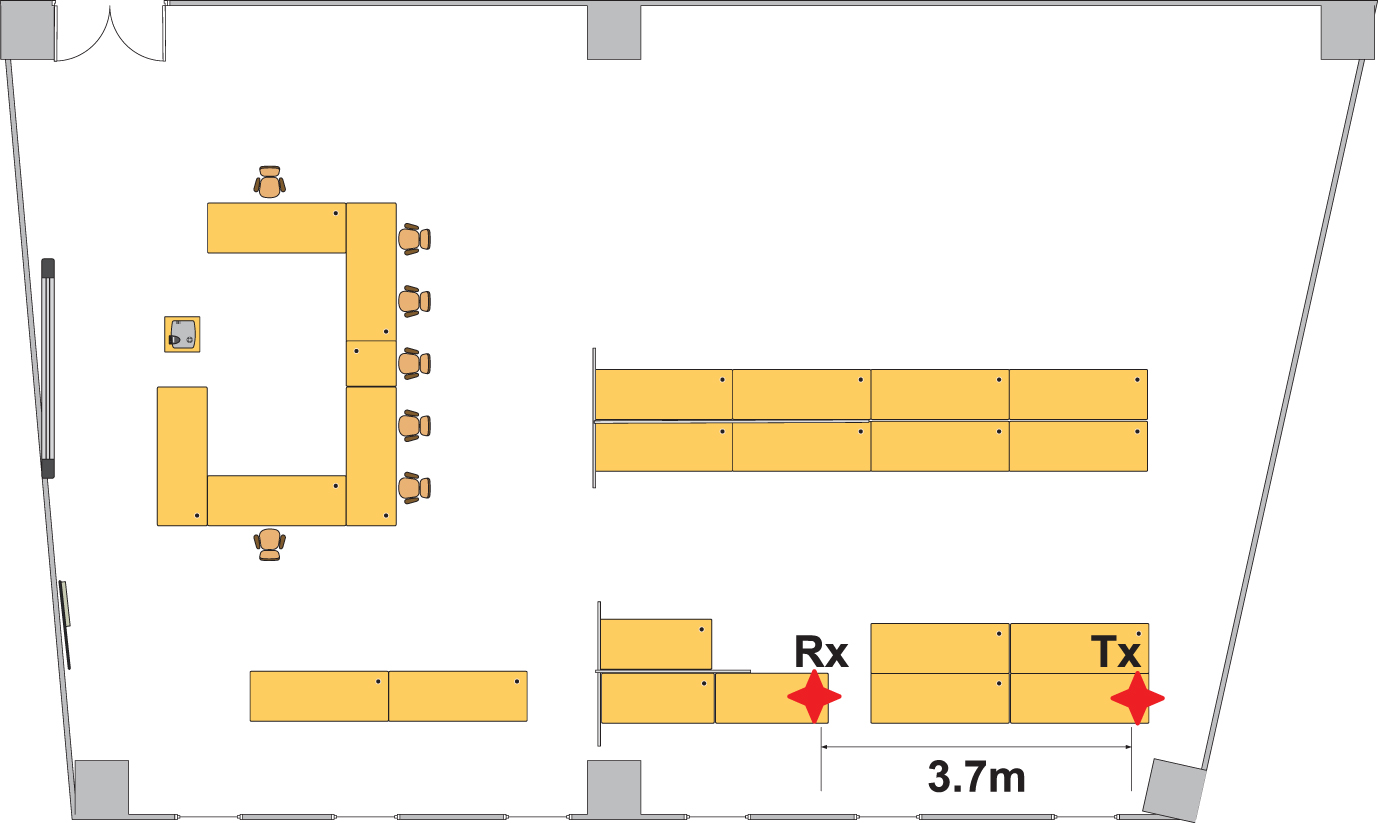
Laboratory map.
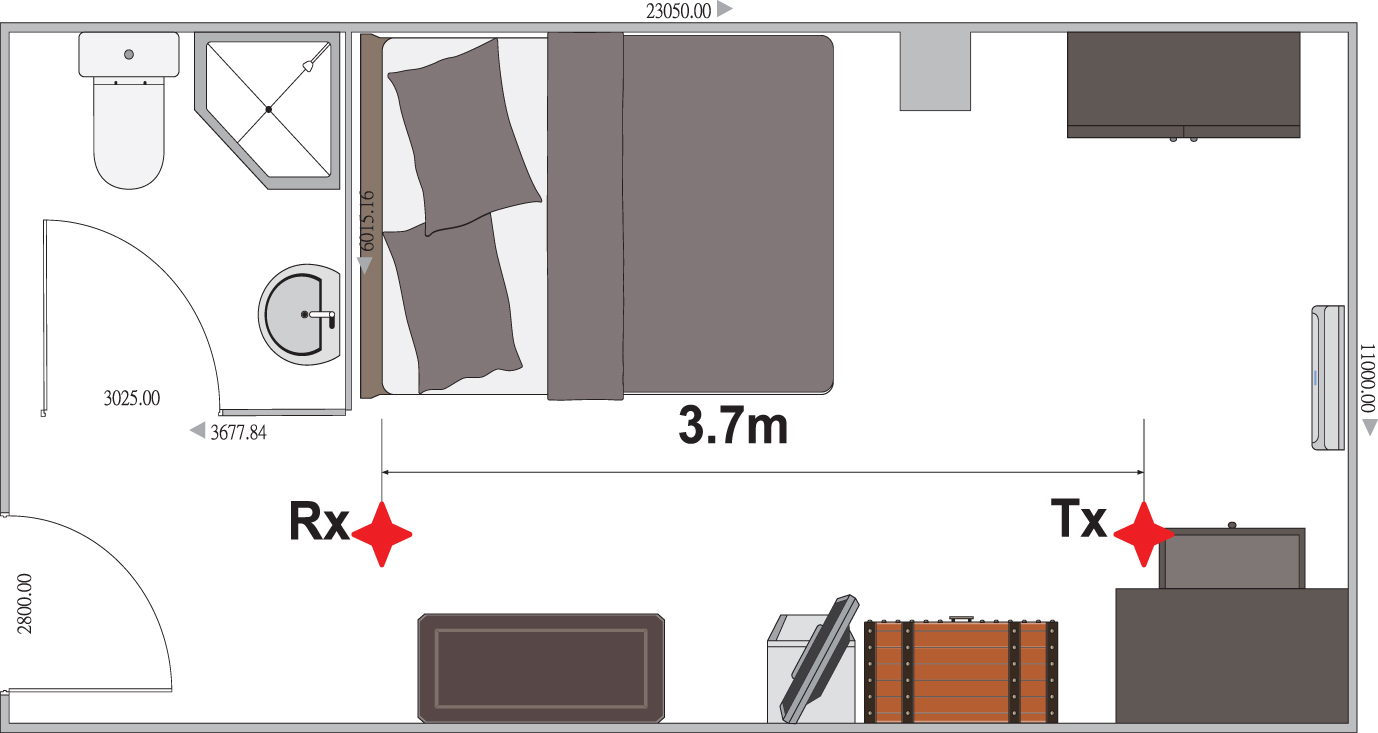
Bedroom map.
We collect data from different human state scenarios including human-free, human stationary (standing or sitting), and human movements. In addition, wireless propagation can be divided into two situations: line-of-sight (LOS) paths and non-line-of-sight (NLOS) paths. Therefore, the experiment involves five test scenarios, as shown in Fig. 6, including: S1: human-free, as shown in Fig. 6(a). S2: LOS stationary, one is standing still or sitting in the LOS path, as shown in Fig. 6(b). S3: LOS movement, one keeps crossing the LOS path, as shown in Fig. 6(c). S4: NLOS stationary, one is standing still or sitting in the NLOS path, as shown in Fig. 6(d). S5: NLOS movement, one moves freely back and forth in the NLOS path, as shown in Fig. 6(e).

Five human state scenarios.
In Fig. 6, symbols T and R represent Tx and Rx, respectively, and a symbol H represents human.
In this study, we spend more than 30 minutes each time in the laboratory and bedroom to collect CSI data in different scenarios. Figures 7 and 8 show examples of the amplitude of the antenna 1 in five scenarios (S1-S5) in the laboratory and the bedroom, respectively. As shown in Fig. 7, we can observe that the amplitude of antenna-1 can distinguish most laboratory scenarios. The amplitude changes in scenarios S1 and S5 seem to be somewhat similar, as shown in Figs. 7(a) and 7(e). This is because there is no one in S1 and no one in the direct wireless link of S5. However, other antenna amplitudes can be considered as other features to further separate different scenarios.

Amplitudes of antenna-1 in five scenarios in the laboratory.
Similarly, as shown in Fig. 8, the same phenomenon can be observed in the bedroom. The amplitude of antenna 1 can also distinguish most scenarios. The amplitude changes in scenarios S1 and S5 look similar because no one is present on the direct wireless link, as shown in Figs. 8(a) and 8(e).

Amplitudes of antenna-1 in five scenarios in the bedroom.
In addition, compared to the amplitude plots of the laboratory (Fig. 7) and the bedroom (Fig. 8), we found that the amplitude of the laboratory changes more than the amplitude of the bedroom. More specifically, even in the same test scenario, the amplitude plots are different at two locations. We will discuss this in the next section.
After converting the amplitudes of the three antennas into image data, we collected ten image datasets including five scenarios for two environments (laboratory and bedroom). Each dataset contains 7,200 images divided into 4,800 training images and 2,400 test images without overlap.
Since most Wi-Fi situations are NLOS in practical applications, the scenarios are divided into LOS groups (S1, S2, and S3) and NLOS groups (S1, S4, and S5) in the performance evaluation. Both the LOS and NLOS groups share a common scenario S1, which means that no one is present. Therefore, we can understand the performance of LOS and NLOS separately. Later, a combination of ResNet-18 and transfer learning was used to classify human states.
LOS group evaluation
Table 1 shows the confusion matrix for the classification results of LOS groups in the laboratory. The proposed method shows high accuracy in laboratory LOS scenarios. In particular, our method achieves close to 100% accuracy. This result can also be clearly observed in Figs. 7(a)–(c). The amplitude plots are significantly different.
Confusion matrix for laboratory LOS group (%)
Confusion matrix for laboratory LOS group (%)
On the other hand, Table 2 shows the confusion matrix for the classification results of LOS groups in the bedroom. The accuracy of scenario S2 is only 86%. About11% were misclassified into scenario S1. This is because the amplitude plots of S1 and S2 are somewhat similar in the bedroom scenario.
Confusion matrix for bedroom LOS group (%)
Table 3 shows the confusion matrix for the classification results of the NLOS group (S1, S4, and S5) in a laboratory environment. The matrix shows that S1 and S5 are a bit confusing, but the accuracy is still higher than 93%. This confusion is also reflected in Figs. 7(a) and 7(e). The amplitude changes in S1 and S5 look somewhat similar. It may be because scenario S1 means that no one exists, and there is also no one in the direct LOS path in scenarios S5. As shown in Table 4, a similar confusion also exists in the bedroom environment. The accuracy of S1 and S4 in the NLOS group is 96.55% and 98.06%, respectively. However, the accuracy of the S5 is only 91.82%. Figures 8(a) and 8(e) also show similar amplitude changes.
Confusion matrix for laboratory NLOS group (%)
Confusion matrix for laboratory NLOS group (%)
Confusion matrix for bedroom NLOS group (%)
According to Table 1–4, a reasonable conclusion can be drawn, that is, in the LOS path, the CSI-based detection performance is better than the NLOS path. Due to page limitations, we only show the amplitude of antenna 1. However, three antenna amplitudes are used to construct the input image. Therefore, other antenna amplitudes can be considered as other features to further improve performance.
In this experiment, we also evaluated a mixed datasets of LOS and NLOS to understand the performance in practical applications. In other words, the datasets of the stationary scenarios S2 and S4 are mixed, and the datasets of the movement scenarios S3 and S5 are mixed together. Therefore, the classification target is still three categories with 24,000 training images and 12,000 test images in the laboratory and bedroom environments, respectively.
Table 5 shows the confusion matrix for the classification results of mixed LOS and NLOS datasets in the laboratory environment. The accuracy of the stationary is close to 100%. However, the accuracy is only 94% in the human-free and movement scenarios. As shown in Table 3, we have introduced that signals in the human-free and movement scenarios are a bit confusing for NLOS. Therefore, when we mix LOS and NLOS datasets, performance will not be better than that of LOS. Similarly, the same happens in the bedroom environment, as shown in Table 6.
Confusion matrix of mixed LOS and NLOS in the laboratory
Confusion matrix of mixed LOS and NLOS in the laboratory
Confusion matrix of mixed LOS and NLOS in the bedroom
The diversity of training data ensures that the data contains sufficient discriminant information and can also help machine learning algorithms avoid the problem of overfitting [2]. Therefore, in order to increase the diversity of training data to obtain a more robust trained mode, we mixed the datasets of different environments and propagation paths. As a result, a total of 48,000 training images and 24,000 test images were used in training and testing of this test. The confusion matrix is shown in Table 7. The accuracy of human-free, stationary, and movement is approximately 94%, 98%, and 97%, respectively. Although the amplitude plots look very different in different environments, as shown in Figs. 7 and 8, the test results show that the model still produce good results due to the powerful classification capabilities of ResNet-18.
Confusion matrix of mixed environments and propagation paths
The typical application for indoor human detection is intruder detection. Detecting the presence or absence of people is also considered in this study. Therefore, we also mix the datasets of different environments and propagation paths, but divide them into two categories, human presence and absence. That is, the human presence class contains scenarios of S2, S3, S4, and S5, while the human absence class contains only S1, including 4,800 training images and 2,400 test images. However, if all datasets of S2–S5 are used for the human presence class, it will result in data imbalance.
Imbalanced data means that most examples represent the majority class. On the other hand, minority examples are relatively rare. In this case, the standard classifier favors the majority class. As a result, examples of the minority classes are often misclassified [13]. To avoid data imbalances, we simply under-sampled the examples of the majority class. That is, we randomly sampled the same amount of data as the human absence class.
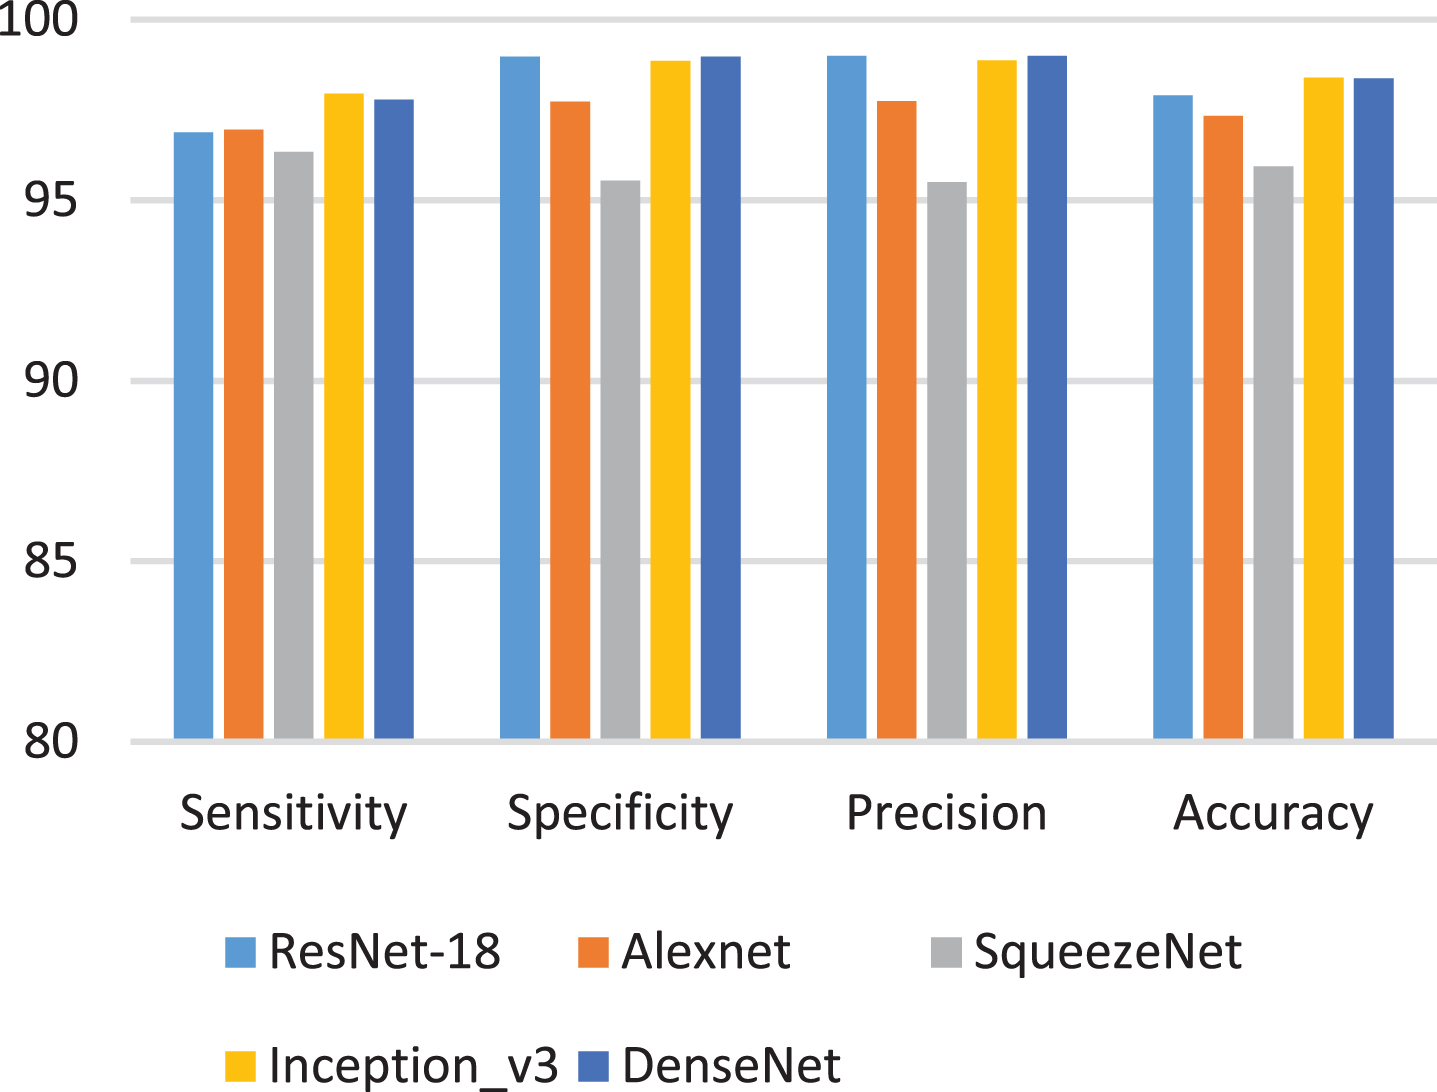
Meanwhile, in order to compare the performance of different CNN models, five modern CNN models including ResNet-18, Alexnet, SqueezeNet, Inception v3, and DenseNet were tested in the experiments. Metrics for sensitivity, specificity, precision, and accuracy are used to evaluate the performance of these models. The comparison of CNN models and the classification results of human presence or absence are shown in Fig. 9. Obviously, the performance of SqueezeNet is very poor, because its model size and parameters are smaller than other models. However, all metrics of all models reached more than 95%. Overall, ResNet-18, Inception v3, and DenseNet have similar performance.
CNN model comparison and classification results of human presence or absence.
In this work, CSI amplitude data for different human states were collected in various situations, including different environments (laboratory or bedroom) and propagation paths (LOS path or NLOS path). We convert the amplitude information from CSI data to 2D image data. The pre-trained ResNet-18 CNN model is suitable for automatically extracting human state features and classifying different human states from 2D image data. We studied several dataset combinations for different environments and propagation paths. The experimental results show that the fine-tuned ResNet-18 model has good performance in indoor human state detection, including human absence, human stationary and human movement.
The experiment also compared five modern CNN models to evaluate the performance of indoor human detection applications. The results show that ResNet-18, Inception v3, and DenseNet have similar performance overall. This experiment also provides evidence that CSI amplitudes can be applied to indoor human detection, and CNN models can provide powerful classification capabilities in such applications.
Studies have also shown that Wi-Fi signals can be converted to image-like data. Then, taking advantage of CNNs can provide good results without the handcrafted features used in traditional machine learning methods.
Footnotes
Acknowledgments
This work was supported by the Far Eastern Int’l Bank and Far EasTone Telecommunications in Taiwan.