
Abstract
In this paper, a novel hybrid approach for deterministic and probabilistic occupancy detection is proposed with a novel heuristic optimization and Back-Propagation (BP) based algorithms. Generally, PB based neural network (BPNN) suffers with the optimal value of weight, bias, trapping problem in local minima and sluggish convergence rate. In this paper, the GSA (Gravitational Search Algorithm) is implemented as a new training technique for BPNN is order to enhance the performance of the BPNN algorithm by decreasing the problem of trapping in local minima, enhance the convergence rate and optimize the weight and bias value to reduce the overall error. The experimental results of BPNN with and without GSA are demonstrated and presented for fair comparison and adoptability. The demonstrated results show that BPNNGSA has outperformance for training and testing phase in form of enhancement of processing speed, convergence rate and avoiding the trapping problem of standard BPNN. The whole study is analyzed and demonstrated by using R language open access platform. The proposed approach is validated with different hidden-layer neurons for both experimental studies based on BPNN and BPNNGSA.
Keywords
Introduction
Probabilistic and deterministic occupancy level of a smart building (OLB) effect the requirement of electrical energy consumption, which varies with respect to the level of occupancy as well as the catastrophic weather condition variation. Therefore, optimal and correct prediction of OLB is a key research area for the precise and optimal planning of energy management and distribution in term of peak load scheduling.
Generally, commercial buildings consumes 1/4 to 1/5 part of generated electricity of the nation, which is always in TWh [1]. And most of this energy (i.e., ∼60–70%) is consumed by the ACMV (Air-Conditioning and Mechanical Ventilation)/HVAC (Heating, ventilation, and air conditioning) system [1], which is highly dependent to volume level of occupancy of the building. So, identification/prediction of OLB lead the optimal scheduling, maintenance, planning and facility management and regulation of the building.
In the market, there are several commercial solution are available for OLB, which can be detected by using vision sensors, and other sensor (such as –CO2, Light, PIR (passive infrared sensor), electrical quantities etc). The off-the-shelf, available several studies in the research domain for OLB are: stochastic occupancy model [2], Radio-frequency Identification (RFID) [3], video camera and CO2, temperature, wireless sensor based [4–6], graphical model [7], SVM & hidden Markov models [8, 9], extended Kalman filter [10], decision trees [11], PSO based ANN [38] etc. in this study, a standard BPNN model with GSA is implemented which has high convergence speed and prevent the BPNN from trapping in local minima with optimal value of weight and bias. Moreover, this study is extended study of the [38].
In the organization of this paper and proposed research work is covered into five sections. Section-1 introduces the introduction. Section-2 represents the brief overview of the collected experimental dataset and correlation analysis. The proposed approach which is developed in this study is presented in section-3, which includes the mathematical modeling of both standard BPNN and GSA algorithms and it implementation procedure in form of BPNNGSA. The section-4 narrate the full story of the proposed approach’s results and discussion along with experimental demonstrate and finally conclusion is represented in section-5.
Brief overview of the dataset
Dataset collection
The collected dataset includes the following five variables: RH (humidity in %), T or Temp. (Temperature in °C), carbon dioxide (CO2 in ppm-part per million), Light (unit:Lux) and HR (unit:kgwater-vapor/kg-air). The value of these logged variables are depends on the level of occupancy, which is always in form of [0, 1] occupied or not occupied the space. The collected dataset was recorded in between February 2 to February 18, 2015 which is analyzed and represented in Figs. 1 4. The data logging is during [00:00:00] to [23:59:00] for each day. These figures are the rose plot of the dataset, which show the probabilistic variation of the whole dataset with respect to the time. It generate a histogram of angles, which shows the distribution of data in 20 different or less angle bins and the length of bin represents the number of data samples within the similar group.
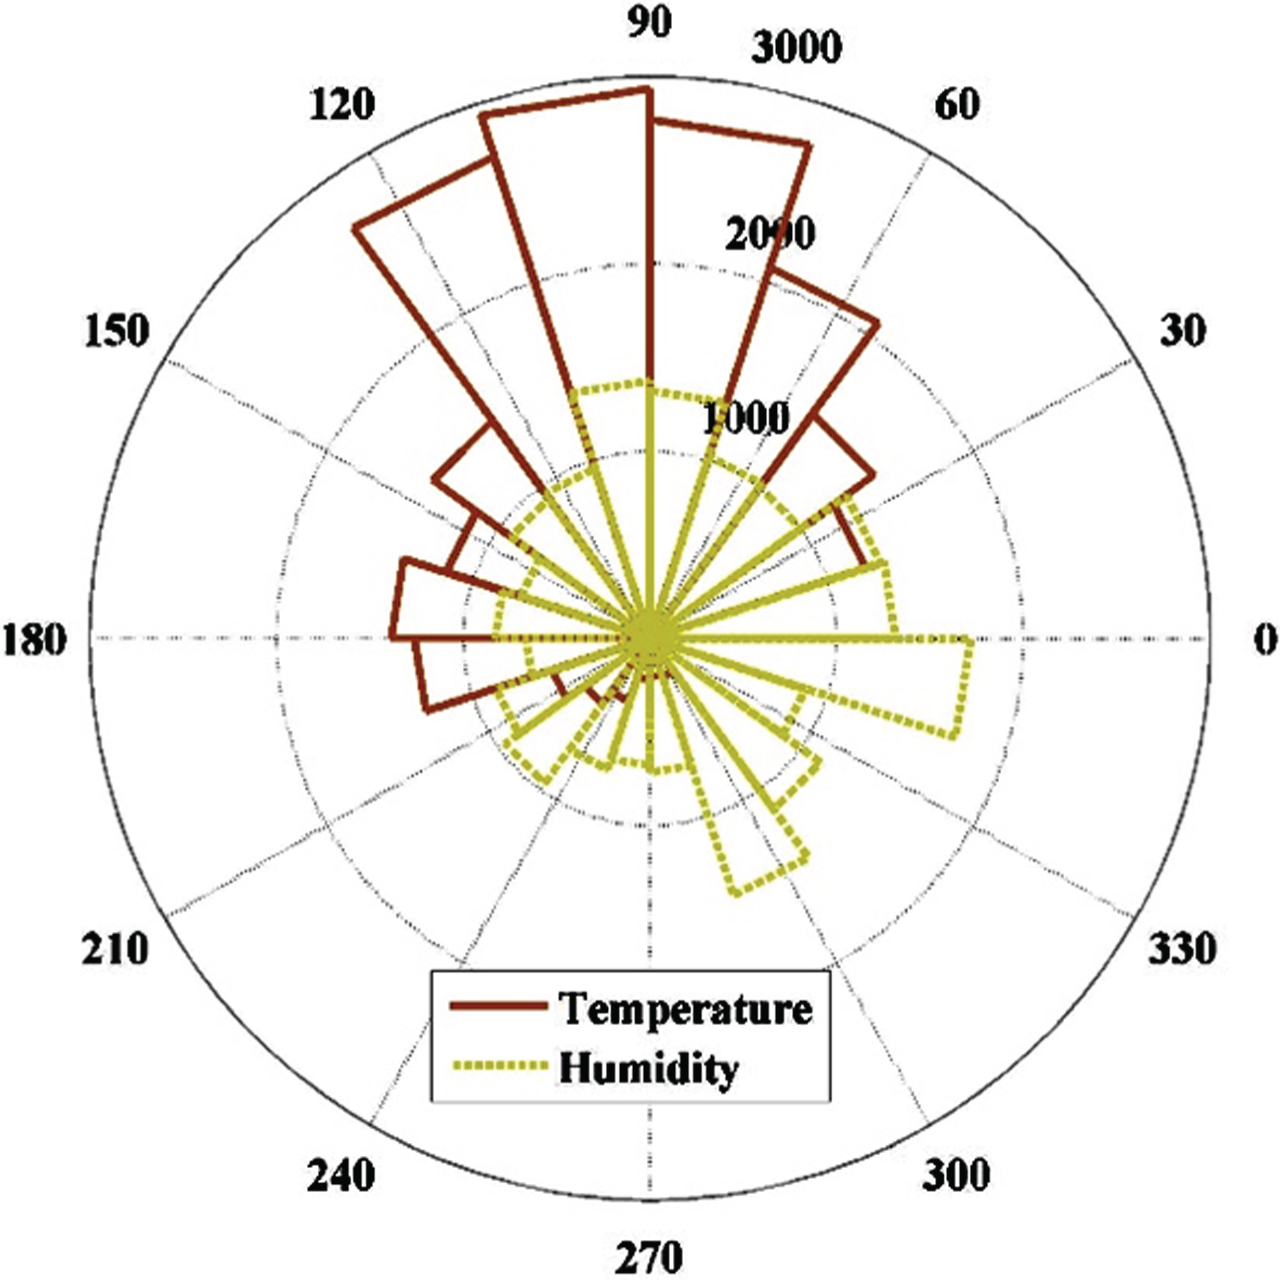
Logged data rose plot of temperature and humidity.
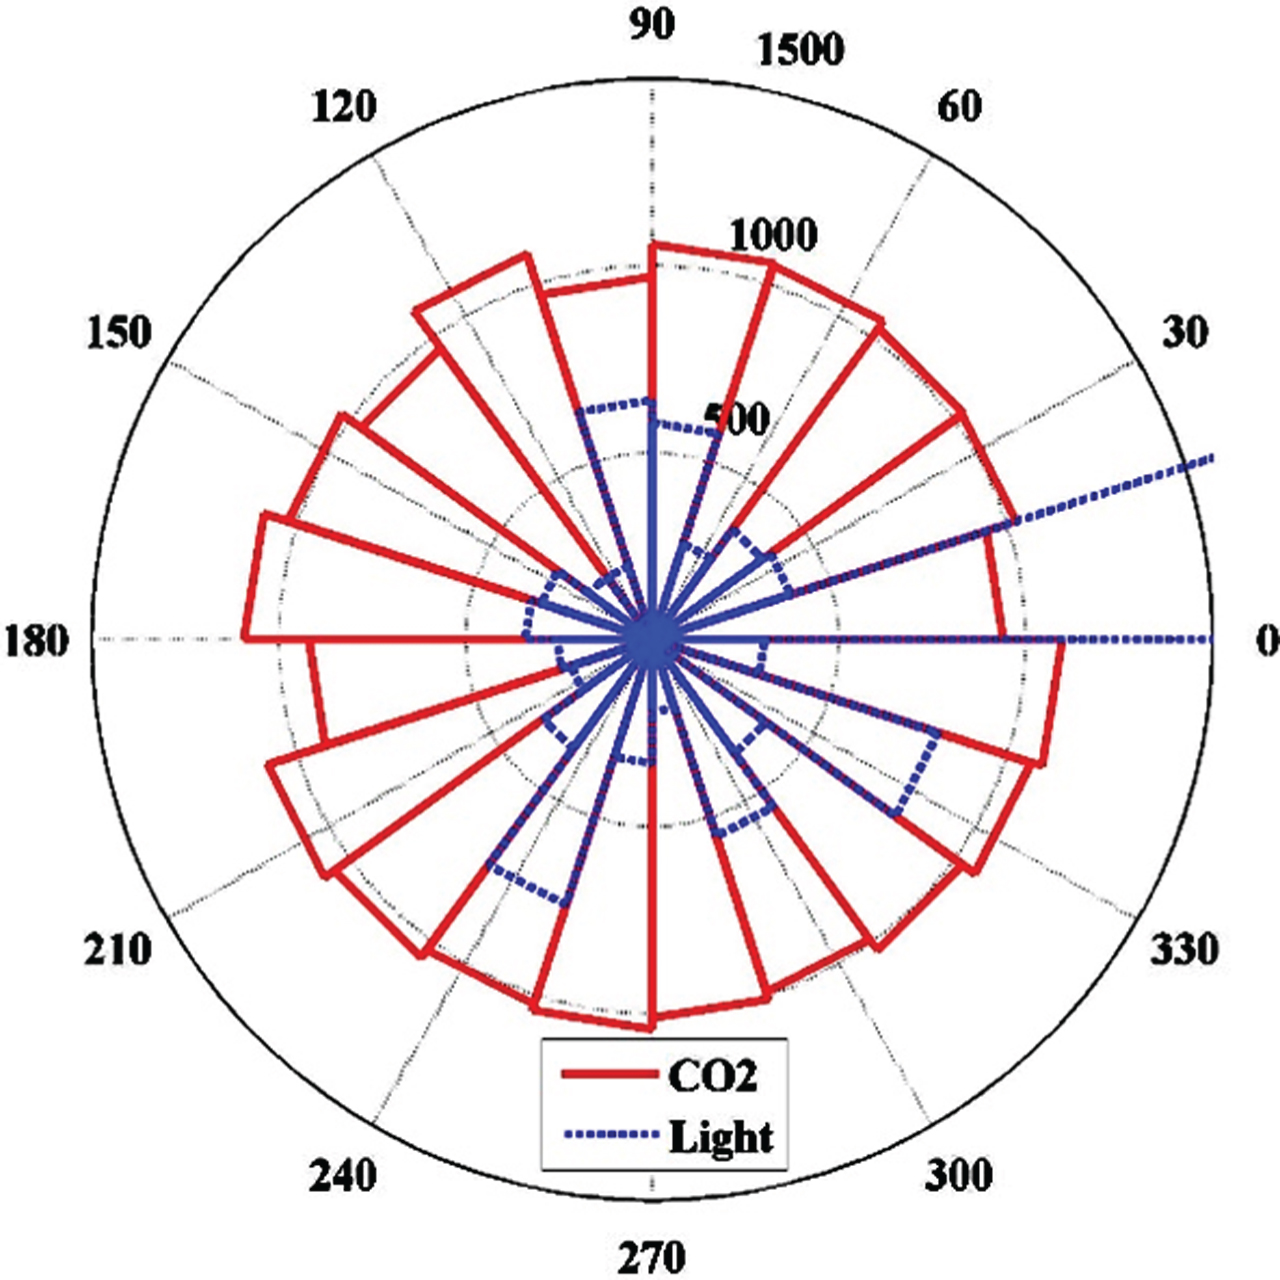
Logged data rose plot of CO2 and Light.
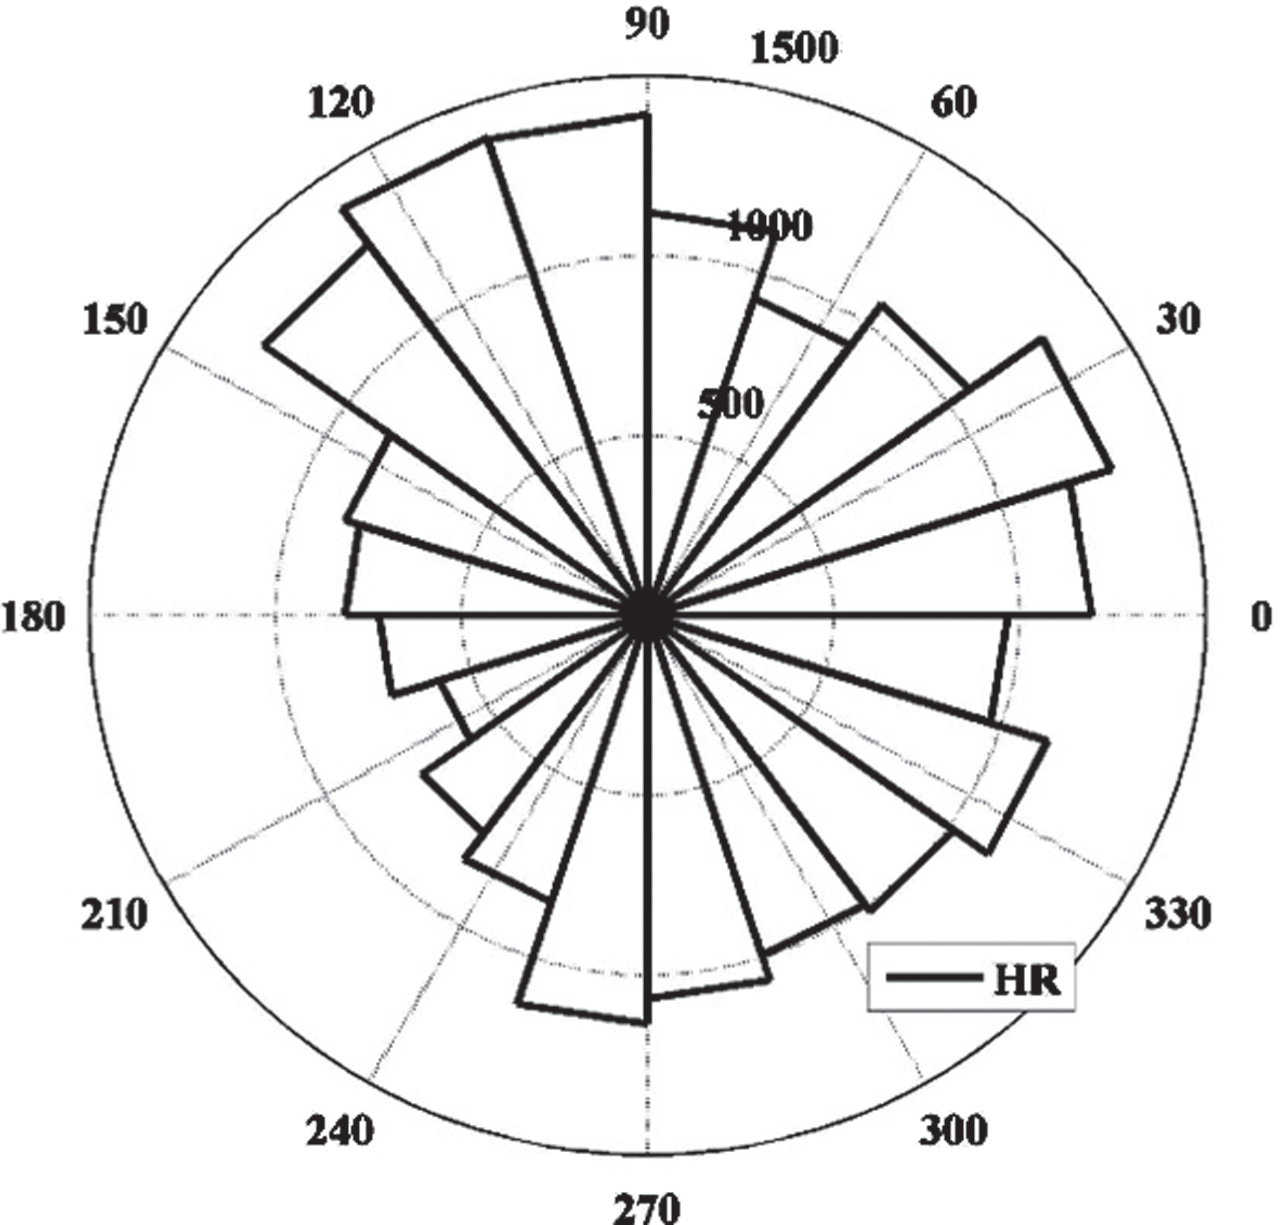
Logged data rose plot of HR.

Logged data rose plot of occupancy.
Moreover, Figs. 5 10 show the real-time representation of the temperature, humidity, light, CO2, HR (humidity ratio) and occupancy respectively for two days (for full 24 hours during February 5 to February 6, 2015). The Table 1 shows the statistical characteristics (such as max.: maximum value, mean value, min.: minimum value, STD: standard deviation-std dev, Var: variance) of the collected dataset.
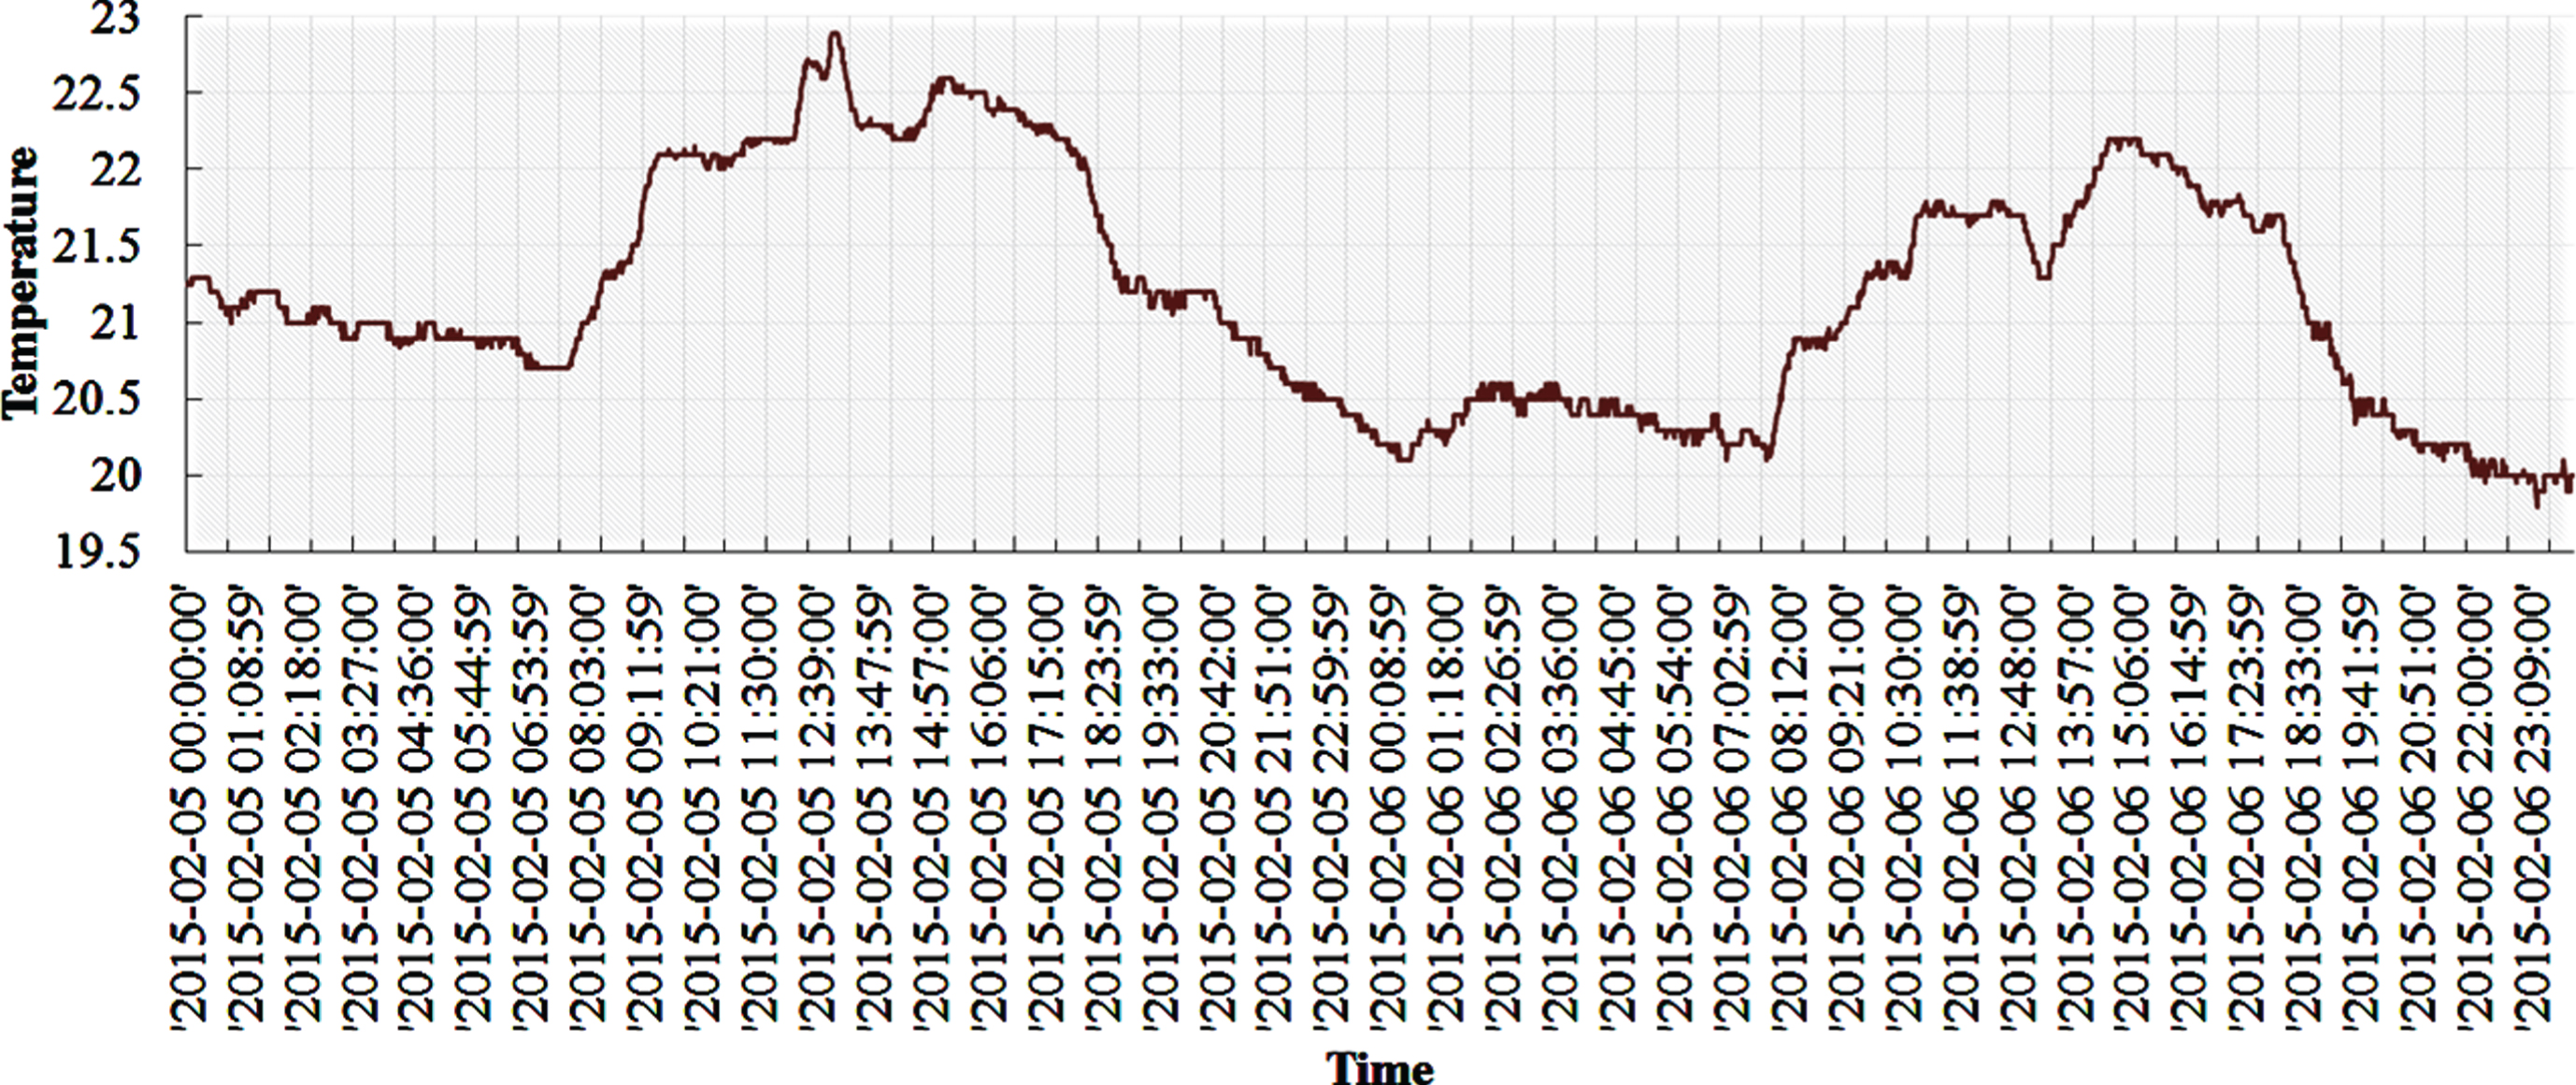
Logged temperature data profile for 2 days (data representation of February 5-6, 2015).
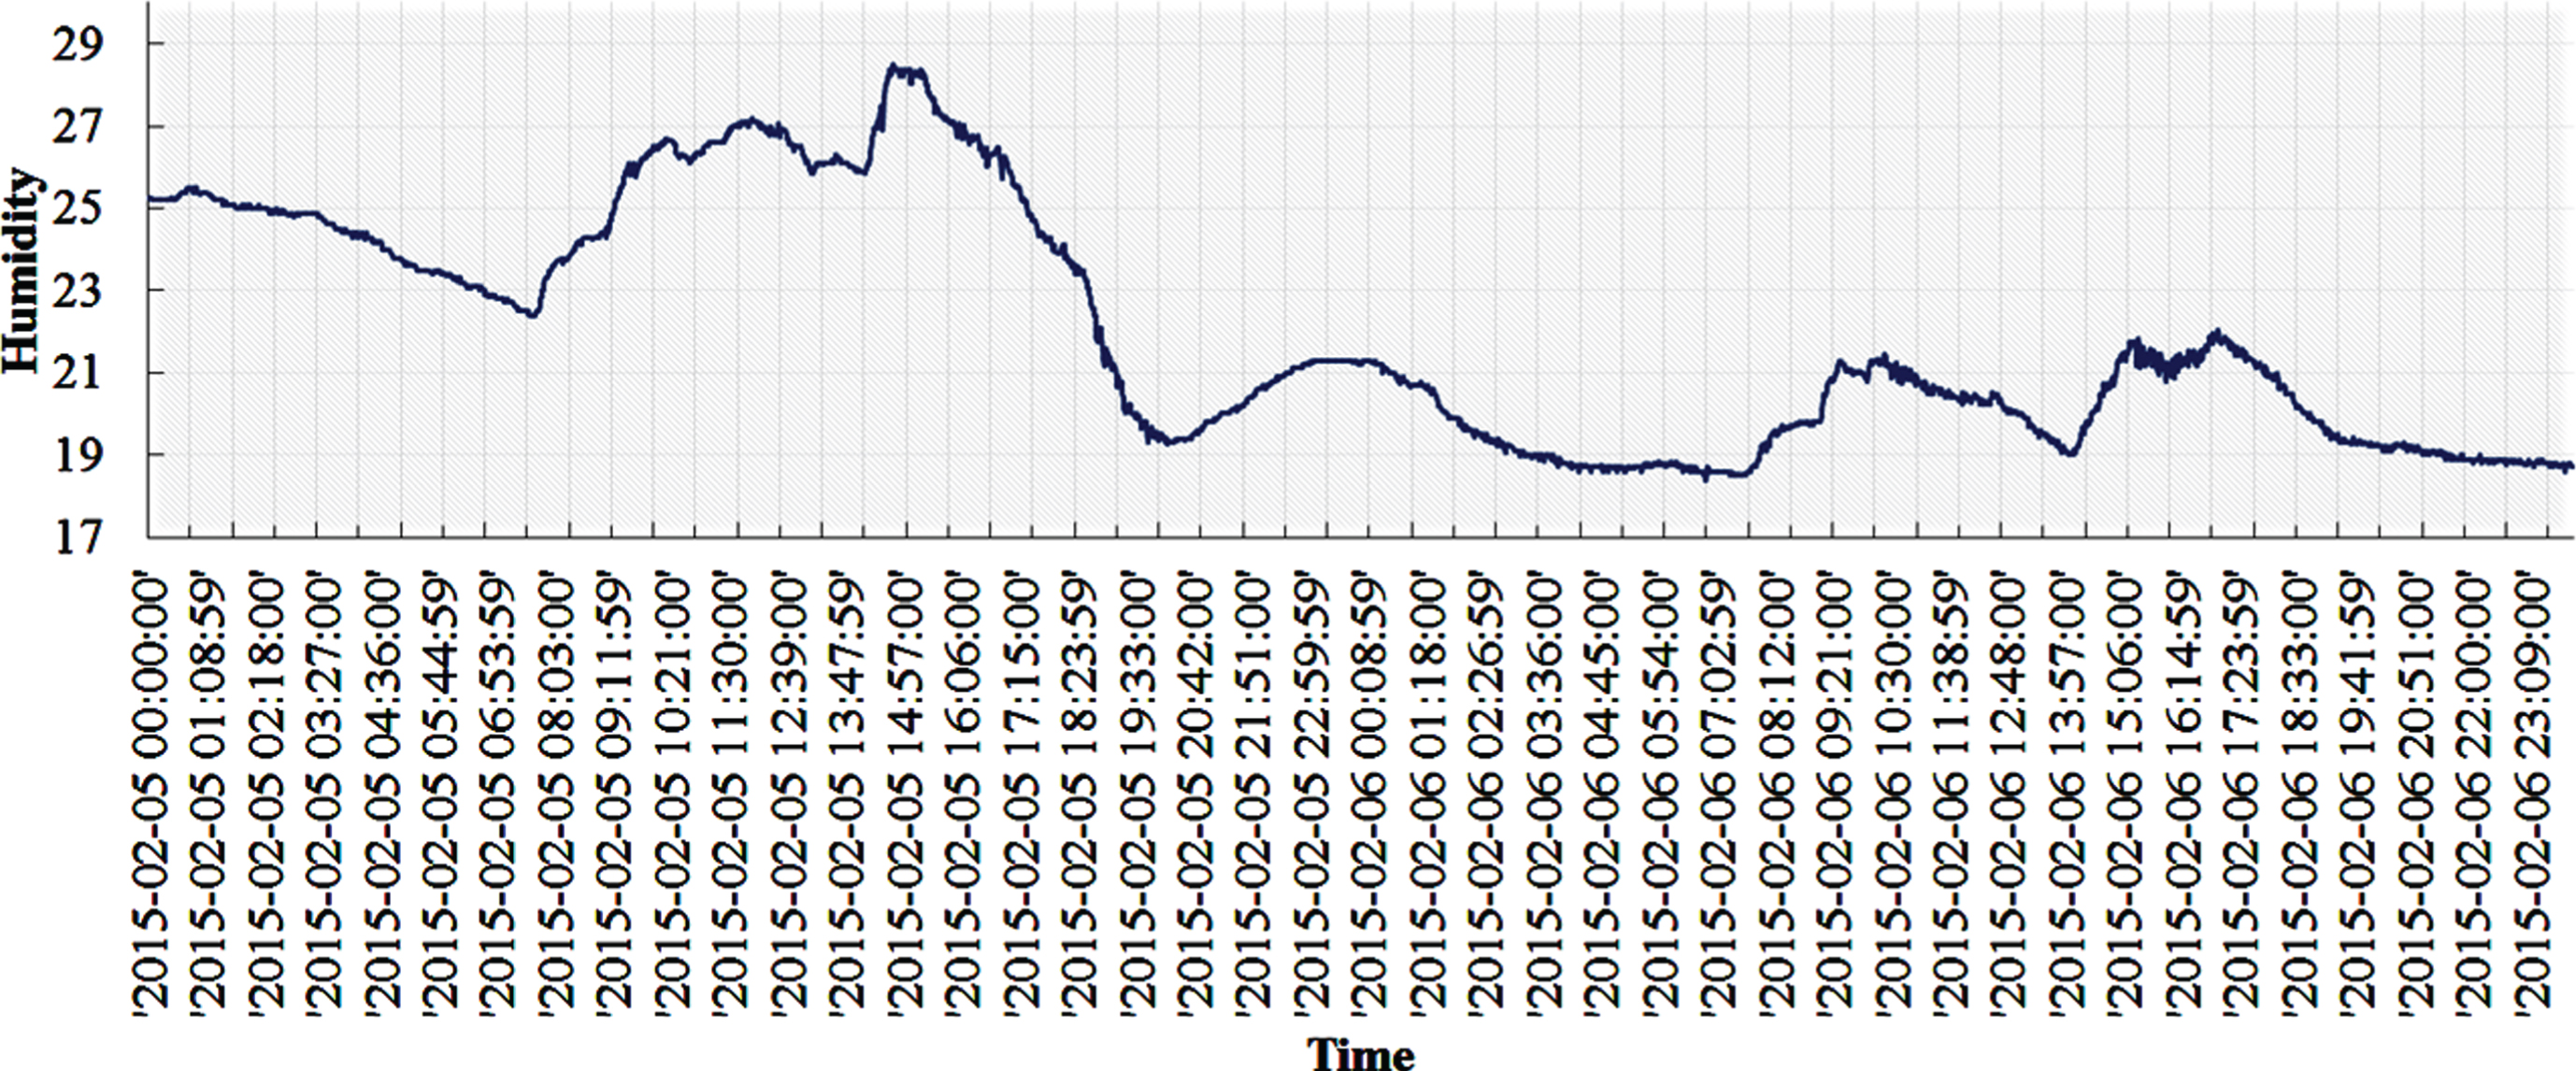
Logged humidity data profile for 2 days (data representation of February 5-6, 2015).
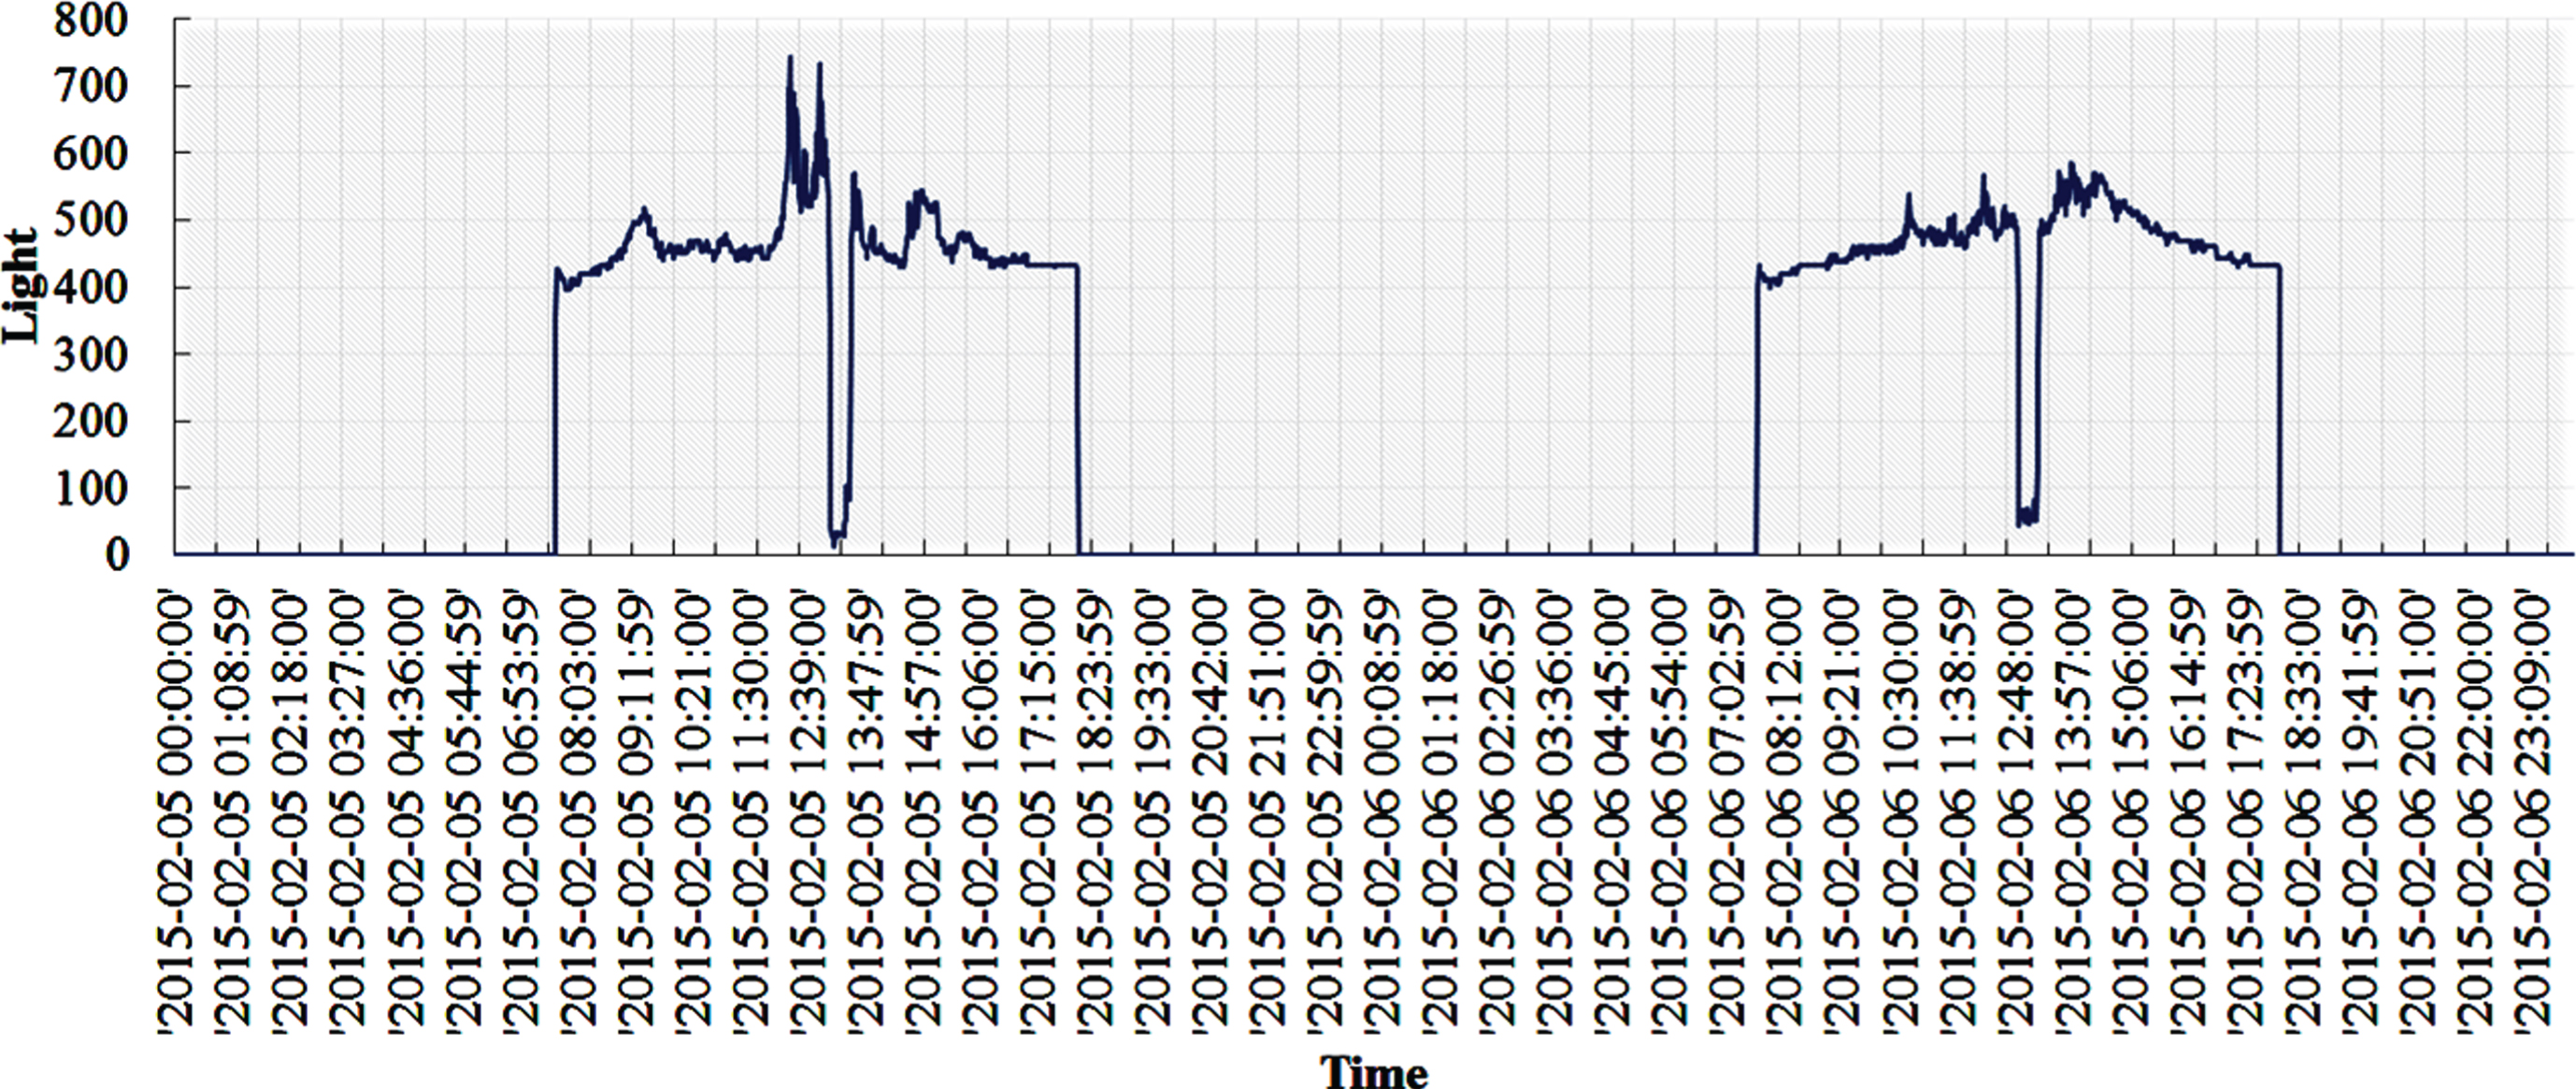
Logged light data profile for 2 days (data representation of February 5-6, 2015).
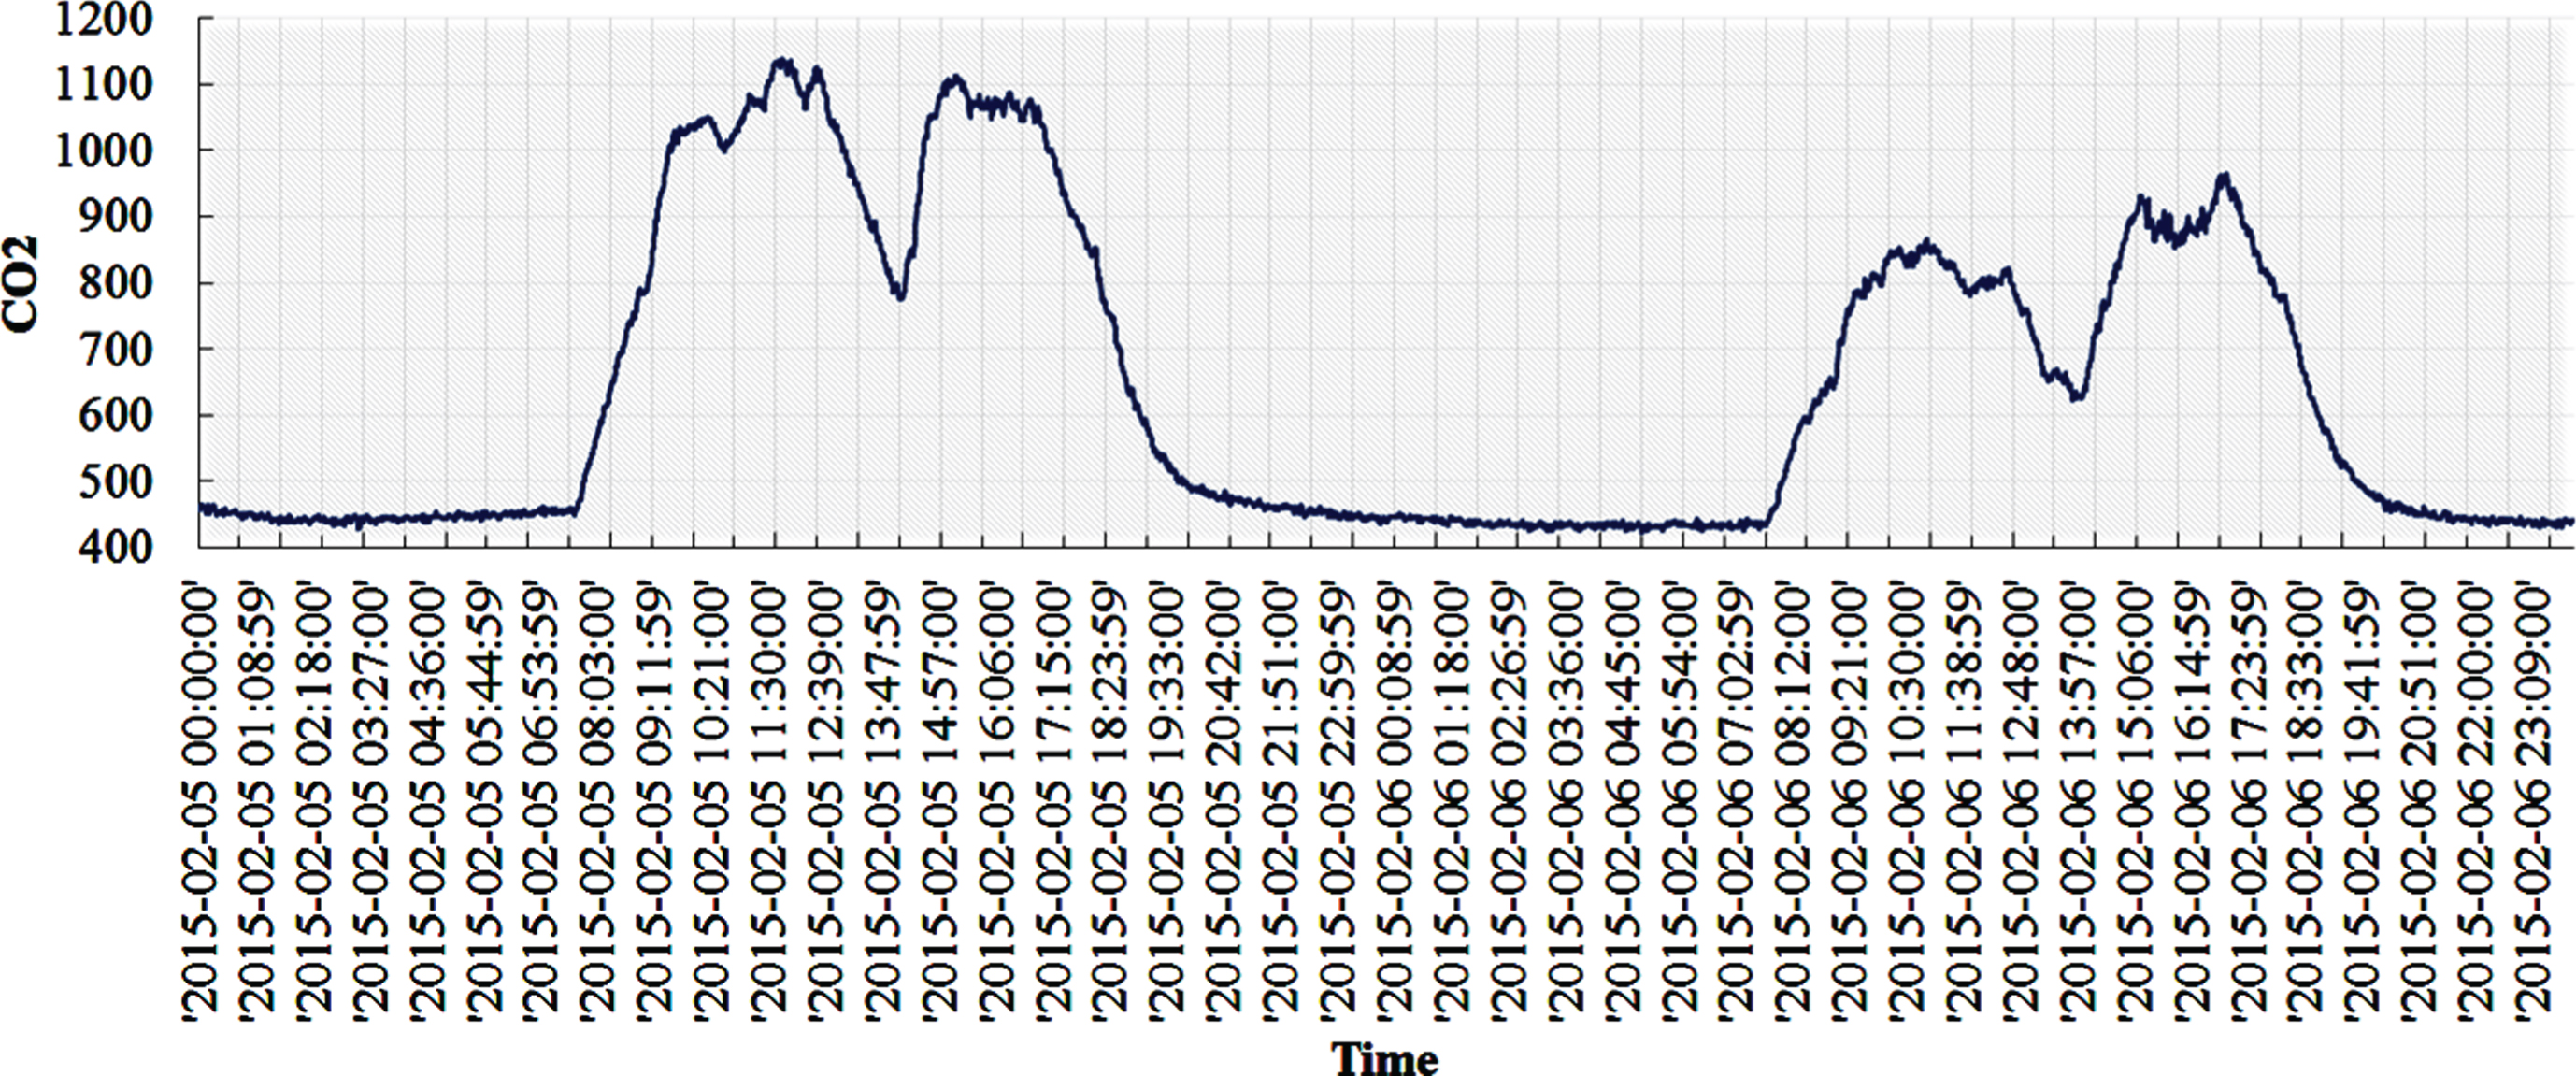
Logged CO2 data profile for 2 days (data representation of February 5-6, 2015).
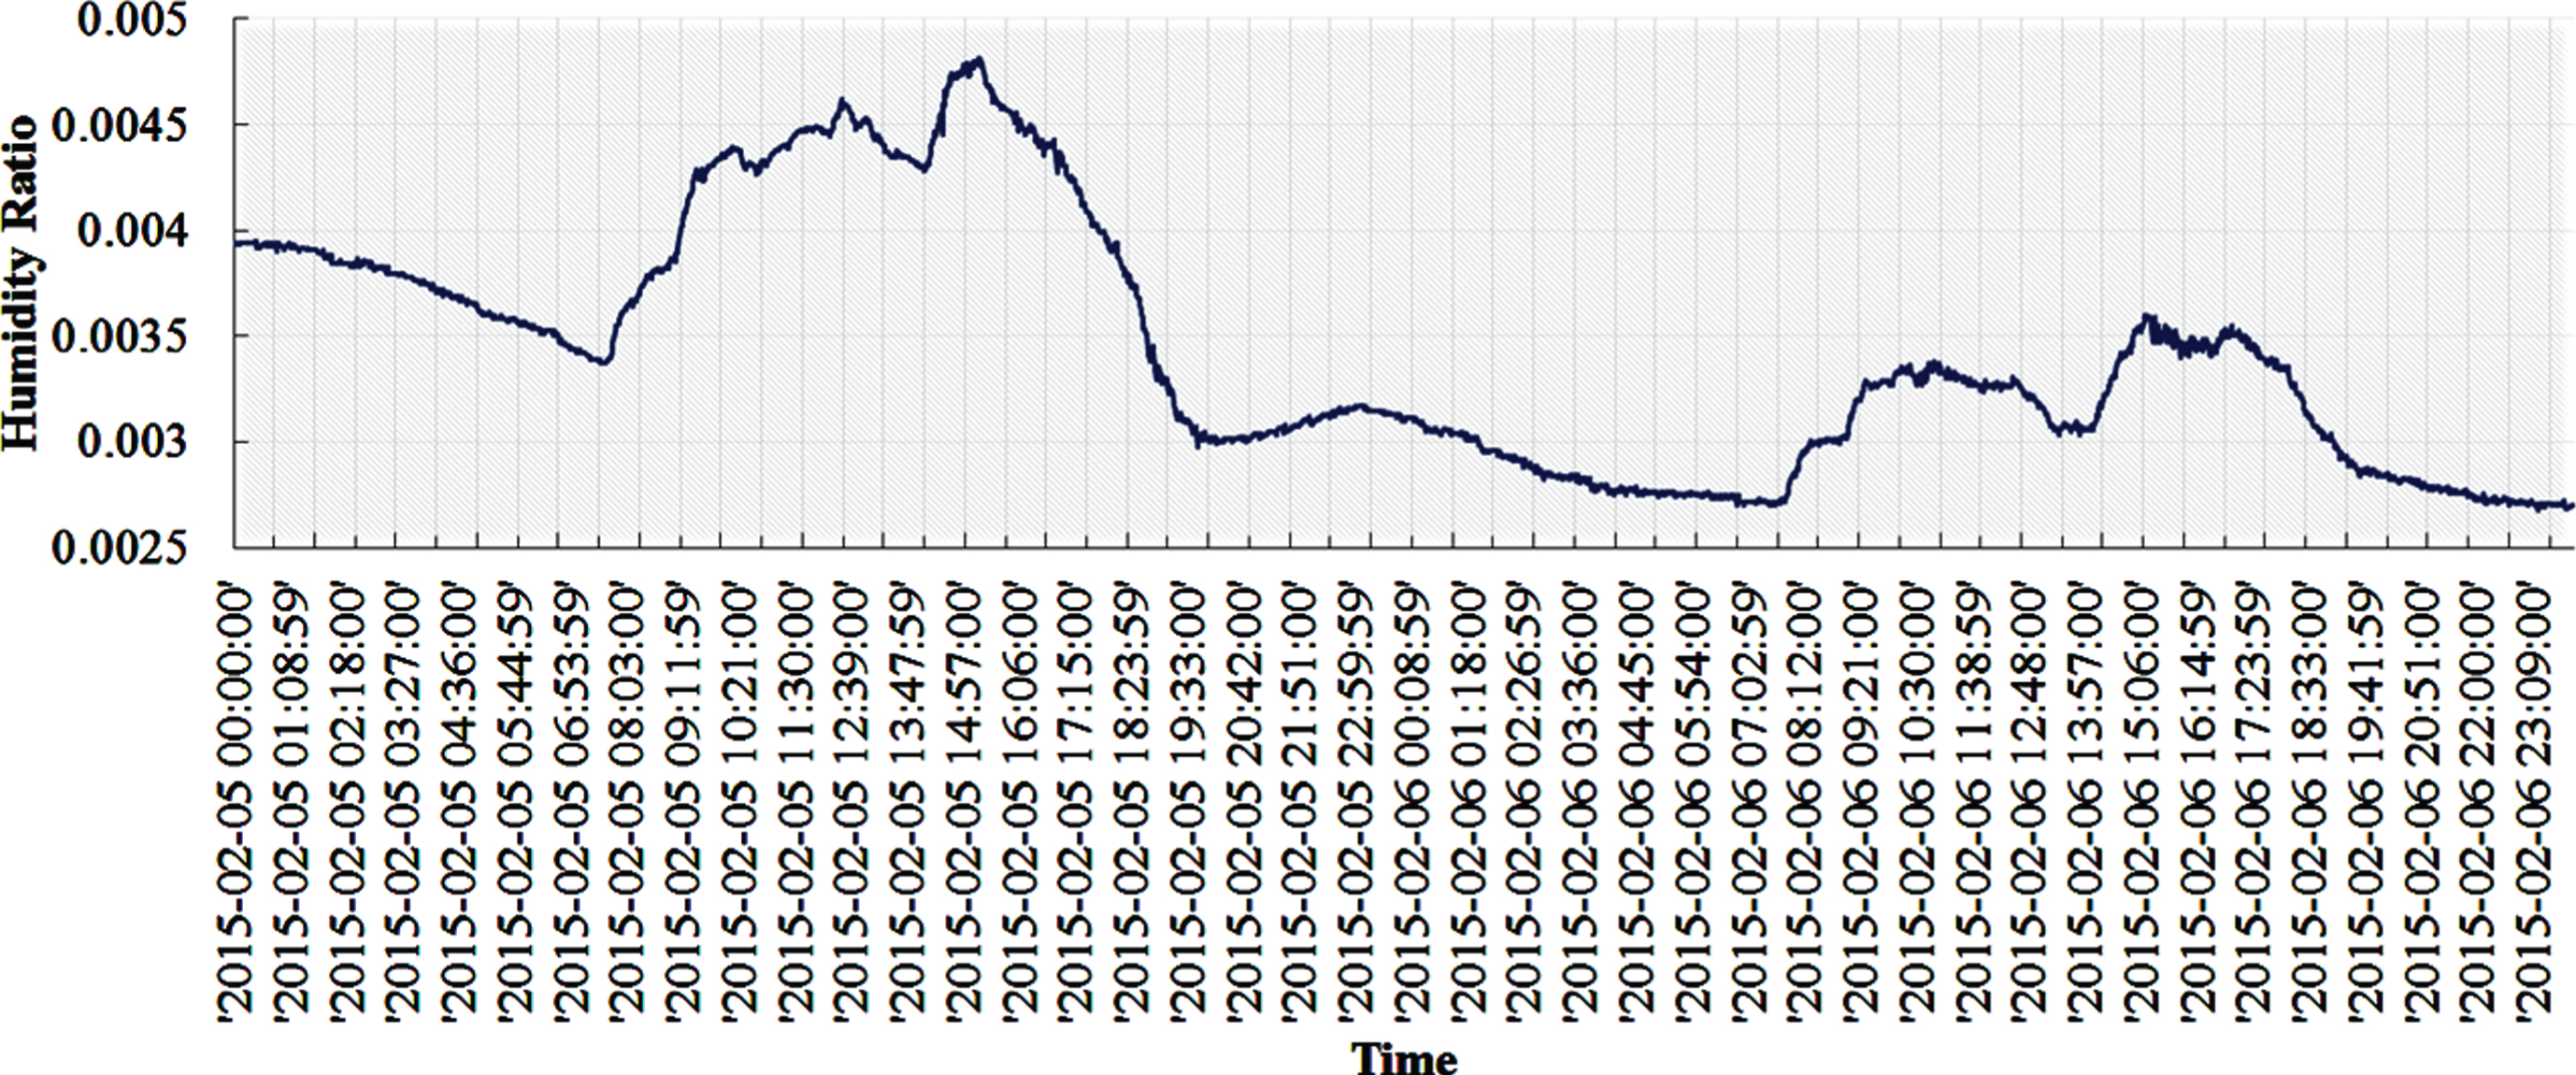
Logged humidity ratio data profile for 2 days (data representation of February 5-6, 2015).
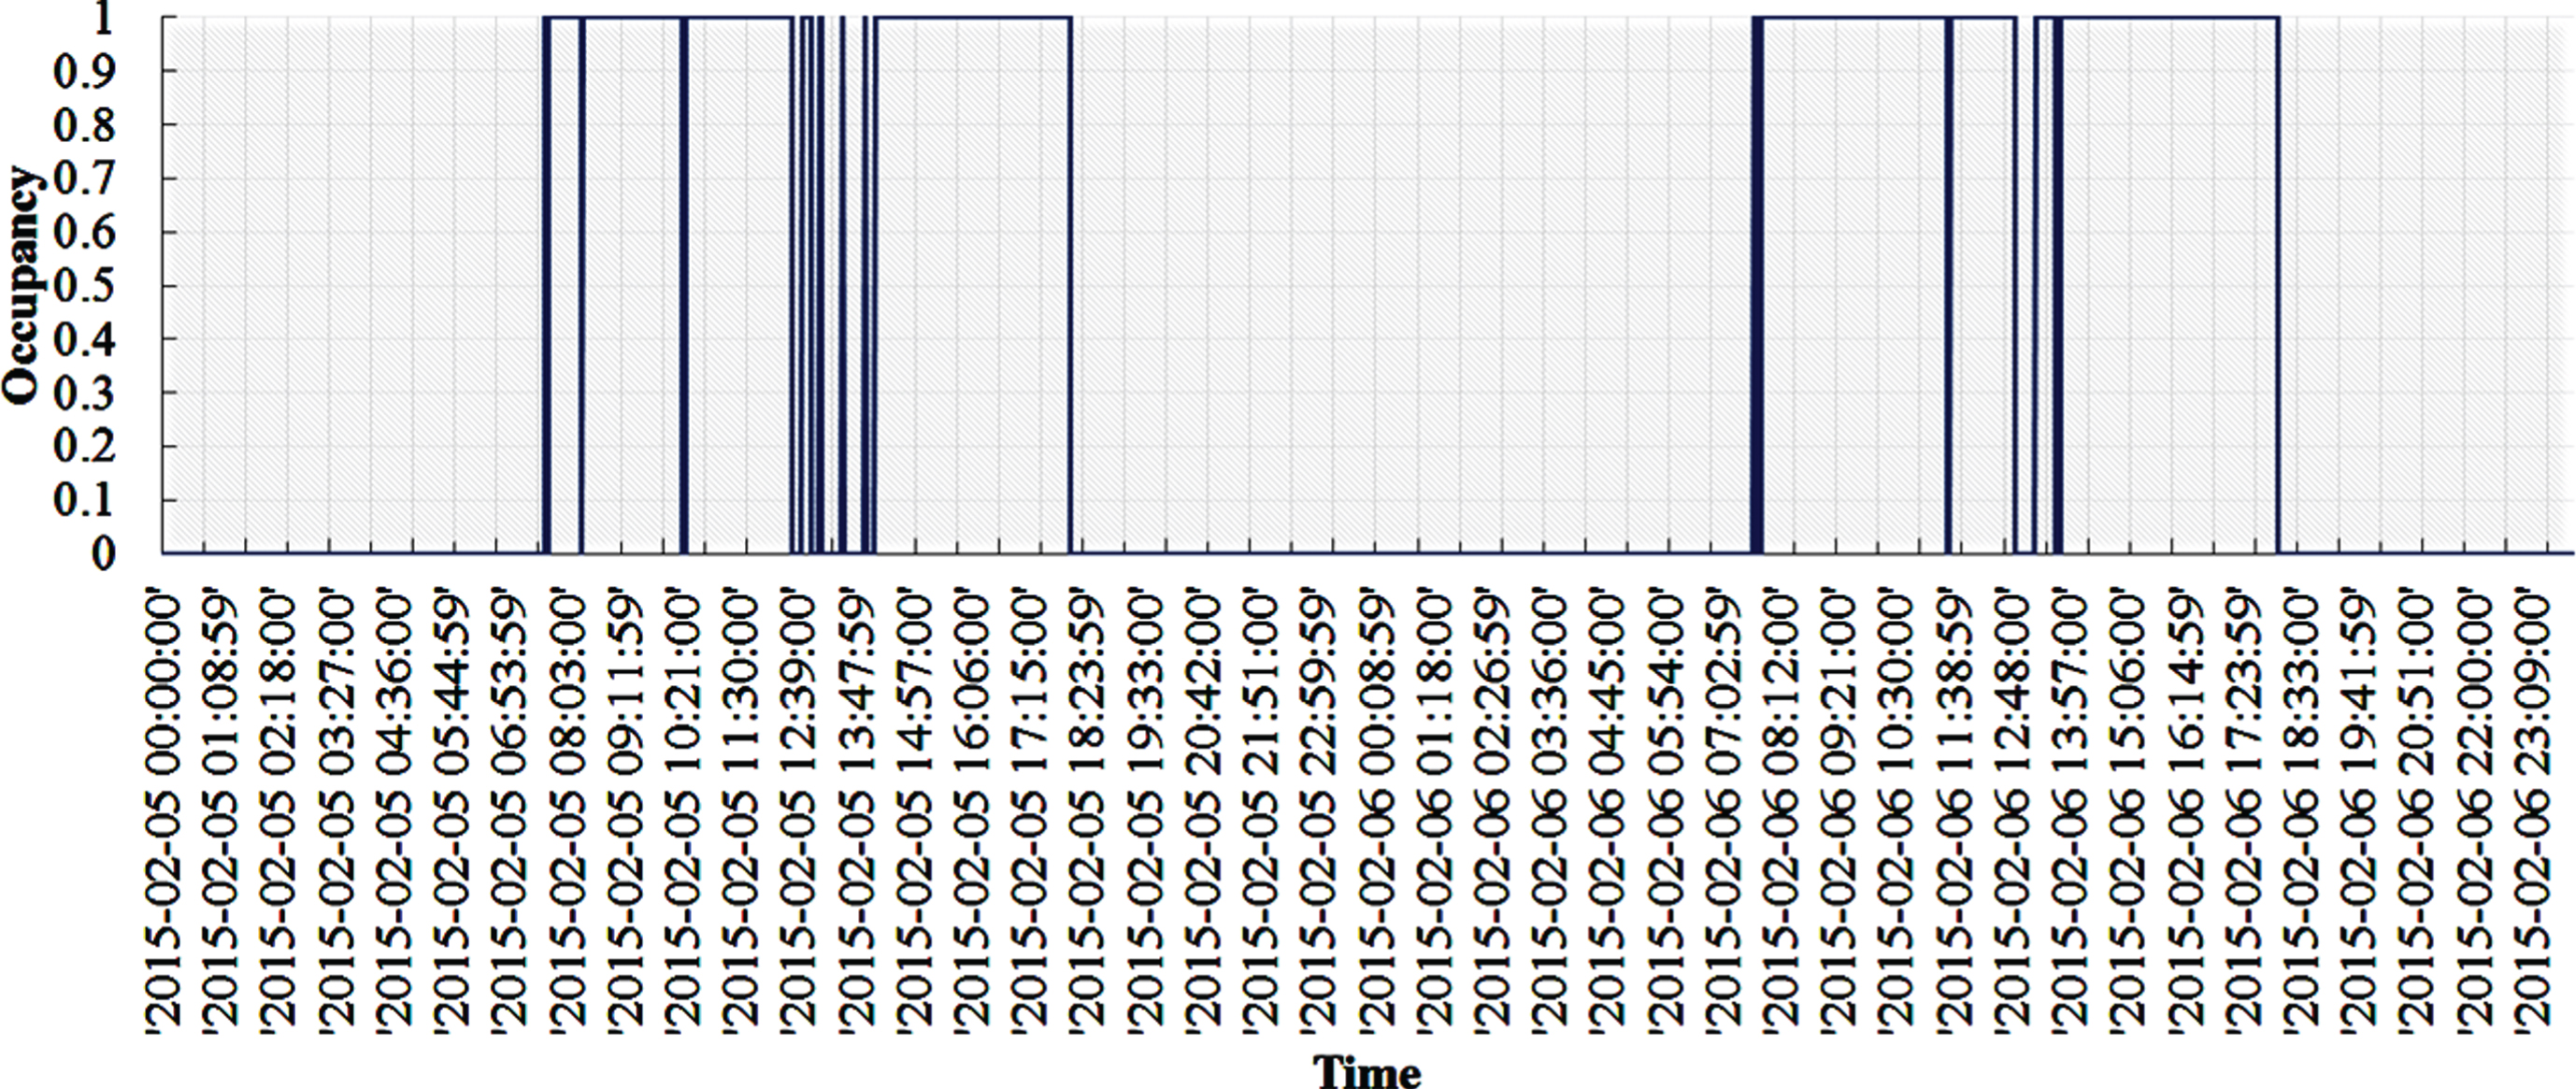
Logged occupancy data profile for 2 days (data representation of February 5-6, 2015).
Statistical analysis representation of the logged dataset
The whole logged dataset for occupied and unoccupied condition of the building was recorded at University of Mons, Belgium [12].
The Table 2 shows the statistical analysis of four different sets of data (i.e., training, testing#1, testing#2 and whole data). The value of Var, STD and means for all logged dataset are evaluated, which represent the characteristics of the real-time dataset. STD represents the level of deviation/variation from the mean value of the dataset. The low value of STD always be good and represent the closeness to the mean value. The Var shows the random variable from its mean. Generally, it identify the outlier in the dataset in an easy manner.
Logged variable’s correlation analysis for occupancy detection using six machine learning methods
The data correlation analysis of the variable (CAV) of dataset with respect to the target value is very important to identify the importance level of the variable whether a particular variable is useful or not for this problem of occupancy detection. The CAV computation are executed by using six machine learning algorithms along with Ranker search method in R open access software [13, 14]. These CAV algorithms are: 1) CRAE:(CorrelationAttributeEval), 2) GRAE:(GainRatioAttributeEval), 3) IGAE: (InfoGainAttributeEval); 4) ORAE: (OneRAttributeEval), 5) RFAE: (ReliefFAttributeEval), and 6) SUAE: (SymmetricalUncertAttributeEval). The rank of each variable is computed w.r.t. to the target value (occupancy level) and represented in Fig. 11, which represents that variable light has highest and humidity has lowest rank value among the other. In order to on-step-ahead validation, the evaluated rank value for each case is represented in Table 2. The rank shown in Fig. 11 is based on the evaluated value of each variable by six different evaluators as listed in Table 2. As here are five variables, so the rank of variable is varied from 1 to 5 only. The number 5 is highest and 1 is the lowest value of the rank variable.

Logged variable’s correlation analysis for occupancy detection.
Based on the rank value, different BPNN and BPNNGSA models are designed and demonstrated in subsequence section.
The PAF for occupancy prediction is represented in Fig. 12, which includes the five main parts in development, including 1) collection of the logged database, 2) data pre-processing, 3) development of GSA algorithm, 4) design of BPNN algorithm and 5) model testing and adaptability. In the logged dataset, there are five variables which are recorded in a time series. During the logging process of the data, there may be a missing and/or spikes in the database due to some unwanted circumstances such as sudden change in load, weather condition, catastrophic failure condition etc. The data pre-processing approaches in PART-2 are used to manage such missing value and/or spikes removal. In this study, firstly, importance level of each logged variables are analyzed by using various machine learning approaches such as: 1) CRAE, 2) GRAE, 3) IGAE 4) ORAE, 5) RFAE, and 6) SUAE. Thereafter in part-3 and part-4, both BPNN [15–35] and GSA algorithm [36] are designed to implement one-by-one based on the rank of the logged variable. Here BPNN is implemented in two ways i.e., standard PBNN (without GSA optimization) and BPNN with GSA optimization, which is called BPNNGSA approach. Finally, developed both models (BPNN and BPNNGSA) are tested and cross check the possibility of adoptability based on the MSE (Mean squired error) value. Based on the lowest MSE value for all training and testing datasets, suitable model is adopted for further future application.
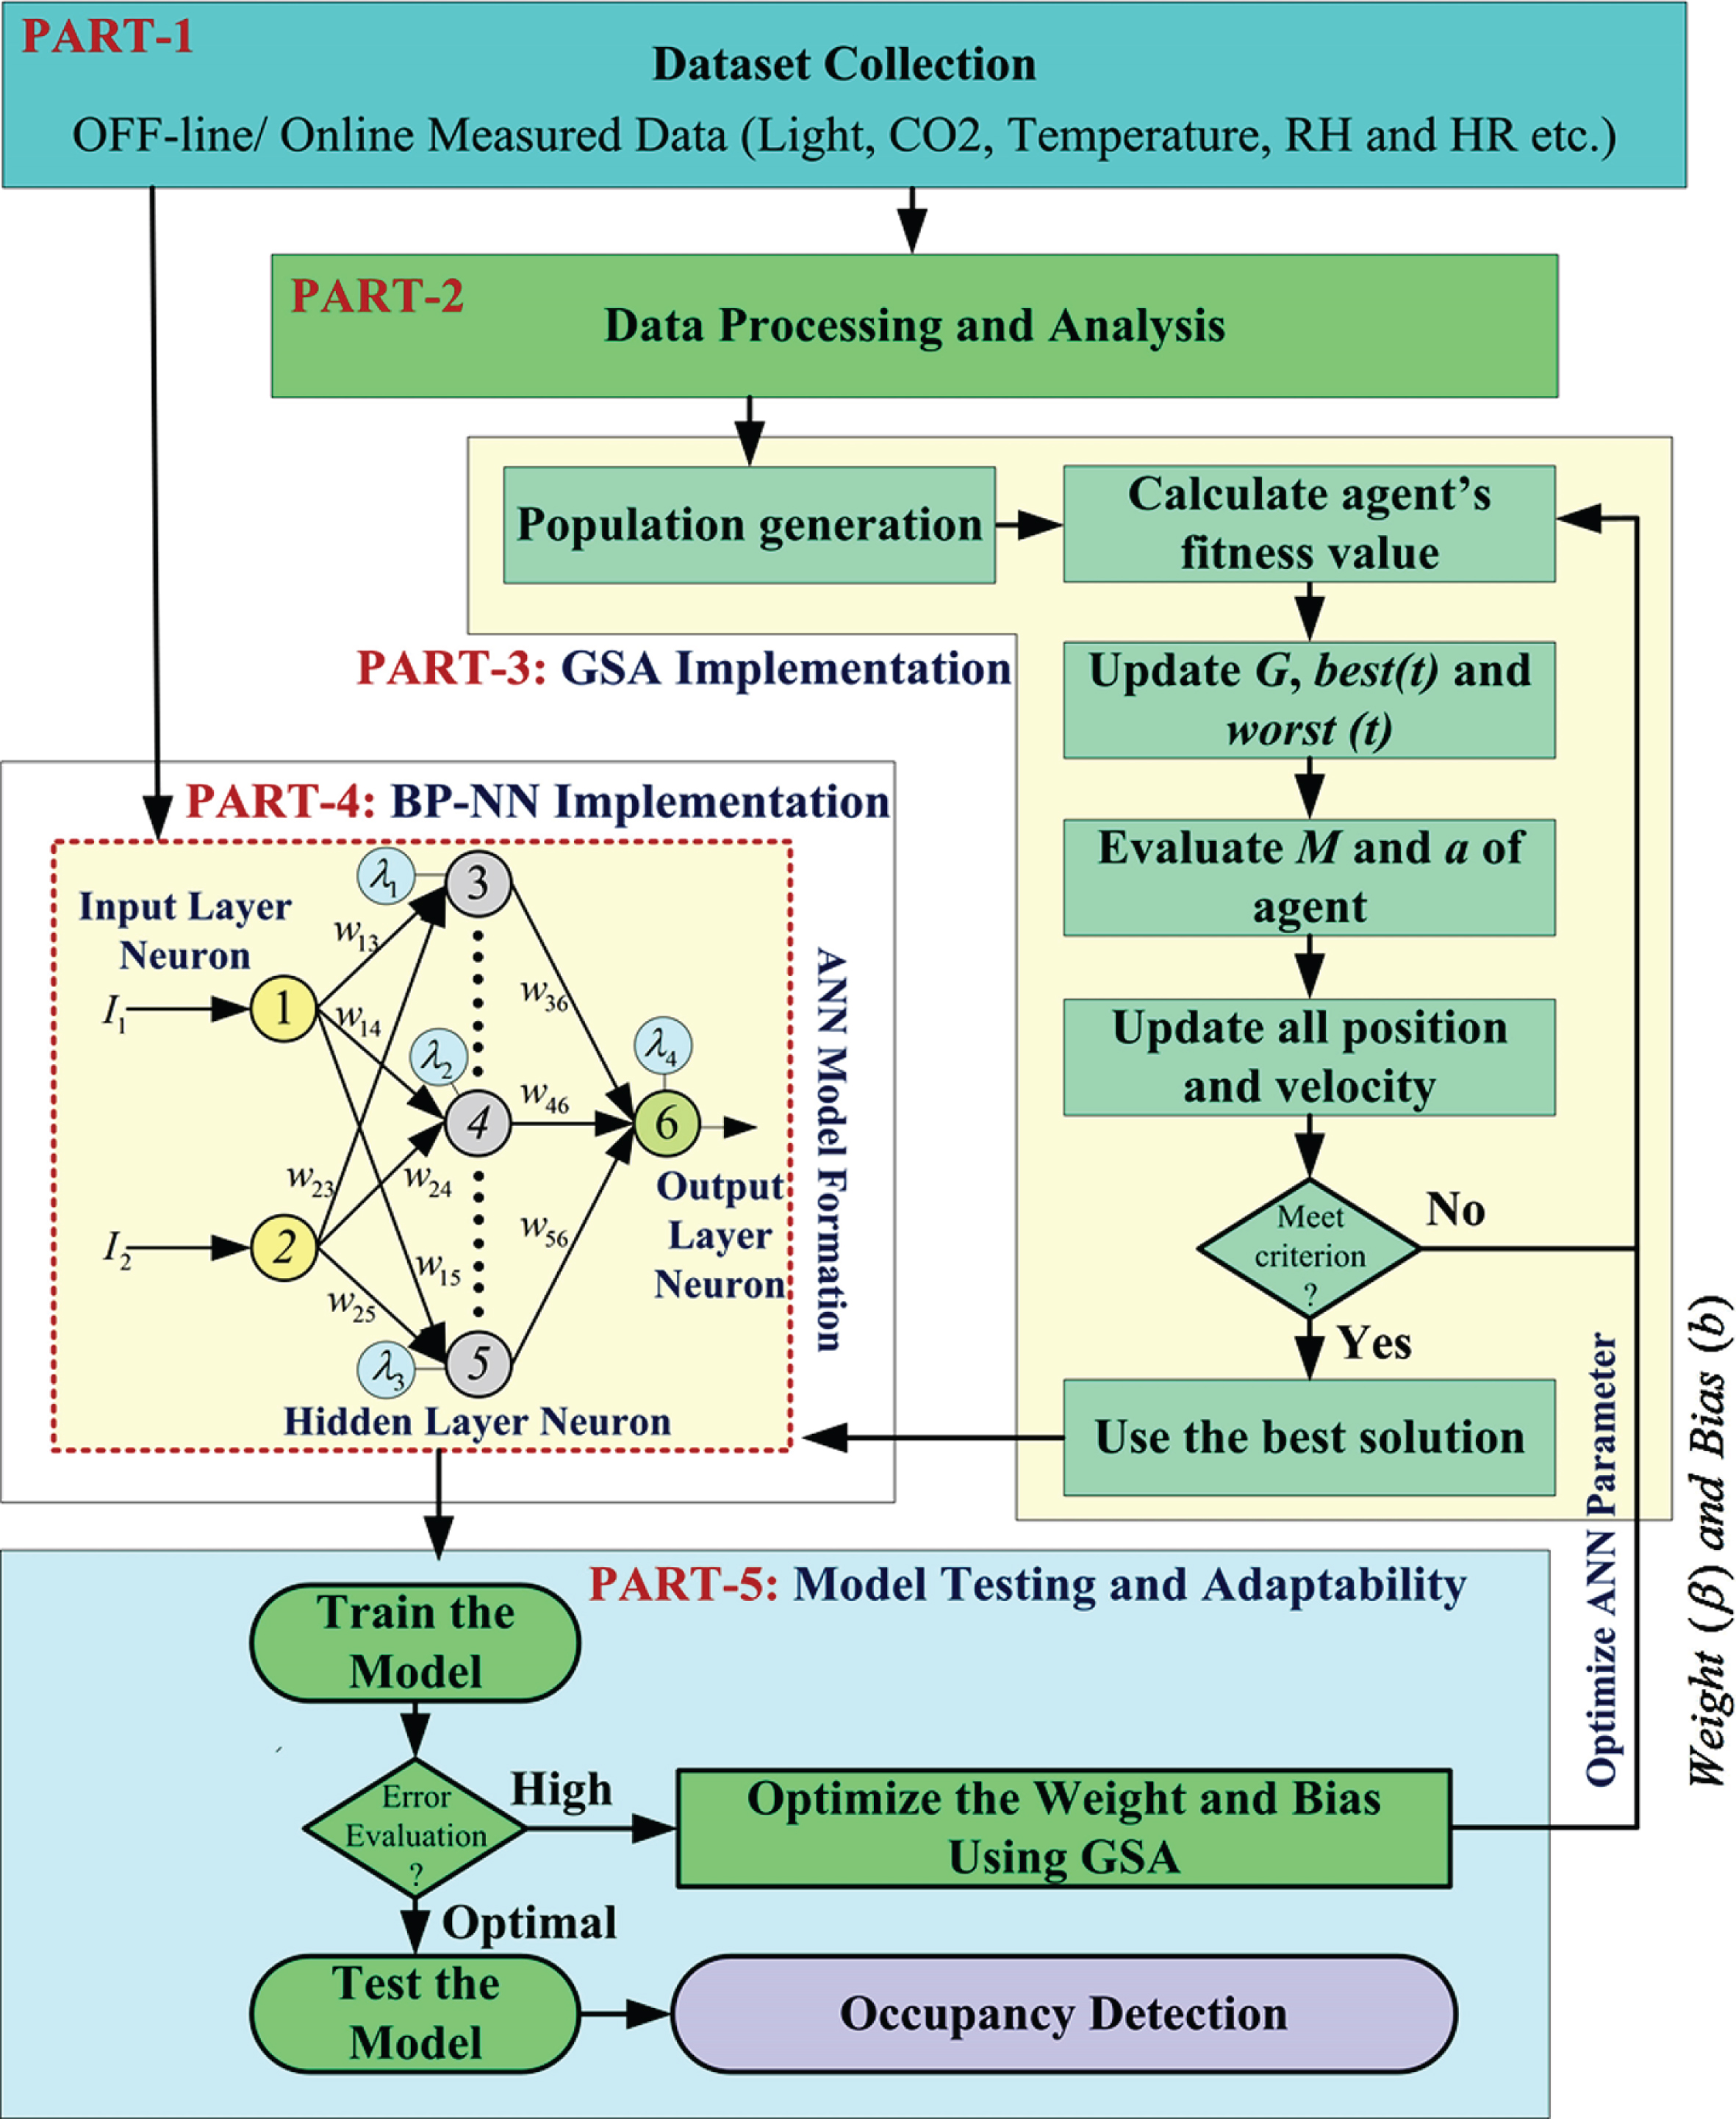
Proposed approach using BPNN and GSA based algorithms.
The GSA is developed in 2009, and a collection of agents, which works based on physical rules and newton theory. Here agent means solution, which has some mass value proportional to its fitness value. Similar to law of gravitational force, heavier mass has bigger force of attraction, and probably close to global minima w.r.t distance in between them (agents/candidates). The mathematical implementation of GSA is as follow [xx]:
Step#1: define the position of each agent
Where, N = dimension of problem,
Step#2: define the gravitational force (Gn) from agent
Where, M a = active mass of the agent, M p = passive mass, G(t) = gravitational constant, t = time, ɛ= constant, r = radius (i.e., distance between two agent.
Step#3: define the G(t)
Where, α= descending coefficient, G0= initial gravitational constant, iter = current iteration, maxiter = maximum number of iterations.
Step#4: define the r
Step#5: define the total force, act on an agent
Where, rand j = random interval number in [0,1]
Step#6: define the acceleration (a) of the agent
Where, M = mass of object i
Step#7: define the velocity of the agent
Step#8: define the position of the agent
Step#9: define the new mass (Mn) by fitness value and update accordingly
Where, f i (t)= ith agent fitness value in time t, wA (t)= week agent and bA (t)= strongest agent (best)
Step#10: define bA (t) and wA (t) for minimization problem
Step#11: define bA (t) and wA (t) for maximization problem
Step#12: define normalization of the new mass (Mn)
A note for reader is that the agent with heaviest mass is the most efficient agent, which has higher force of attraction (as per law of gravity, Equation 2) and slow in moment (as per law of motion, Equation 6).
Generally, Back-Propagation (BP) algorithm based neural network (BP-NN) implemented with 3-layer (input-hidden-output) architecture, which is mostly used for forecasting, prediction, regression, classification, identification, clustering etc [15–35]. The working performance of BP-NN is highly depends on the optimum value of weights (w), biases (b) and its learning parameters such as momentum (mu) and learning rate (neta). In this paper, the structure of BP-NN is fixed and GSA is implemented to find out the optimal/enhanced w, b, mu and neta value, which is called BPNNGSA model. For implementation of BPNNGSA, following two main components (i.e., fitness function and encoding strategy) are to be defined first.
Step#1: compute the output value of each hidden node:
Where,
Step#2: compute the output value of each output node:
Where, ω kj = weight value between hidden and output nodes, k = kth node of output node, λ k = bias value of each output node.
Step#3: compute the learning error (ɛ) for a fitness function:
Where, g = training samples,
Step#4: compute the fitness value of training sample:
In this study, occupancy detection of a building is performed by using two different category of approaches: 1) using BPNN and 2) using BPNNGSA. The nine different models for each category are developed initially and tested with different datasets. A summary of the performance of designed each model is represented in Table 3. The average range of the performance is varied from 1.0554 to 22.1158 for BPNN and from0.5080 to 5.9172 for BPNNGSA models, which shows that GSA enhance the performance of PBNN by optimizing the weight (w) and bias (b) of the standard PBNN. Based on the performance of the models as shown in Table 3, the model#9 is opted as an optimal model for occupancy detection and its detail analysis is represented in Table 4. Here, the value of alfa, G o is chosen 20 and 1 respectively as given in [36, 37] and work well in this problem as well. In Table 4, the Average, max, std dev, var, median and best of MSE for all training samples with variation of hidden layer neurons for model#9 are represented, where the performance results of both BPNN and BPNNGSA are compared with respect to the variation of hidden layer neurons as well, which varied from 10 to 50. The results shown in Table 4 are tabulated for 25 cases only for the demonstration point of view. The termination criterion for algorithm is to complete the 500 iteration (i.e., selected maximum number).
Demonstrated experimental analyzed results based on BPNN and BPNNGSA with different variables
Demonstrated experimental analyzed results based on BPNN and BPNNGSA with different variables
x = unused variables and √= used variable.
The Fig. 13 represents the convergence curves for both BPNN and BPNNGSA for all training samples with different case study at different hidden layer neurons. The Fig. 13(a) to Fig. 13(f) of the convergence curves are for BPNN and BPNNGSA at the hidden layer neurons of 10, 15, 20, 30, 40 and 50 respectively. These Figures demonstrate that BPNNGSA has the best and optimal convergence rate for all BPNN models. This means that BPNNGSA is more acceptable for solving the complex problems of BPNN and provide the fast convergence rate.
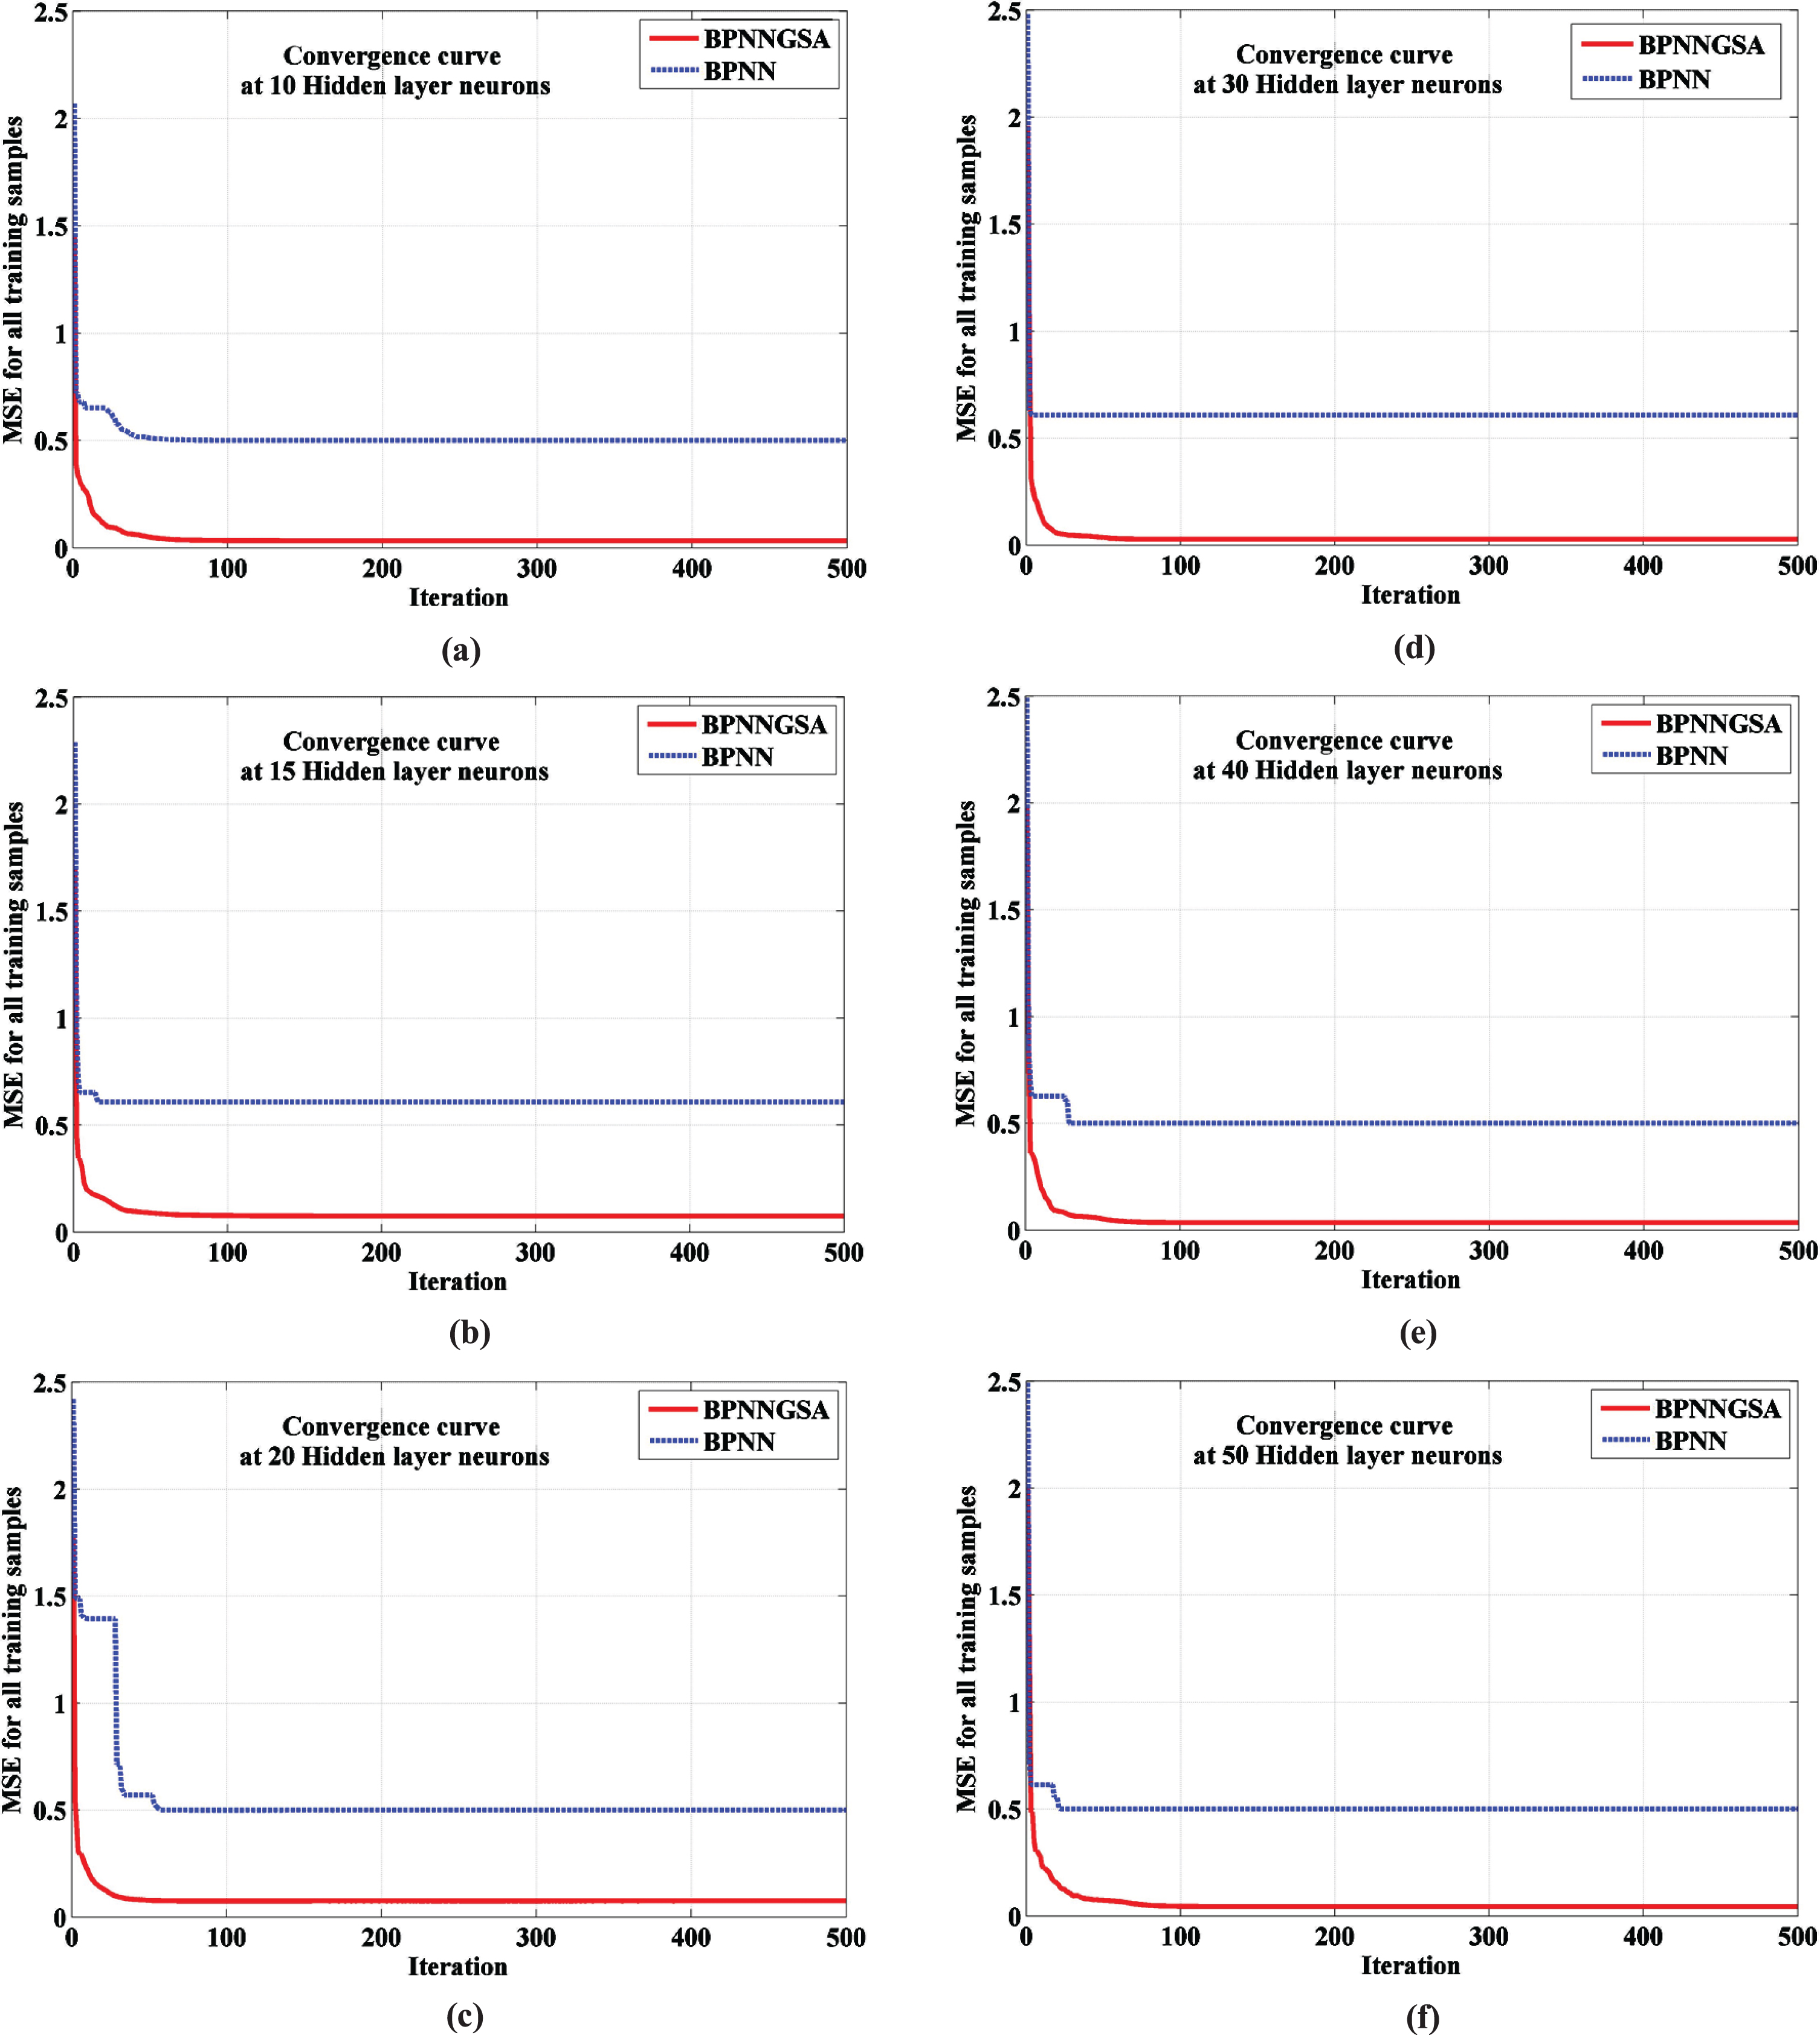
BPNN and BPNNSGA based covergence curves (a), (b), (c), (d) and (e) with hidden neurons are 10, 20, 30, 40, 50 respectively. (a) BPNN and BPNNSGA based covergence curves with hidden neurons 10. (b) BPNN and BPNNSGA based covergence curves with hidden neurons 15. (c) BPNN and BPNNSGA based covergence curves with hidden neurons 20. (d) BPNN and BPNNSGA based covergence curves with hidden neurons 30. (e) BPNN and BPNNSGA based covergence curves with hidden neurons 40. (f) BPNN and BPNNSGA based covergence curves with hidden neurons 50.
After analysis of Table 4, it is found that minimum and maximum value of STD, Var, median are 0.074–0.222, 0.005–0.049 and 0.5–0.6217 for BPNN models. Whereas the minimum and maximum value of STD, Var, median are 0.075–0.111, 0.006–0.012 and 0.0221–0.1151 for BPNNSGA models. The best performance for BPNN and BPNNGSA models is varied from 05 to 0.6217 and 0.0221 to 0.1151 respectively. Although this variation no too much in value and are very closer to each other. And the best performance is achieved at different hidden layer neuron at such as at 18, 20, 25, 40 and 45 for BPNN and at 13, 19, 23, 26–29 for BPNNGSA model. Based on these statistical characteristics, it is concluded that proposed approach has high performance ability.
Average, max, std dev, var, median and best of MSE for all training samples with variation of hidden layer neurons for model#9
In this paper, a novel heuristic optimization algorithm application for the enhancement of the BPNN training is presented. A benchmark problem of OLB prediction is demonstrated to compute the enhancement efficiency of the used GSA algorithm. Demonstrated results of BPNN are compared with and without GSA. For all category of the analysis, GSA based BPNN (i.e., BPNNGSA) represents the better performance in the order of optimization value of weight, bias, increase the convergence speed, and trap-out the local minima. After the comparative study, it is found that BPNNGSA shows the outperformance in comparison of standard BPNN. The experimental demonstration is performed to validate the proposed approach performance. The following novelties are achieved in this study: 1) enhancement the convergence rate/speed, 2) reduce the error, 3) optimize the BPNN parameters (weight and bias), 4) prevent from trapping in local minima.
For the future work, the proposed approach of BPNNGSA can be used for occupancy detection and prediction for the future planning in energy management. Moreover, presented work will be enhanced by applying another hybrid heuristic algorithm of combining GSA with PSO then used for BPNN development further.
Footnotes
Acknowledgments
“The authors extend their appreciation to the Intelligent Prognostic Private Limited, India for providing necessary facilities to this research work”