
Abstract
The advent of distributed energy resources is undoubtedly transforming the nature of the electric power system. The crisis of conventional energy sources and their environmental effects resulted in the integration of Distributed Generators (DGs) into the distribution system. Simultaneous application of optimum network reconfiguration, DGs, and Distribution Static Compensator (DSTATCOM) unit’s placement in the Radial Distribution Systems (RDS) comes with a raft of technical, economic, and environmental benefits. Benefits include improved power quality, reliability, stability, mitigation of power losses, and voltage profile improvement. In this paper, the combinational process of optimal deployment of DGs and DSTATCOM units in RDS with suitable network reconfiguration to achieve positive benefits has been analyzed. A recent metaphor-less based Artificial Intelligence (AI) technique named the Rao-1 method is employed to overcome this combinational nonlinear optimization problem. The objective functions are to mitigate the power losses, enhance the voltage profile, and voltage stability index of the RDS considering the net economic cost-benefit to the distribution utility. The simulation study of this pragmatic approach problem is carried out on IEEE 33-bus RDS. The comparison of the results obtained by the Rao-1 method with other existing meta-heuristic optimization methods has been made to show its efficacy.
Keywords
Introduction
In the power system, the distribution system is an intermediate part of the power transfer between the sub-transmission and end-users. The distribution network is simple and radial. The distribution networks’ R/X ratio is high, which causes high power loss and low voltage profile in the distribution feeders. The Indian government flagship scheme Ujwal Discom Assurance Yojana (UDAY) had set a goal to mitigate Aggregate Technical & Commercial (AT&C) losses by 15% at end of the last fiscal year. Enhancement of quality service to utility consumers has been a challenging concern for power companies due to increasing economic growth, load demand, and computerized applications. Feeder reconfiguration, optimal allocation of DG, and DSTATCOM units in RDS are the alternative methods to meet the challenging issues of power companies. Optimal deployment of DG and DSTATCOM units in RDS have techno-economic benefits to the system subjected to constraints.
Reconfiguring the RDS can improve the network performance without violating the operating constraints. Reconfiguration is a process of rerouting supply to the network by altering the network topology structure to reduce power loss. It is accomplished by adding new feeder segments interlinking the network buses, and opening the existing feeder segment to maintain the network radial. Distribution Network Reconfiguration (DNR) is considered as combinatorial, non-differentiable, constrained optimization problem. In general, the normally open and normally closed switches are performed in three situations as follows. Abnormal: In contingency situations such as fault occurrence, fault isolation and service restoration. Dispatching: Reduction in electrical power losses is to enhance the operational efficiency of the RDS. Maintenance: In case of permanent fault on the feeder, the system component must place out-of-service and for the possibility of system expansion.
Several researchers have done work on the DNR problem with and without considering reserve capacity to mitigate the power losses or improve the system performance. Researcher’s viz. Merlin and Back had first accounted for the method for power loss reduction with DNR. Power loss reduction has remained the most significant objective function ever since. Alberto Borghetti [1] presented the RDS optimal reconfiguration to minimize power losses by a mixed-integer linear programming approach. A brief literature review on methods of DNR imposing radiality constraints was discussed in [2]. The various multi-objective functions used in DNR are discussed briefly in [3]. Many algorithms, such as the Ant Colony Optimization algorithm [4], Symbiotic Organism Search Algorithm [5], Bat Algorithm [6], etc. had been applied to solve the DNR optimization problem. A fuzzy-based multi-objective approach of reconfiguration of the distribution system in the presence of DG was presented in [7]. The Harmony search Algorithm (HSA) was utilized to solve DNR problem considering DG units to reduce power loss and improve voltage profile in RDS [8]. Falaghi, et al., [9] applied an approach using an ant colony optimization technique for optimal placing the sectionalizing switches with the presence of DG units in RDS. A comparative study of various artificial intelligence optimization methods is presented in [10]. Optimal DNR with simultaneous placement of DGs and capacitors using a hybrid combination of a meta-heuristic algorithm of HSA and Particle Artificial Bee Colony algorithm (HS-PABC) was presented in [11]. In [12], authors had utilized a modified krill herd (KH) algorithm for the optimal sitting of DG units in RDS considering reconfiguration. Shuaibu hassan, et al. addressed the positive benefits of DG installation in the distribution system regarding technical, economic, and environmental aspects. Furthermore, a summary of various meta-heuristic optimization algorithms is given in the study [13]. In [14], a binary genetic algorithm was utilized to the simultaneous placement of DGs and capacitors in smart automated RDS, considering DNR for power loss reduction.
Optimal placement of DG and DSTATCOM units’ capacity, which has a continuous nature. Whereas network reconfiguration which has a discrete nature. Consequently, this is a nonlinear complex multi-objective optimization problem. Various optimization techniques had been proposed or utilized by many researchers’ in resolving the DG, DSTATCOM, or shunt capacitor placement problem individually in RDS. This research paper main contribution is to address the techno-economic issues of distribution system planning with the optimal deployment of DGs, DSTATCOMs, and reconfiguration. The technical objective functions are to reduce power losses, enhance voltage stability, and improve the system’s voltage profile. Besides, the net economic cost-benefit to the distribution utility has been taken into consideration. The literature study was motivated to introduce a recent, simple, and efficient metaphor-less based AI technique named the Rao-1 algorithm to solve this combinational non-linear optimization problem. In this study, six different scenarios of DG, DSTATCOM placement, and reconfiguration of the network are considered as power loss reduction methods. These scenarios are simulated using the Rao-1 algorithm to establish the superiority of the algorithm. Simultaneously, the net economic cost-benefit to the distribution utility has been taken into consideration. The performance analysis is carried on the IEEE 33-bus test system. The results are compared with the results shown in similar other existing papers. The rest of the article is organized as follows: Section 2 discusses the technical objective functions considered. The mathematical formulation of the economic factors due to tie switches, DG, and DSTATCOM placement are discussed in Section 3. A metaphor-less optimization algorithm is described in Section 4. Section 5 explains the application of the Rao-1 algorithm to solve the optimization problem. Numerical results and discussion come under Section 6. The last section summarizes the conclusions.
Technical factors of the objective function
The reduction of power losses, improvement of the voltage profile, and voltage stability of the distribution networks are accomplished by the simultaneous application of optimal network reconfiguration, DG and DSTATCOM allocation in RDS. Figure 1 shown the two bus representation of the RDS. In this section, the mathematical expressions for the objective functions and the limitations are presented.
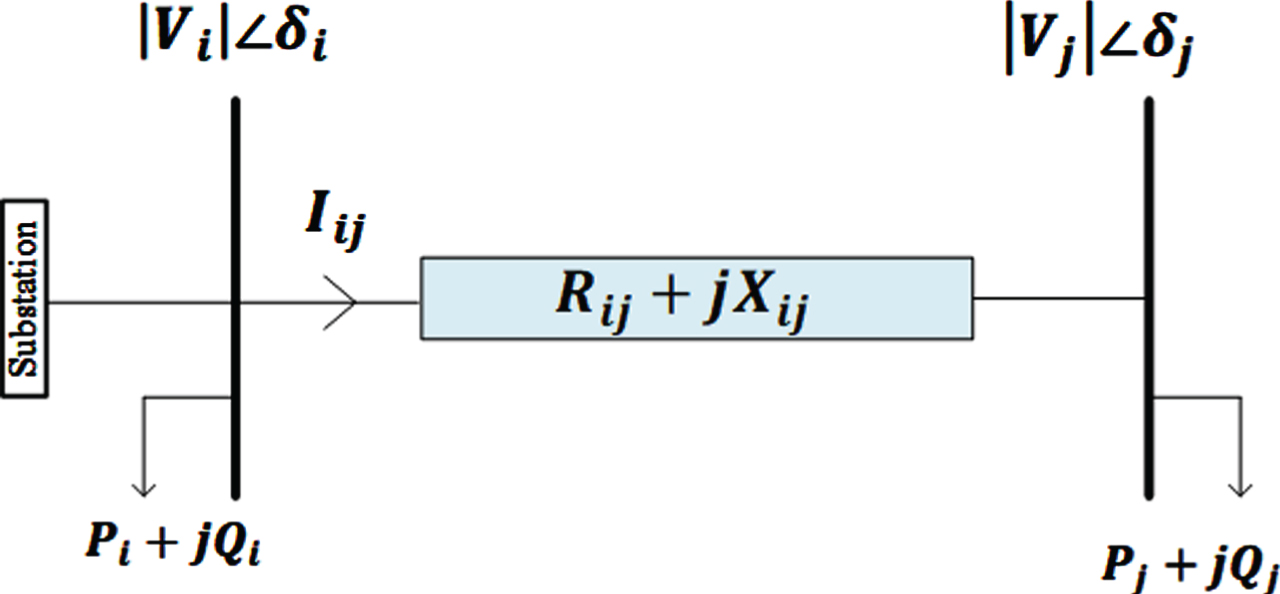
Two bus representation of RDS.
where,
I ij Branch current of each line connecting i th and j th bus.
P i & Q i Active and reactive power load at sending end bus (i th ) respectively.
P j & Q j Active and reactive power load at receiving end bus (j th ) bus respectively.
V i & V j Voltage at i th and j th buses respectively.
δ i & δ j Power angle at sending end bus (i th ) and receiving end bus (j th ) respectively.
R ij & X ij Resistance and reactance of the line connecting i th and j th buses respectively.
In power systems, mitigation of real and reactive power losses has been the primary objective for achieving the system better performance.
Total system real power loss (P loss )
It is the primary objective function chosen for the proficient operation of RDS. P loss is expressed as given below.
The second objective function considered is the minimization of Q loss . It is given below.
To enhance RDS power quality, the magnitude of the voltage at buses should be within limits. It is defined by the voltage profile index as given below [15].
VSI is a vital tool to predict how close the network is to the voltage stability point. Hence, to identify the weak bus, a stability index (SI) was proposed [16], as given below.
The bus (or node) at which the SI value is minimum is considered the most sensitive bus system. The total voltage stability index (TVSI) of the system is given below.
The system stability is improved by maximizing the SI(j) in the buses. Thus, the higher value of SI(j) leads to a minimum value of the objective function F4 expressed mathematically, as given below.
LLI will indicate the increase or decrease of the line flows in the RDS due to the integration of compensation devices in the network. It is also evaluated mathematically, as given below [17]:
where S j is the j th line power flow, the higher the LLI value, the more the network up-gradation is needed. The value of LLI less than unity indicates an acceptable improvement in the line flow.
The performance of the RDS with DGs and DSTATCOMs includes the above technical indices. In this paper, the goal is to optimize a set of objective functions subjected to constraints. These objective functions are combined into one scalar composite objective function using a weighted sum method. For the weighted sum objective function, the weighting factors play a significant role. Table 1 shows the relevant weighting factor assigned to each index based on its importance. The MOOI is evaluated, as given below.
Weighting factors for technical indices
Weighting factors for technical indices
For the proficient operation of RDS, the MOOI is minimized with equality and inequality constraints. The objective functions
Here
The equality constraints of the optimization problem are as follows.
where,
P g & Q g Real and reactive power is generated at the substation respectively.
P l & Q l Real and reactive power load at the bus respectively.
P loss & Q loss Active and reactive power losses in the branch respectively.
Similarly, given below are the inequality constraints: Voltage limits: The adopted voltage variation limit of each bus is ±5% of the rated voltage of the distribution system (i.e., 1 p.u).
DG limits: The penetration level of DG into the RDS should be within limits.
DSTATCOM limits: The penetration level of DSTATCOM into the RDS should be within the limits. Radial topology limit: In RDS reconfiguration process, loops are formed whenever tie switches are closed in the network. In each loop, only one of the sectionalizing switch should be opened. For a radiality network, the following criteria should be met.
Thus, the network technical benefits are achieved by minimizing the MOOI, and it is considered the optimization problem in this paper. Minimum MOOI is achieved by optimal deployment of DG and DSTATCOM devices in RDS along with network reconfiguration. Consequently, this results in minimizing real & reactive power losses and the grid power consumption. Reducing power losses will lead to revenue benefit to the utility companies by reducing the amount of unbilled energy.
The mathematical terms for the economic evaluation of DG units and DSTATCOM units’ placement in RDS, including line switching costs for DNR are discussed in this section [18].
Evaluation of total DG units cost (DG cost )
It include the combined cost of DG investment cost (
where,
CO&M,dg Maintenance and operation costs of DG ($/MWh).
P DG i Real power (MW) generated by DG at i th bus.
Cinv,dg Investment cost of DG ($/MW).
DG i Rated DG capacity (MW) at i th bus.
N dg Number of DGs to be placed in the network.
T Time duration in hours for one year=8760 hours.
N yrs Planning period in years.
IntR Interest rate.
InfR Inflation rate.
The net cost of DG units (DG
COST
) is mathematically represented as follows.
The investment cost (
where,
Cinv,ds Investment cost of DSTATCOM ($/MVAr).
CO&M,ds Maintenance and operation cost of DSTATCOM (5% of Cinv,ds).
Q DS i Reactive power (MVAr) generated by DSTATCOM at i th bus.
DSi,rated Rated DSTATCOM capacity (MVAr) at i th bus.
N ds Number of DSTATCOMs to be placed in the network.
The total costs of DSTATCOM (DSTATCOM
COST
) include
The switching cost comprises capital investment (which include installation cost), and annual operation and maintenance costs. It is mathematically evaluated as given below.
where,
N s Number of switches to be placed in the network.
The total cost due to placement of DG, DSTATCOM, and sectionalizing switches (CostDG,DS,Switch) in RDS is given as below.
The optimal network reconfiguration is achieved with the best placement of sectionalizing switches in the RDS.
The benefit of optimal deployment of sectionalizing switches, DG and DSTATCOM devices in RDS results in minimizing real & reactive power losses and the grid power consumption. The net cost saving due to the diminution of electrical power losses is evaluated as follows.
Here Δ P
loss
represents the reduction in power loss due to changes in the system.
The cost of saving in the active power loss reduction (C ΔP loss ) from the utility is calculated as below:
The previous section discussed the optimization problem to minimize the MOOI. It leads to a reduction in power losses and power consumption from the grid (due to power injection by DG). Accordingly, the net saving cost due to the decrease in power consumption from the grid is mathematically evaluated using Equation (30).
Simultaneous placement and sizing of DG and DSTATCOM units in RDS along with network reconfiguration is a nonlinear complex multi-objective optimization problem. This optimization problem can be solved using a simple metaphor-less optimization method named Rao-1, recently proposed by R.V. Rao [19]. This optimization method is grounded on the best and worst solutions obtained and the candidate solutions’ interactions. The Rao-1 algorithm will not depend on any algorithm-specific control parameters as in GA (like selection, crossover, and mutation) and PSO (C1, C2, ω). This section discusses a brief description of the Rao-1 algorithm for solving the objective function optimization problem.
Let f (x) is the objective function to be optimized. Assume that there are ‘p’ number of design variables (i.e. variables, j=1,2,..,p), ‘n’ number of candidate solution (i.e. population size, k=1,2,..,n) at any iteration ‘i’. During the i th iteration, the j th variable value for the k th candidate is represented as Xj,k,i, and the modified value is evaluated by the equation given below.
This section discusses applying the Rao-1 algorithm for optimal deployment of DG and DSTATCOM units along with network reconfiguration. The placement of DG and DSTATCOM units capacity, which has a continuous nature. Reconfiguration of the distribution network which has a discrete nature. These two issues are non-linear combinatorial optimization problems. The conspiracy of the optimization problem increases due to the above issues. Various researchers had applied different meta-heuristic algorithms for solving these problems individually. In this study, the Rao-1 algorithm has been implemented to defeat these combinatorial nonlinear optimization problem conspiracy.
Encoding the solutions for the optimal location and sizing of DG and DSTATCOM in RDS is a crucial aspect. In this study, each possible solution is represented by a vector (row matrix). Each element indicates the result obtained by the bus where a DG and DSTATCOM are placed. The vector dimension represents the number of DG and DSTATCOM units that are to be placed. Here the design variables are indicated by the number of DG and DSTATCOM units. Each row of the matrix P i is a potential solution and is given below.
P i = [loc . i,1, . . , loc . i,ND, sizei,1, . . , sizei,ND]
and
P = [P1, P2, . . . , P i , . . . , Pmax. population size]
where ‘i’ and ‘ND’ represent the i th candidate solution in the population and dimension of variables respectively. P i represents the i th vector which includes the location and size (capacity) of installed DG and DSTATCOM units.
For the network to optimally reconfigure, the switches are chosen as the decision variables. These switches are assigned either 0 (status for an open switch) or 1 (status for a close switch) to make the system planning simple and easy. The more the number of switches chosen, the more number of unfeasible solutions will exist. Therefore, more sophisticated methods are required in determining decision variables. In RDS, the number of independent loops is equal to the number of tie switches. DNR optimization problem is to identify the appropriate switches in each loop to be opened for power loss to minimized. It reduces the dimension of the variables and the unfeasible solutions in the iterative procedure. For DNR heuristic rules are applied to reduce the number of tie switch operations and to maintain the radial structure without violating the constraints. In this paper, the network radiality is based on the bus incidence matrix [20].
The optimal radial network topology can be presented as shown below.
NW i = [DG i , DSTATCOM i , Tie - switches i ]
where NW i is the i th vector or candidate solution. DG i and DSTATCOM i are row matrices with two columns respectively. Tie - switch i is a row matrix with the number tie-switches as columns. The new tie-switches, DG, and DSTATCOM location and size are updated based on the algorithm procedure. The above row matrices are given below.
DG i = [DGi,bus_location, DGi,size]
DSTATCOM i = [DSi,bus_location, DSi,size]
Tie - switches i = [Si,loop1, Si,loop2, . . . , Si,loopN]
The steps involved for Rao-1 algorithm in solving the multi-objective optimization problem for optimal deployment of DG and DSTATCOM in the system and the network reconfiguration is as follows.
Step 1: Initially, read the system line data, bus data, open and closed switches, and optimization parameters.
Step 2: Run the base load flow (network without any changes) using a back-ward-forward sweep method.
Step 3: Initially generate a vector ‘NW’ by providing the tie-switches, DGs, and DSTATCOMs bus positions and sizes in the system randomly without violating the constraints. Run the load flow program.
Step 4: Evaluate the fitness function of the optimization problem for the number of vectors generated.
Step 5: Identify the best and worst candidate solutions in the population and save it.
Step 6: Modify the candidate solution based on solutions obtained from step 6 using Equation (31).
Step 7: For each candidate solution, compare its fitness value with the previous iteration fitness value. If the updated value is better than the previous value, set this value as the best candidate solution. Else, keep the previous value itself.
Step 8: Check for the stopping criteria (i.e., maximum iteration limit or tolerance limit). If satisfied, go to the next step to terminate the search. Else go to step 4.
Step 9: Print the optimal best solution obtained, i.e., the optimal locations and sizes of DGs and DSTATCOM units and tie-switches in the RDS.
Step 10: Display the optimization problem best fitness value representing minimum MOOI and the corresponding net cost-saving value.
Numerical results and discussion
The optimization problem pragmatic approach in this article is implemented on IEEE 33-bus RDS using a metaphor-less-based AI technique named the Rao-1 method. Backward Forward Sweep (BFS) load flow technique is used for the load flow study. This study aims to minimize the MOOI function for better performance of the system, and it is assessed using MATLAB software. The corresponding saving cost is also analyzed. Table 2 shows the specifications of the economic parameters value assumed. In this paper, the maximum penetration level of the DG and DSTATCOM is taken as 80% of the total real and reactive power load of the system respectively. In this section, the study is demonstrated in six scenarios. They are as given below.
Section I: RDS without any changes (Base case).
Section II: RDS with optimal DG energy sources integration.
Section III: System with optimal DSTATCOM devices connected.
Section IV: System with simultaneous placement of optimal DG and DSTATCOM units.
Section V: Optimal reconfiguration of the RDS.
Section VI: System with a combination process of network reconfiguration, DGs, and DSTATCOM units’ placement.
Cost specifications
Cost specifications
IEEE 33-bus RDS is considered as the test system for the study purpose in this paper. It has a total active power load of 3715 KW, a reactive power load of 2300 KVAr with 33 nodes, 37 branches, 32 sectionalizing switches, and five tie-switches. Figure 2 illustrates the structure of the IEEE 33-bus RDS initial configuration. The base MVA of this system is 100 MVA, and the base KV is 11 KV. The bus data and line data are taken from ref. [20]. Bus 1 is considered a slack bus.
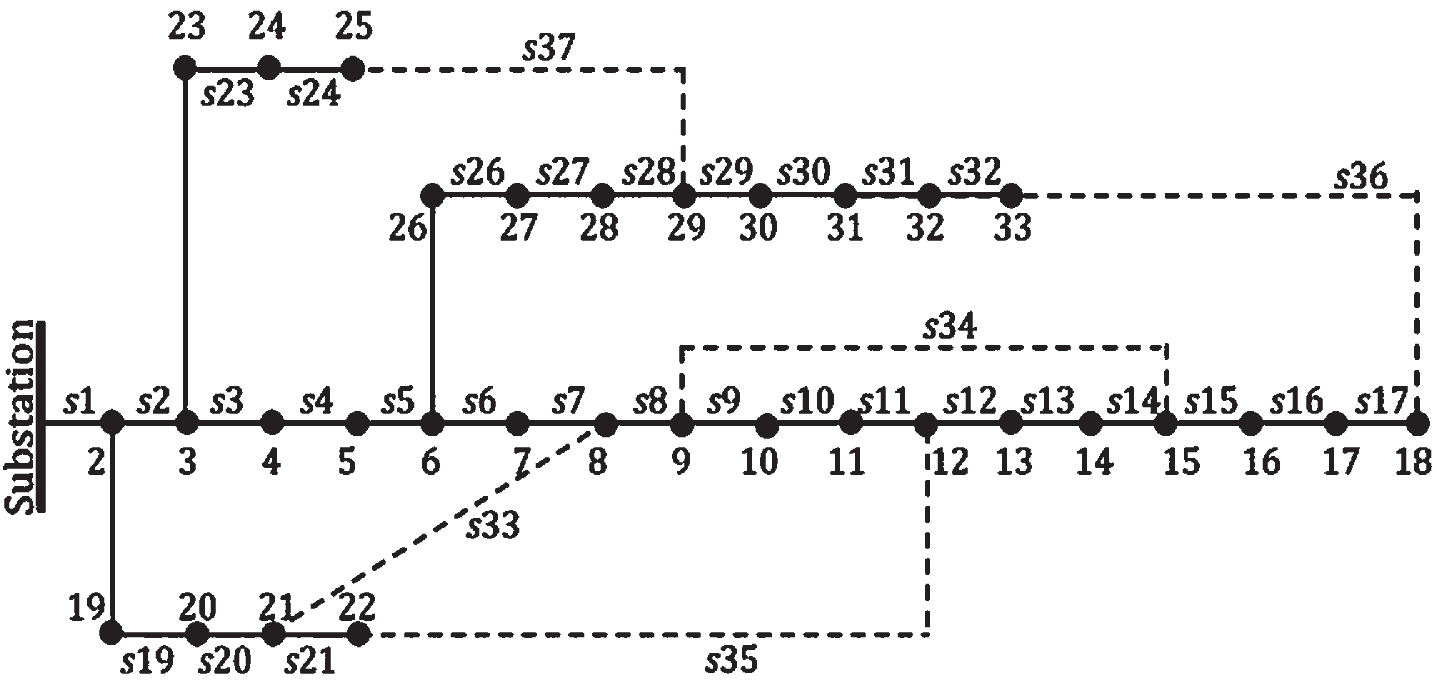
Structure of IEEE 33-bus RDS initial configuration.
In this case study, it is observed from Table 3 that there is 65.28%, 33.33%, and 93% reduction in real power loss for scenarios II, III, and IV respectively, in the test system. Similarly, the percentage reduction in reactive power loss is 64.5%, 26.63%, and 91.9% for scenarios II, III, and IV respectively. The pictorial representation of power losses and voltage profile is shown in Figs. 3 and 4 respectively. The better results are obtained for scenarios IV and VI considering techno-economic benefits to the system.
Simulation results of the 33-bus test system

Electrical power losses with the optimal deployment of three DG and DSTATCOM units with DNR.

Voltage profile of IEEE 33-bus RDS for different scenarios.
Reconfiguration of 33-bus RDS using the Rao-1 optimization technique has reduced the real and reactive power losses to 53.9 % and 25.13 % respectively, as shown in scenario V of Table 3. Simultaneously reconfiguration of RDS after applying scenario IV, i.e., case of 3 DG plus 3 DSTATCOM units, resulting in a solution nearly equal to the same resolution as obtained in scenario IV case study. The economic cost saving plot for various scenarios is shown in Fig. 5. Therefore, better performance can be obtained for scenarios IV & VI to the system subjected to constraints. DNR is more applicable in case of fault contingencies in the system rather than utilizing for loss reduction. The simulation results obtained by using Rao-1 metaphor-less optimization technique are compared with other intelligence optimization methods, as shown in Table 4. This study has demonstrated the efficacy of the Rao-1 method over other optimization methods for similar existing work.
Comparative analysis of the 33-bus test system results
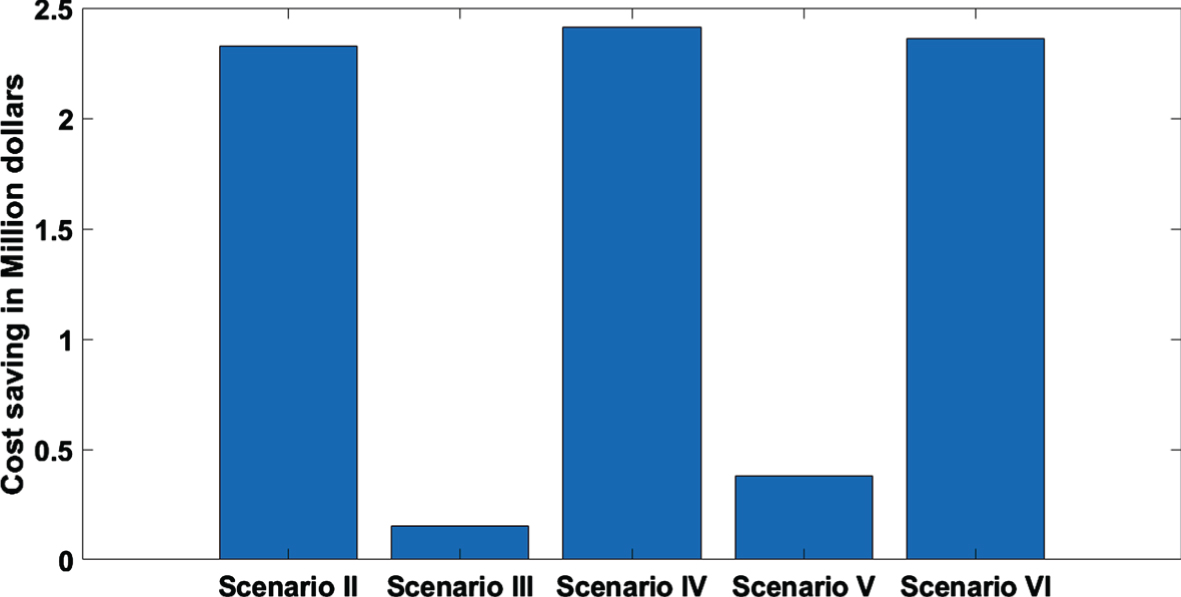
Economical cost-saving plot for various scenarios.
This article addresses the problems of mitigation of the electrical power losses and enhancing the voltage profile and voltage stability with DG and DSTATCOM units’ deployment with the RDS reconfiguration. The optimization problem is solved using a recent metaphor-less based AI technique named Rao-1 algorithm. Six different scenarios of optimizing the objective function were considered on the IEEE 33-bus test system. In this study, the number of DGs and DSTATCOMs assessed is limited to three. Simulation results show that for scenario IV (i.e., with 3 DG plus 3 DSTATCOM case), the real and reactive power losses are reduced by 93 % and 91.9 % respectively.
Similarly, for scenario VI (i.e. with 3 DG + 3 DSTATCOM + DNR case) the real and reactive power losses are reduced by 93.34% and 92.02% respectively. The corresponding economical cost-saving is 2.4109 Million $ and 2.3586 Million $ for scenario IV and VI respectively. The results obtained are compared with those obtained with other optimization methods such as loss sensitivity factor (LSF), Improved analytical (IA), Analytical method, Bacterial Foraging Optimization Algorithm (BFOA), Gravitational Search Algorithm (GSA), Firefly Algorithm (FA), Grey Wolf Optimization (GWO), Cuckoo Search Algorithm (CSA), and Fuzzy-BFO. This paper will help the power system engineers choose the best scenario to improve RDS’s performance considering techno-economic benefits. It is recommended for future research work to incorporate different types of future DG sources in the distribution system. Estimate the potential benefits of DGs integration into the existing and planned distribution utility.