
Abstract
In real-world situation, speech signals reaching our ears are usually degraded by the background noise. These distortions are detrimental to the speech quality and intelligibility and also cause a serious problem to many speech-related applications, such as automatic speech recognition and speaker identification. In order to deal with the background noise distortions, we propose a strategy to enhance the degraded speech in this paper, where speech enhancement is conducted using supervised deep neural network models. The models are trained to learn a mapping from the features of noisy speech to estimate the ideal-ratio mask (IRM). The estimated IRM is then applied to the noisy speech in order to obtain an enhanced version of the degraded speech. The mean square error (MSE) is used as an objective cost function. Additionally, Global Variance Equalization is performed as a post-processing step to equalize variances of the features. Systematic evaluations and comparisons show that the proposed supervised method improves objective metrics of speech quality and intelligibility substantially and significantly outperforms the competing and baseline speech enhancement methods. Finally, the proposed method is examined in speaker identification task in noisy situations. The proposed method leads to the highest speaker identification rates when compare to the competing and baseline speech enhancement methods.
Keywords
Motivation
There are many forms of human communication, for example nonverbal and text based. Speech is, however, the most effective and efficient form for humans. Through speech, we are able to convey instructions, emotions etc. The usefulness of the speech has led to a variety of speech processing applications. Successful use of these applications is, however, considerably aggravated in presence of background noise. The noise signals overlap and mask the useful speech signals. To deal with the overlapping background noise, a speech enhancement strategy is essential in order to make noisy speech more understandable and pleasant. Speech enhancement formulates noisy speech signals to enhanced speech signals with better perceptual quality and intelligibility. The motivation behind this research work is to deal effectively with background noise and produce high quality and intelligible enhanced speech.
Introduction
Speech enhancement–which in fundamental nature suppresses background noise and thereby improves the quality and intelligibility of the noisy speech–has various applications, such as, automatic speech recognition (ASR), speaker identification (SI), hearing aid, etc. Generally, single channel speech enhancement (SCSE) methods are categorized into two wide classes: unsupervised and supervised SCSE methods. In unsupervised SCSE methods, statistical models are considered to estimate the clean speech from noisy speech signals without prior knowledge of the noise type and speaker identity. Therefore, in this class, no supervision and classification of the signals as speech or noise type is necessary. Unsupervised methods are robust in conditions when noise sources are stationary; however, the noise suppressing potential in nonstationary conditions is not high. On the other hand, for the supervised SCSE methods, models are considered for both the speech and noise signals. The parameters of the models are learned via training of signal samples (speech and noise) and an interfacing model is defined by combining the individual models for the speech and noise and speech enhancement is performed. Unsupervised SCSE methods such as, spectral subtraction (SS) [1], Wiener filter (WF) [2], log-minimum mean squared error (LMMSE) estimation [3] and others [4–10] are usually not very efficient in low SNR and nonstationary noisy situations [11]. Model-based methods showed promising outcomes in the adverse conditions. For example, methods in [12, 13] proposed probabilistic interfacing models between sources which are based on the prior learning and demonstrated considerable gains in the performance. A vital line of work is the nonnegative matrix factorization (NMF), which is a model based method for noise suppression [11, 14]. Noisy speech is modeled as the sum of nonnegative source bases. However, generalizations to unknown noise sources in these methods is fundamental problem and are usually successful for structured interfering sources, e.g. competing speakers [15].
Related literature
SCSE can also be addressed as a supervised learning problem [16]. The prelude methods commonly use Multilayer Perceptron (MLP) in time-domain or frequency-domain to map a mixed segment to a speech segment [17–19]. The cited methods utilize shallow neural networks (SNNs) and small sets of the training data. Consequently, these methods are not fully efficient to demonstrate all capabilities and potentials of the supervised speech enhancement. In past decade, a prolific research in Computational Auditory Scene Analysis (CASA) has revitalized for the best utilization in the field of supervised speech enhancement methods. In [20] a classifier is trained to estimate the Ideal binary mask (IBM) for binaural speech separation. In this method, a maximum a posteriori classifier is trained with two binaural features, i.e. inter-aural time differences and inter-aural intensity differences, to further classify time-frequency (T-F) units as speech-dominant or noise-dominant, respectively. This method produced large gains in speech intelligibility during matched training and test conditions. Seltzer et al. [21] applied a Bayesian classifier to estimate and eliminate noise-dominant T-F units for the robust automatic speech recognition (ASR). For CASA based speech separation, authors in [22] trained sub-band MLPs to classify T-F units as speech or noise dominant. In mel-spectral domain, authors in [20], [23] implemented the Gaussian mixture model (GMM) for IBM estimation. For human beings with normal listening capabilities, and with low SNRs and comparable training and test noise segments, this method has demonstrated considerable improvements in the speech intelligibility.
Supervised speech enhancement comprises of three fundamental phases, training targets, learning machines and acoustic features [24]. The first proposed training target was IBM, which was influenced by the auditory masking in auditory perception. IBM marks the value of 1 to speech-dominant T-F units and 0 otherwise. The tests have demonstrated that IBM enormously improved the speech intelligibility for both normal hearing and listening impaired listeners [25–28]. Similar to IBM, the target binary mask (TBM) [29] classifies T-F units by matching target speech with the reference speech-shaped noise (SSN), and has also been shown to improve speech intelligibility. On the other hand, instead of a binary decision for a T-F unit, a soft decision defines the concept of IRM [30–32]. The IRM however, when compared to IBM, improves speech quality [33]. Both estimations are different; that is, IBM is a classification whereas IRM is a regression problem. Except masking-based targets, mapping-based targets have also been utilized in supervised speech enhancement algorithms. Mapping-based targets are specifically T-F representations of clean speech, e.g. log-spectrum. Though mapping-based targets seem more straightforward, prevailing studies have revealed their underperformance in masking-based targets primarily in terms of the speech intelligibility [33, 34].
Learning machines are vital and critical for supervised speech enhancement methods. Wang and Wang [35] first utilized the Deep Neural Networks (DNNs) for supervised speech enhancement and have shown large improvement over previous conventional methods. In each sub-band, a DNN is trained and tested to extract high-level features, which are then forwarded to estimate T-F mask. Acoustic features facilitate discriminative information to estimate T-F mask. The acoustic features, including mel-frequency cepstral coefficient (MFCC), perceptual linear prediction (PLP) [36], relative spectral transform PLP (RASTA-PLP) [37] and gammatone frequency cepstral coefficient (GFCC) [38, 39] are recently used for supervised SCSE methods.
In this paper, a supervised SCSE method is proposed. The main contributions of the proposed method are threefold. First, we propose a DNN-based supervised speech enhancement framework to enhance the noisy speech. Second, we use Global Variance Equalization as a post-processing step to equalize variance of features and to reduce over-smoothing residual errors. Third, examine the robustness of proposed speech enhancement method to speaker identification task. Comparisons show that the proposed method improves objective metrics of speech quality and intelligibility substantially and significantly outperforms the competing and baseline methods.
The remaining paper is organized as: section 4 describes the proposed supervised method. The experimental settings and results are presented in section 5 and section 6. Speaker identification results are discussed in section 7. The advantages are listed in section 8. Finally, the summary and concluding remarks are presented in section 9.
Proposed speech enhancement framework
Supervised speech enhancement maps the process as a supervised learning problem so that mapping is determined absolutely from the input data. The proposed method contains four modules i.e. feature extraction, training, enhancement and waveform reconstruction. In training stage, DNN model is trained by using features of noisy and underlying clean speech signals. The acoustic feature sets include the PLP, RASTA-PLP, MFCC, GFCC and AMS. We have selected the combination of RASTA-PLP, MFCC and AMS acoustic features. The features are coupled with related delta features. Auto-regressive moving average (ARMA) filter [40, 41] is applied to smooth temporal curves of extracted features to improve speaker identification rates:
Where F(t) shows feature vector at time frame t,
Where s(t) and n(t) shows clean speech and noise signals. After computing STFT of the noisy speech, we have frequency-domain representation of y(t) as;
Where ω shows frequency bands. In enhancement stage, the trained DNN is fed with noisy features to estimate the coefficients of IRM. The IRM is given by equation as:
Where X2 (t, ω) and N2 (t, ω) represent the speech and noise energies in different T-F units, whereas α is a parameter to tune the mask. We tested with various values of α and found α= 0.5 to be the finest choice. The estimate of clean speech magnitude is achieved by multiplying the estimated mask with the noisy speech magnitude. Finally, inverse STFT and add-and-overlap is applied to reconstruct enhanced speech.

(A): The dimension-independent and dimension-dependent global variances of the estimated and corresponding clean speech features, (B): Global variances after performing equalization.
The over-smoothing residual errors result in a muffled effect when estimated speech is compared to the underlying clean version. To mitigate this problem, global variance equalization is performed in order to equalize and lift global variances (GV) of the features. Global variance Equalization is a type of the histogram equalization, which plays a vital role in the density matching [43]. It is demonstrated in [44] that using information regarding global variance during voice conversion can considerably improve the subjective quality. The dimension-dependent global variances of the estimated and underlying clean speech features are referred to as GVEF(d) and GVCF(d), and are given by equations as:
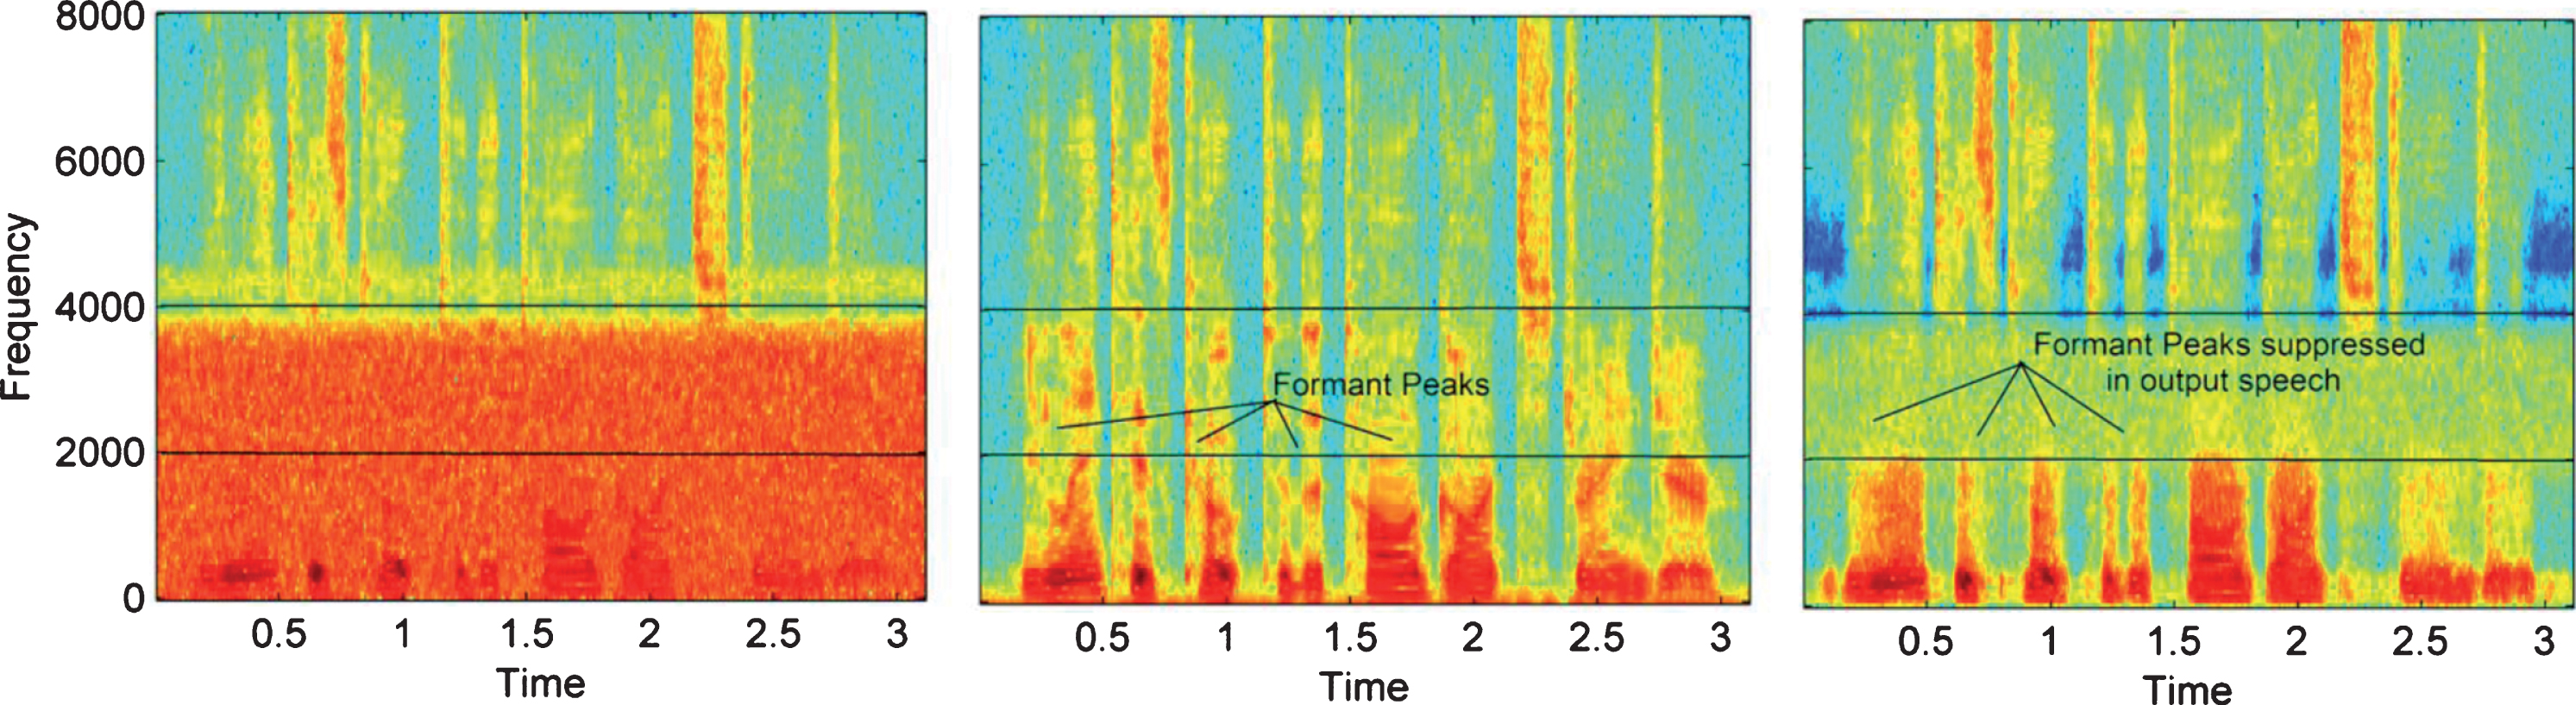
Over-smoothing analysis; spectrograms of speech utterance degraded by white noise at 0 dB. Estimated DNN output (right), the clean utterance (middle) and the noisy utterance (left)
The GVs of the estimated and the underlying clean speech spectra across the various frequency bands are demonstrated in Fig. 1(A). The GVs of the estimated features are lower than underlying features; indicate that estimated speech spectra are smoothed. Moreover, in low SNR conditions, over-smoothing phenomenon became worst and the formant peaks are suppressed. Over-smoothing in the high frequency bands leads to muffle speech. Figure 2 shows spectrograms of the speech utterance degraded by white Gaussian noise at 0 dB. A substantial over-smoothing could be noticed. The formant peaks are suppressed, mainly in the frequency bands between 2000–4000 Hz, produces a muffle speech. To minimize the over-smoothing, equalization factors are given as:
Parameters μ(d) and λ(d) shows the equalization factors, used to equalize dimension-dependent and dimension-independent GVs of the estimated and underlying clean speech features vectors. The equalization factors are learned and updated automatically from training data. The features of all input utterances are normalized to the unit-variance and zero-mean. The output from DNN is transformed as:
Parameters σ(d) and m(d) shows variance and mean of the speech features. The equalization factors lift the variances of output speech as:
Parameter ψ can either be μ or λ. The equalization factors sharp formant peaks of estimated speech and suppressed residual noise, hence, significantly improves the overall speech quality and intelligibility.
We used 720 IEEE open speech repository [45] utterances as training utterances. The core testing set comprised of 200 utterances from unknown speakers of both genders as a testing set. To match the sampling rates with noise sources, all speech utterance are resampled to 8000 kHz. We used twelve noise sources from the AURORA dataset [46] during training and testing. The noise sources include: airport, babble, car, coffee shop, exhibition hall, factory, restaurant, street, subway, train, white noise and pink noise. Except white and pink, the other 10 noise sources are considered non-stationary. The duration of each noise source is approximately 5 minutes. To construct the training sets, the first half of all noise sources is used and mixed with training utterances at –10 dB, –5 dB, 0 dB, 5 dB and 10 dB SNR. The testing mixtures are created by mixing the last half of all noise sources.
DNNs are selective learning machines, and have shown to perform well in SCSE [34, 48]. Here, a DNN framework used three hidden layers; the outer layer contains 1024 sigmoid activation functions. The standard back propagation algorithm is used to train the networks. To better deal with the mismatch problem between training and testing conditions, dropout regularization is used to improve the generalization potential of the network. The dropout rate is set to 0.2 and no unsupervised pretraining is used during the entire process. The adaptive gradient descent algorithm is coupled with a momentum term η to optimize the DNN. For first 5 epochs, the momentum rate is fixed at 0.6 while rate is increased and fixed at 0.8. The mean squared error (MSE) is used as objective cost function. Figure 3 shows objective cost function values at various epochs.

Objective Cost Function (MSE) values at different epochs in Airport, Exhibition Hall and Subway noisy environments.
For objective evaluation, Short Time Objective Intelligibility (STOI) [49] is used to predict the objective speech intelligibility. STOI refers to a correlation between the clean and enhanced speech utterances and has been demonstrated to show high correlation to human speech intelligibility. To evaluate the objective speech quality, Perceptual Evaluation of Speech Quality (PESQ) measure is used [50]. Similar to the STOI, PESQ scores are achieved by comparing enhanced speech with underlying clean version. The STOI scores range from 0 to 1 whereas PESQ scores range from –0.5 to 4.5. An SNR-based measure is the earliest metric to evaluate the performance of the speech enhancement methods. However, standard SNR metric does not offer a correlation with the speech quality because average over entire signal length may remove crucial contents. To handle this problem, the SNR is computed over short segments and then averaged. This SNR computation is referred to as the segmental SNR (SNRSeg). We considered this metric to examine the noise suppression in the reconstructed speech. Weighted spectral slope (WSS) and log likelihood ratio (LLR) are considered to measure the distance between the enhanced and the underlying clean speech signals. The competing methods are selected from three different classes of single channel speech enhancement; (a) NMF [11] is selected from the model based class, (b) Nonnegative robust principle component analysis (NRPCA) [51] is selected from matrix decomposition based speech enhancement class and (c): an improved version of the OM-LSA [3] denoted as LMMSE is selected from the statistical speech enhancement class for performance comparison. The proposed DNN based speech enhancement method is referred to as DNNP.
To fully evaluate and validate the performance of the proposed method at all input SNR, mean values of the performance are reported here for noise sources.
Comparison with competing methods
The proposed method is first evaluated in terms of the STOI. STOI is used extensively as a performance evaluation metric in the speech enhancement, provides a measure of the overall speech intelligibility of enhanced speech. Higher STOI scores imply better performance. Figure 4 indicates STOI scores obtained with DNNP and the competing methods in 60 situations (12 noise types x 5 SNR levels = 60 situations). The outcomes are averaged over 200 speech utterances. According to Fig. 4, DNNP outperformed the competing methods consistently in all 60 situations. The only exceptions were: subway and train noise at SNRs –10 dB and –5 dB, where we deem that all processing methods performed well. However, the proposed method surpasses competing methods at all SNR levels. All noise sources led to high intelligibility score (STOI > 85%) for SNR≥5 dB. But, considerable differences in STOI scores are found with the low SNRs. The proposed method led to the best overall prediction score: 94.04%. Note from Fig. 4 after comparison with NMF, NRPCA and L-MMSE, DNNP achieved the best average STOI scores for ten nonstationary and two stationary noise sources. For instance, the predicted scores with airport noise are improved from 55.14% with L-MMSE and 59% with NRPCA to 74.34% with DNNP at –5 dB SNR. Similarly, the average predicted scores with white and pink noises are improved from 56.20% and 62.80% with noisy speech to 78.03% and 85.6% with DNNP, respectively. The overall average STOI scores in all noises for DNNP are 60.89%, 71.39%, 79.96%, 87.73%, and 92.82% at –10 dB, –5 dB, 0 dB, 5 dB and 10 dB respectively. Results confirmed the dominance of DNNP in terms of intelligibility.

Objective Speech Intelligibility Rates using STOI Measure.
Average PESQ against competing methods
Average PESQ at different SNRs with different DNN Layers
Average SNRSeg at different SNRs with different DNN Layers
The PESQ metric is used to evaluate the performance of DNNP in terms of the speech quality. PESQ is found to have a high connection with subjective judgment of the speech quality [52] and reproduces perceptual quality of enhanced speech. The higher PESQ shows better performance. Table 1 shows results in terms of the PESQ. The results demonstrate that DNNP performs better than competing methods in all noisy conditions, especially at low SNRs (–10 dB and –5 dB). Note from Table 1, as compared to NMF, NRPCA and L-MMSE, the DNNP achieved the best average PESQ scores for all noise sources. For example, the predicted scores with street noise are improved from 1.25 with noisy speech to 1.69 at –10 dB SNR (ΔPESQstreet = 0.44) with DNNP. Similarly, the predicted scores with white and pink noises are improved from 1.18 and 1.19 with noisy speech to 1.41 to 1.48 at –10 dB SNR (ΔPESQwhite = 0.23 and ΔPESQPink = 0.29) with DNNP, respectively. The overall average PESQ scores in all noises for DNNP are 1.58, 1.83, 2.26, 2.59, and 2.85 at –10 dB, –5 dB, 0 dB, 5 dB and 10 dB, respectively. General comparison results presented in Table 2 have demonstrated that a DNN using three hidden layers (DNN3) performs the best at all noise levels in terms of the PESQ. Large improvements are achieved with DNNP, especially at low SNRs. The highest and the lowest improvements in PESQ scores are observed at 5 dB (ΔPESQ = 0.56) and –10 dB (ΔPESQ = 0.38), respectively.
SNRSeg metric is also used for the evaluation of DNNP. SNRSeg shows degree of noise suppression and higher SNRSeg indicates an improved performance. Table 3 provides average SNRSeg results for DNNP and competing methods. According to these results, DNNP outperforms the competing methods in all 60 conditions. By observing Table 3, DNNP achieved the highest average SNRSeg scores for all noise sources. The predicted average scores with DNNP are higher than all competing methods. The average scores are improved from –2.87 with noisy speech to 1.54 with DNNP. The overall average SNRSeg scores in all noises for DNNP are –2.90, –1.15, 1.43, 3.96, and 6.39 at –10 dB, –5 dB, 0 dB, 5 dB and 10 dB respectively. The highest and lowest improvements in SNRSeg scores are observed at 5 dB (ΔSNRSeg = 5.26) and –10 dB (ΔSNRSeg = 3.77). From general comparison results, it is clear that DNNP outperforms the competing methods at all SNRs and reflected higher degree of noise suppression. Figure 5 shows the SNRSeg improvements.

SNRSeg improvements analysis.
To further assess the performance DNNP, all the methods are judged in terms of LLR metric. LLR states the distance between clean and enhanced speech signals. Unlike PESQ and SNRSeg, lower LLR scores indicate an improved performance. LLR results achieved using DNNP and competing methods are given in Table 4. It is obvious from the scores that DNNP produces lower LLR scores than the competing methods in all test conditions. Overall average results demonstrated that DNNP performed better as compared to the competing methods. The average distance is improved from 1.41 with noisy speech to 0.55 with DNNP.
Average LLR at different SNRs with different DNN Layers
The last speech quality measure used for evaluation of DNNP with competing methods is WSS metric. Similar to LLR, lower WSS shows improved performance. Table 5 gives WSS results for DNNP and competing methods. As the results show, DNNP surpasses the competing methods in all noisy conditions. The results demonstrated that DNN using three hidden layers (DNN3) presented the most excellent performance at all SNRs in terms of PESQ, SNRSeg, LLR and WSS.
Average Normalized WSS at different SNRs with different DNN Layers
We examined time-varying spectrograms to evaluate DNNP in terms of the residual noise and speech distortion. Figure 6 presents time-varying spectrograms of DNNP and competing methods. A sample speech signal is degraded by airport noise at –5 dB SNR. The spectrogram of DNNP is depicted in Fig. 6(F), where the harmonic spectrums of the vowel are sustained in output speech. Moreover, the spectra also revealed a fine structure during speech activity areas. By analyzing the spectra during speech-pause areas, DNNP outperforms competing methods in removing background noise. The weak harmonic structures in high frequency subbands are better preserved. Therefore, perceptual quality of speech offered by DNNP is better than competing methods. The residual noise is evident in the spectrograms showing the output speech of the competing methods; shown in Fig. 6(C)-(E). The residual noise is noticeably reduced in speech of DNNP shown in Fig. 6(F).

Time-varying Spectral Analysis. (A) clean speech, (B) Noisy Speech: Degraded by –5 dB Babble Noise, (C) Processed by LMMSE, (D) Processed by NMF, (E) Processed by NRPCA and (F) Processed by DNNP.
We compared the proposed method with DNN-based single-channel supervised method proposed in [33], referred to as baseline-DNN and denoted by DNNB. Table 6 presents PESQ and SNRSeg results achieved from the DNNP and the DNNB at different input SNRs across twelve noise sources. The results demonstrate that the DNNP outperforms the DNNB in all noisy conditions. The equalization factors efficiently sharpen the peaks of formant and significantly improved the overall perceptual speech quality, confirmed by higher PESQ scores. High SNRSeg scores indicate that equalization factors also helped in suppressing of noise as compare to DNNB. The equalization factors lifted the variances of DNN output speech signals effectively, shown in Fig. 1(B). Table 7 demonstrates LLR and normalized WSS results achieved from the DNNP and the DNNB at different input SNRs across twelve noise sources. Low LLR and WSS results indicate that DNNP outperforms the DNNB and the spectral distance between estimated and clean speech is minimum. The estimated speech is a closed replica of the underlying clean speech. These evaluation results demonstrated the improved performance of DNNP and verified its effectiveness. Figure
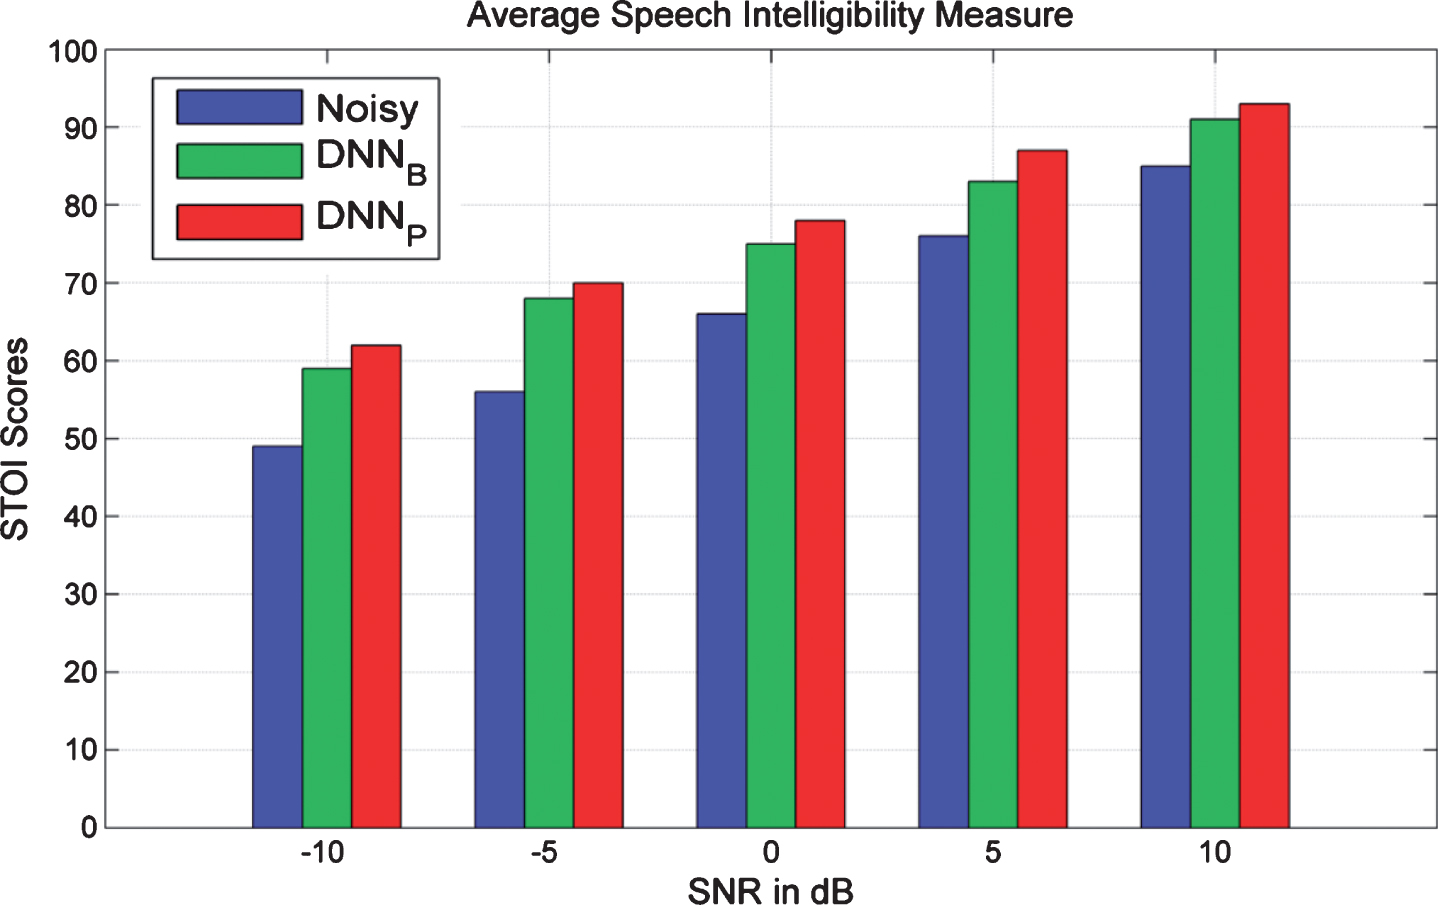
Average objective speech Intelligibility Rates for noisy, DNNB and DNNP.
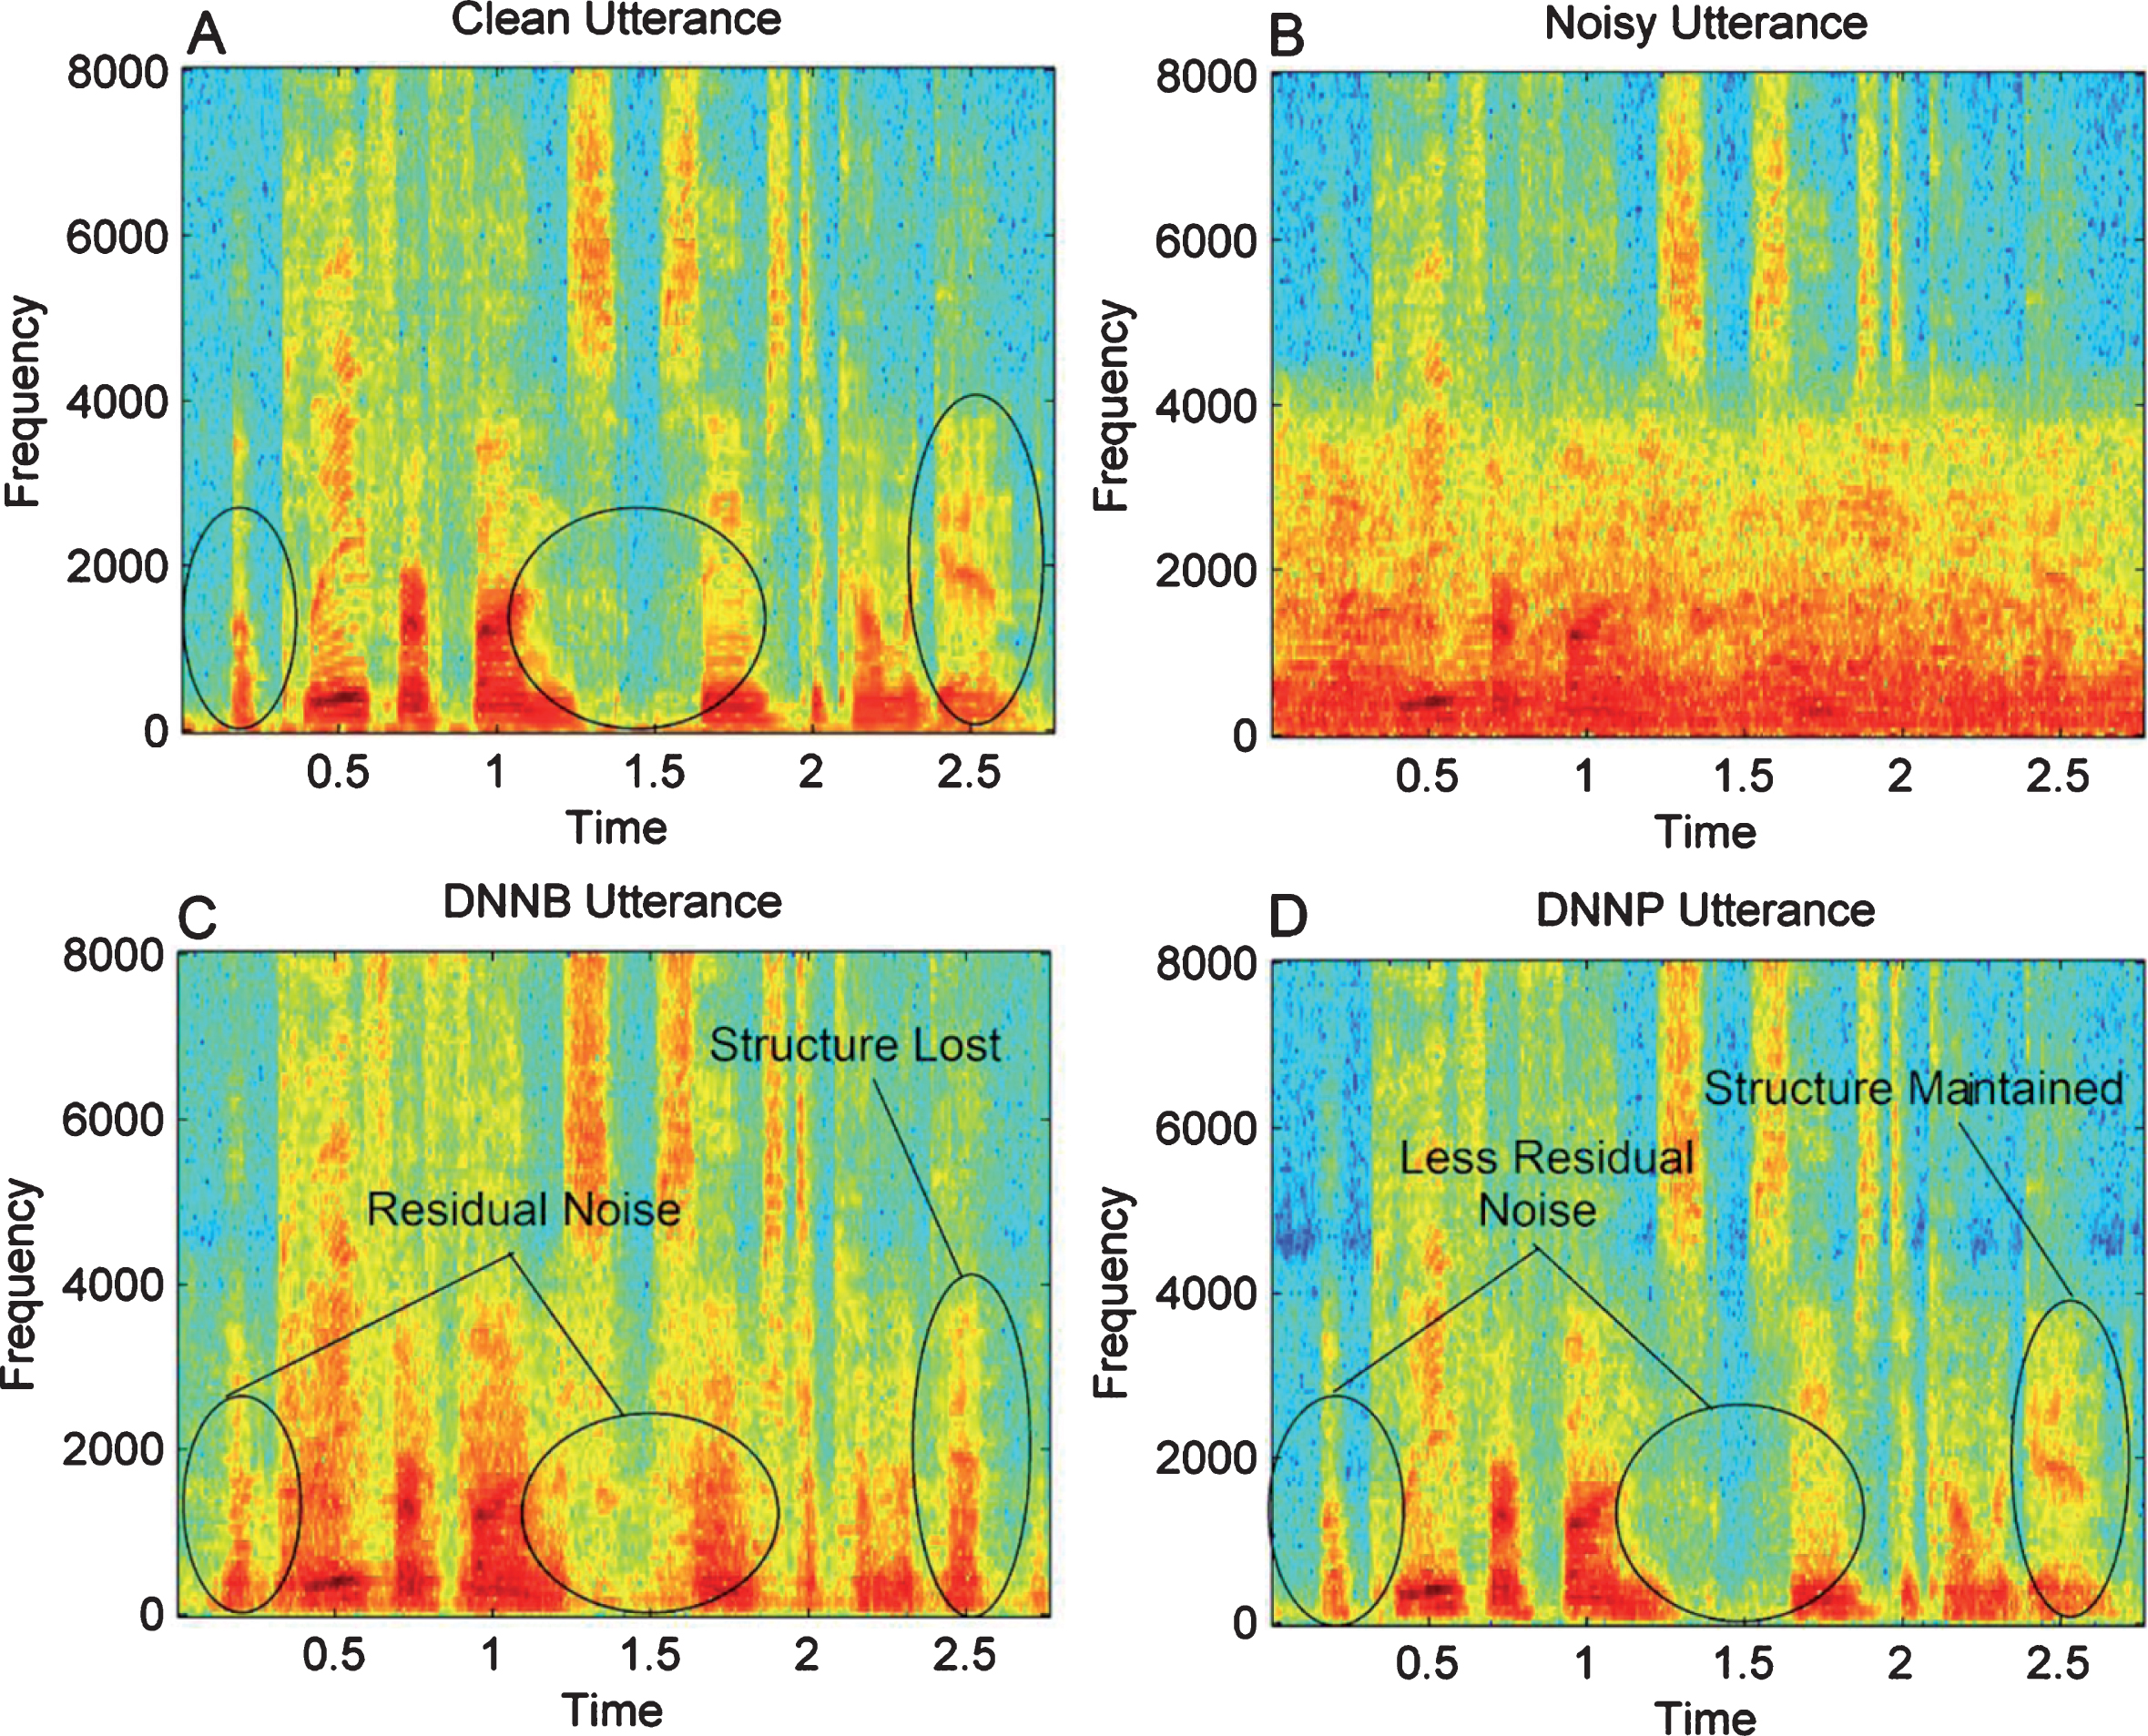
Time-varying Spectral Analysis. (A) Clean speech, (B) Noisy Speech: Degraded by –5 dB babble noise, (C) Processed by DNNB, (D) Processed by DNNP.
Average PESQ and SNRSeg scores at all Noise Types
Average LLR and Normalized WSS scores at all Noise Types
Noisy speech enhancement has been studied to offer robustness to speaker identification systems [53]. In order to evaluate the DNNP and the baseline methods for improving the accuracy of identification in nonstationary noisy conditions, speaker identification experiments are performed. In general, a speaker identification system consists of training and testing phase [54]. The system extracts sets of speech features during the training phase and generates models for speakers. During testing phase, the speech features are obtained from the test speech utterances and compared to the generated models of speakers. The key objective of the speaker identification task is to identify the test utterance of the enrolled speakers. It is shown in the literature that speaker identification systems based on the Mel-frequency cepstral coefficients (MFCC) features and the Gaussian mixture speaker model (GMM) are commonly used because of high recognition accuracies for clean speech utterances [55]. However, their performance can be severely degraded when the test speech signals are corrupted by the acoustic noises [56]. During experiments described here, DNNP based speech enhancement is applied to provide noise robustness to the speaker identification system. The MFCC feature vectors are extracted from the enhanced versions of the noisy speech utterances.
MFCC extraction
Following the acquisition and pre-processing, the speech utterances are divided into short-time overlapping frames. The FFT is then applied to all speech frames and the spectral envelopes are acquired using Mel-scaled bandpass filters. The frequencies in Mel-scale (f
MEL
) are correlated to the frequencies in the linear scale (f
Hz
), given by equation as:
The Mel-scale is frequently used in speaker identification system due to its excellent illustration of the human auditory system. Consider K numbers of filters in Mel-frequency filterbank [64] and E K log-energy output of the Kth filter, the MFCC coefficients are computed as:
M is number of cepstrum coefficients. We have selected K = 26 for MFCC extraction as adopted in literature [54, 57].
The experiments regarding speaker identification are performed with 100 speakers from TIMIT database. Out of 10 speech utterances per speaker, seven speech utterances are used to train the models of the speaker and the remaining three utterances are used for testing the models. All testing speech utterances are contaminated by twelve noise sources considering SNR values of 0 dB, 5 dB, 10 dB and 15 dB. The tests are conducted considering a confidence interval of 95%. The feature vectors (composed by coefficients) of the enhanced speech are extracted from 50% overlapping frames with 32 ms frame duration. Figure 9 shows the speaker identification rates for four noise types achieved during speaker identification experiments. The identification rates using clean utterances are about 98.8%. For speech processed by DNNP, the identification rates varied from 86.65% with airport noise at 15 dB SNR to 31.11% at 0 dB SNR. Similarly, for speech processed by DNNB, the identification rates varied from 76.61% with airport noise at 15 dB SNR to 23.13% at 0 dB SNR. Figure 9 demonstrates that DNNP outperforms the competing methods. The average identification accuracy improved from 33.84% with noisy speech utterances to 67.42% with utterances processed by DNNP method, equivalent to 33.58% identification gain. In different noisy conditions, preeminent improvement is achieved for the car noise at 10 dB SNR, from 37.22% to 72.11%, equivalent to a 34.89% gain. With reference to the additional DNN-based baseline method (DNNB), the DNNP improved the overall identification accuracy in 06.74%. It is important to notice that, although outperformed by DNNP, the DNNB also improved the identification performance for all the noise sources. In contrast, NMF and LMMSE degraded the identification accuracies for all the noise sources, whereas NRPCA improved average identification rates for few noise sources. It is important to point out here that, DNN-based methods which obtained the finest STOI scores (see Fig. 4), also offered the finest identification rates. Table 8 shows the average speaker identification rates for all noise sources.
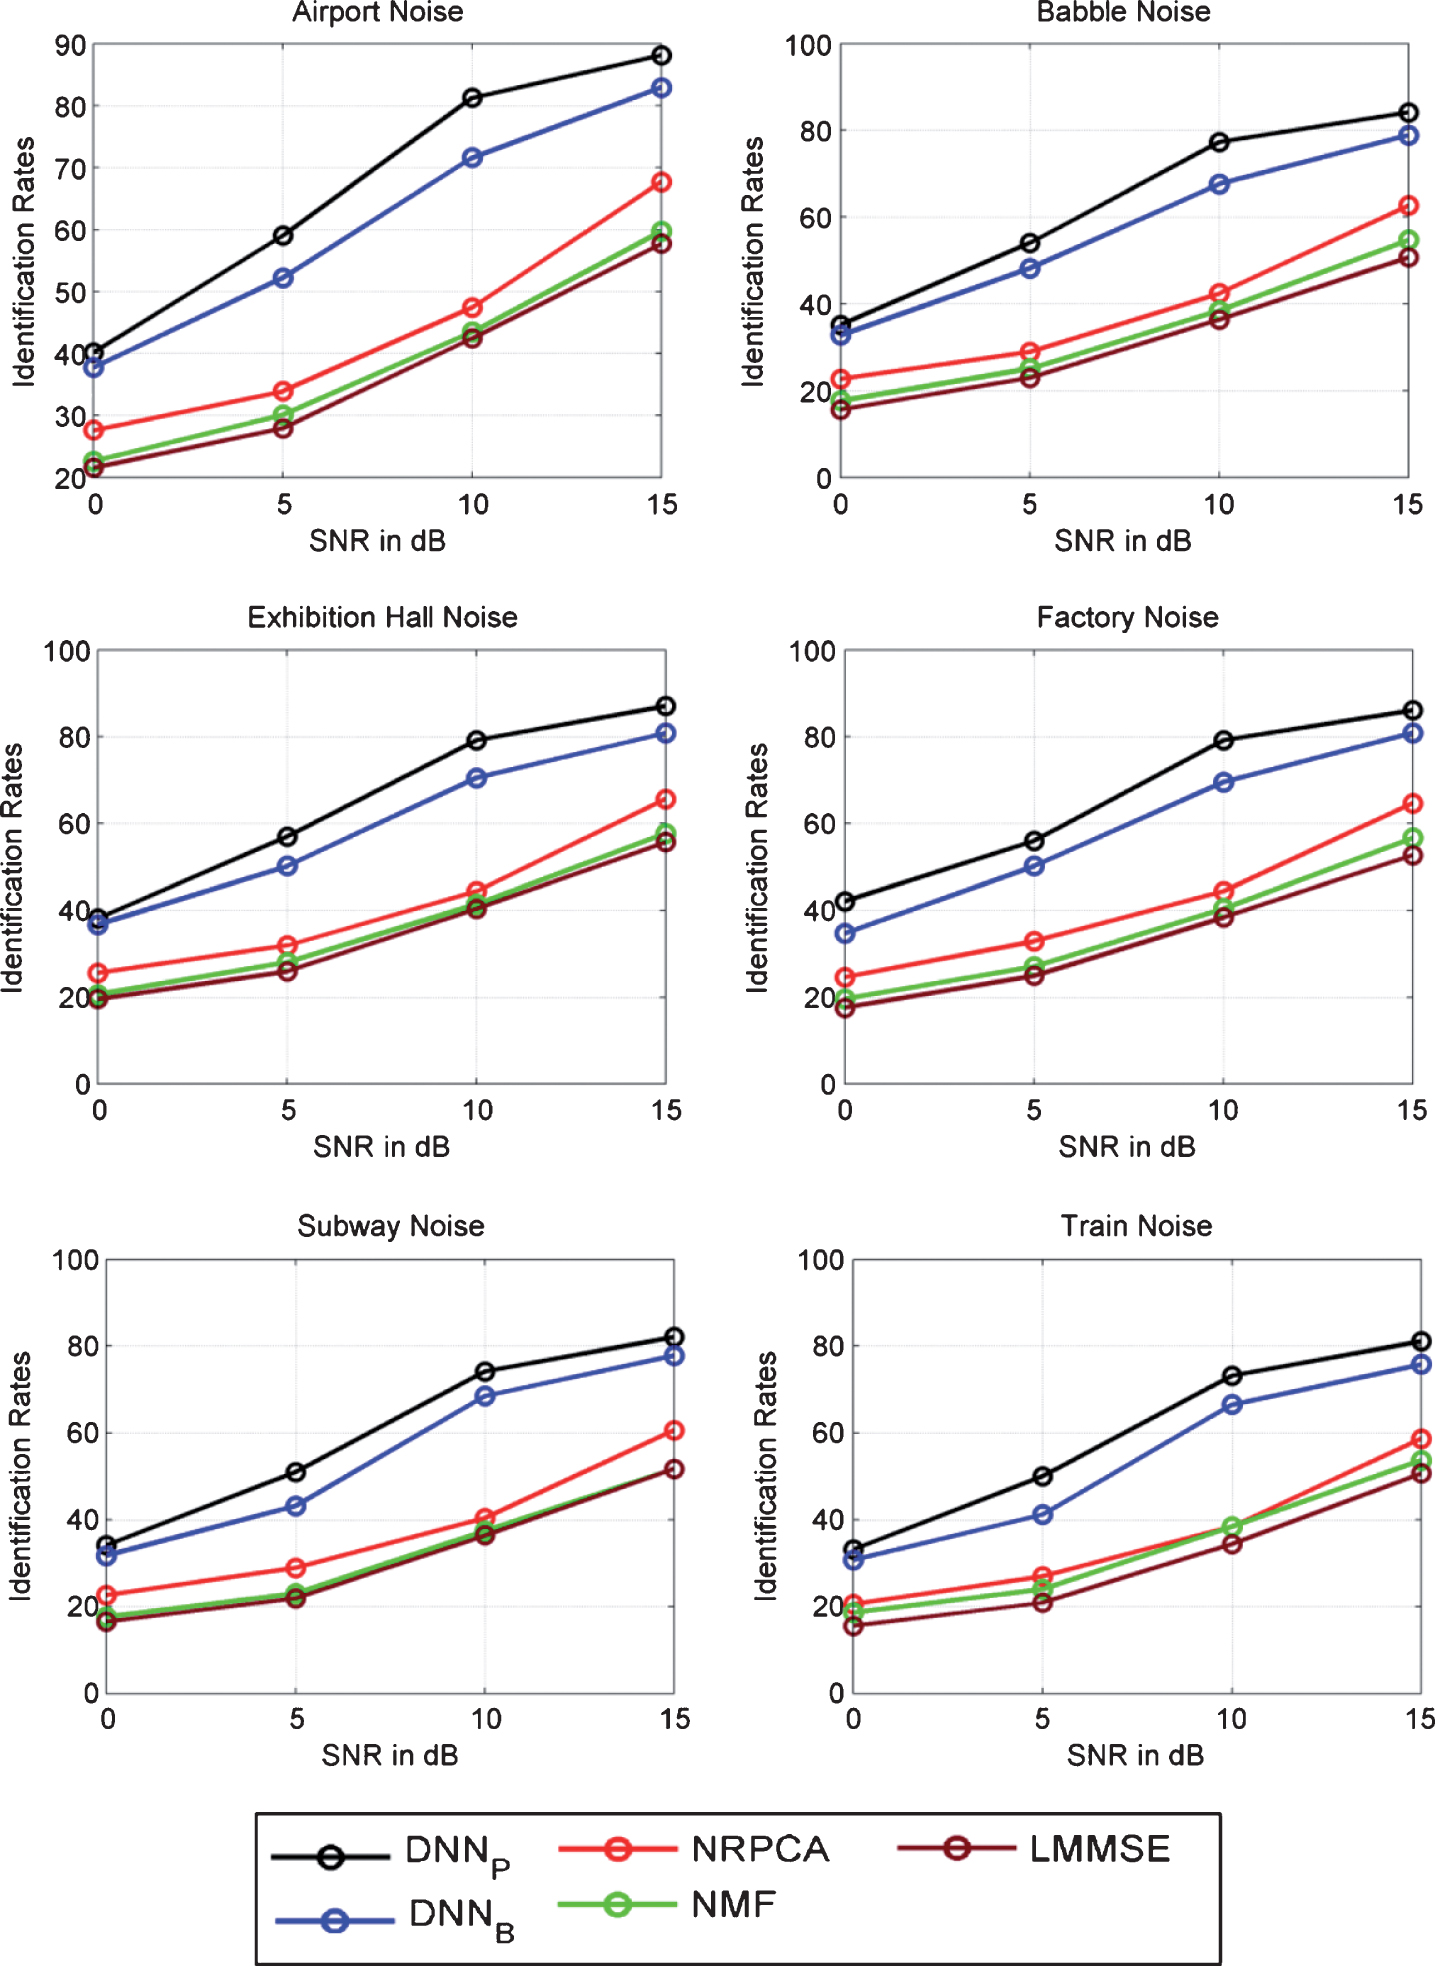
Speaker identification accuracies obtained with DNNP, DNNP, NRPCA, NMF, and LMMSE for four noise sources.
Speaker Identification rates (in %) Over 12 noise sources
Finally, we highlight the advantages of the proposed method over baseline-DNN and competing methods. (
Summary and conclusions
In this paper, a DNN-based speech enhancement method is presented; since it is deemed that the supervised learning machine frameworks offer an extensive approximation potential through comparative measures. A series of experiments are carried out to examine the deep neural network structures in terms of the intelligibility, quality and speaker identification rates. A combination of RASTA-PLP and AMS features is used. The features are smoothed through Auto-regressive moving average filter so that the distortion levels are appropriately controlled to provide improved speech intelligibility and identification. For better generalization, dropout and Global variance equalization techniques are used. To validate the effectiveness of the proposed method, the performance is compared to NMF, NRPCA and LMMSE methods. For further validation, DNNP is compared with baseline DNNB. Several hidden layers are considered to examine the performance of DNNP. It is noted that DNNP with three hidden layers has yielded comparable or even improved results in terms of the STOI, PESQ, SNRSeg, LLR and WSS. In last step, we conducted speaker identification accuracies. On the basis of results and analysis, the following concluding remarks are drawn:
All noise sources have led to the high intelligibility rates (STOI > 85%) for SNR≥0 dB. The best overall STOI prediction rate of 94.04% is achieved by the proposed method. An average STOI prediction rate of 65.25 % and 72.11% is achieved by the proposed method at low SNR conditions (–10 dB and –5 dB). The proposed method achieved the best average rates at all noise sources as compare to the noisy speech and the competing methods.
In terms of the PESQ, the proposed method performed better than the competing methods in all noise conditions consistently, especially at low SNR levels, –10 dB and –5 dB. The overall average PESQ scores in all noise sources for the proposed method is consistently higher at all input noise levels. The PESQ improvements at low SNRs (–10 dB and –5 dB) are significant as compared to competing methods.
SNRSeg rates reflected that high degree of noise is suppressed in the speech processed by the proposed method and achieved higher SNRSeg rates at all input SNR levels. The average SNRSeg rates are improved from –2.87 dB with noisy speech to 1.54 dB with the proposed method, which is a significant overall improvement.
In terms of LLR and WSS, the proposed method showed a smaller distance between clean and enhanced speech, which confirmed that the enhanced speech is more close to clean speech and achieved lower rates compared to competing methods.
The identification rates using clean utterances are about 98.8%. The average identification accuracy improved from 33.84% with noisy speech utterances to 67.42% with utterances processed by DNNP method, equivalent to 33.58% identification gain. In different noisy conditions, significant improvements are achieved for the car noise at 10 dB SNR, from 37.22% to 72.11%, equivalent to a 34.89% gain. With reference to DNN-based baseline method (DNNB), the overall identification accuracy of 06.74% is achieved.