
Abstract
Blood and blood products are vital resources for the surgery and the treatment of certain diseases. As a scarce and perishable resource, they require sophisticated management to minimize waste in order to address this challenge, the present study revolves around the idea of the management of the production, supply and distribution of blood products. In this research, two questions of robust and flexible have been investigated for the production, inventory and routing blood products. The flexibility is incorporated into the problem through introducing the possibility of sharing inventory among network entities by transferring blood products between hospitals and also the possibility of meeting a blood group’s need with another compatible blood type or replacement. The problem is then solved by heuristic (local search) and meta-heuristic (Adaptive Large Neighborhood Search (ALNS)) algorithms, which are the methods of choice in particular for NP-hard problems. Finally, the results obtained from the two algorithms are compared it is shown that the heuristic algorithm outperforms the Adaptive Large Neighborhood Search (ALNS) in both models, that can lead to reduction is cost and required transitions.
Keywords
Introduction
Despite the technology advancements in the field of alternatives to blood products, there is always a big need for blood depositories as a rare and vital resource for the survival of human life [24]. Blood products, including red blood cells, plasma, platelets, granulocytes, cryoprecipitate, etc are taken either directly from the donor or through a mechanical process from donated blood. In the meantime, red blood cells are the most in demand, and platelets have the shortest life span (3 days).
The complete blood is collected from donors in permanent and temporary centers in a blood supply chain, and then, it is transferred to treatment centers, where collected blood is tested to specify the blood group, presence of the virus and disease, and separation of blood components. The components obtained at this stage are stored in blood depository banks and transported to hospitals via dedicated shipping. The blood products, stored for a long time, cannot be injected to the patients and should be discarded. The blood flow from donors to patients appears to be a simple process such as that in the supply of the other perishable products in other supply chains. However, it should be noted that the importance of the blood supply chain is far more than that in ordinary perishable products. Furthermore, timely delivery of blood would constitute a life and death situation, that would differ that from other products. In addition, all the components of the chain serve the purpose of helping humans in a blood supply i.e. the customers in the blood supply chain help each other, which is rarely seen in other type of chains and products. Hence, blood is considered as an unusual and specific product according to Beliën & Forcé [2].
Generally, the blood has some specific characteristics as follows: Blood is a perishable product composed of many components, each of which has a different longevity and demand [26], and the time of procurement is only for hours after blood donation. Demand for blood products is highly random at demand points [2]. Supply of blood products is also random and it can face constraints. The blood products are vital for surgery and the treatment of diseases. The specific features of blood supply chain such as the ability to replace blood groups, Cross-matching, screening or T&S, increasing and decreasing the useful life of blood products, transfer, rotation, and retention has made it an attractive research field in the last few years.
As related to blood delivery, the vehicle routing problem, as one of the practical concepts in the field of operational research, has attracted attentions since the 1960s. A lot of efforts, made by researchers in this realm, lead to great advances in the field. In its simplest form, the problem domain includes a warehouse, a fleet of vehicles in the warehouse and a set of on demand customers. The goal of the routing problem is to determine the routes of vehicles to serve customers, so that transportation cost can be minimized without violating existing constraints. As one of the most important and challenging developments in vehicle routing problems, inventory control and routing decisions are two most commonly conducted studies.
The present study provides two robust and flexible solutions for the problem of production, inventory and routing blood products. Flexibility, which is generally defined as the ability to change or respond with little error in time, effort, cost, or performance, is considered in this study as the possibility of sharing inventory among network entities by transferring blood products between hospitals (about the first and second problems) and the possibility of responding to a blood group with another compatible blood type or replacement (only about the second problem).
The system flexibility makes it possible to share the stock out risk in the network and to increase the number of blood products supply sources, and this is reason that flexible system can quickly respond to changes in demand and supply in a dynamic and randomized environment.
A robust and flexible mathematical solution is presented in this research for the production-routing-inventory integrated problem for blood products in a supply chain, including a blood center and several hospitals within a discrete time frame. A limited-capacity vehicle is available, which travels a route for delivery of blood products to a subset of hospitals at the start of the period. There is a potential for demand surplus and shortage in different hospitals, which are modeled as uncertainties. There is also the possibility of surplus spoilage before consumption, and that the shortage should be eliminated as soon as possible. Hence, transferring between hospitals can help reduce scarcity, waste, and as a result, the system cost. In fact, this problem decides about the needed amount of blood products, the time and rate of transmission of blood product from the blood center to hospitals, the rate of transfer between hospitals, the rate of direct transmission from the blood center to hospitals, the inventory level in the blood center and hospitals, and the routes traveled by the vehicle. FIFO policyrmbox1 is also used to meet the patients’ demand. The problem objective is also to minimize the costs of transportation, transfusion, inventory and shortage against vehicle capacity constraints, production capacity, maximum waste, and the storage capacity in hospitals.
The second problem is formed based on the robust and flexible problem of blood products inventory-routing in a supply chain, consisting of a blood center and several hospitals in a discrete time frame. There is also a limited-capacity vehicle in this problem, which provides a route for delivery of blood products to a subset of hospitals at the start of the period. There is a potential shortage for hospitals and blood centers since hospitals and blood centers are respectively facing demand and supply uncertainties. Hence, the transfusion and replacement are incorporated in the problem in order to cope with the shortage. Actually, the second problem decides about the time and amount of blood donation from the blood center to hospitals, the rate of transfer between hospitals, the amount of direct transmission from the blood center to hospitals, the inventory level at the blood center and hospitals, the routes traveled by the vehicle and the amount of replacement. The objective function of the problem is to minimize inventory, routing, transfer, replacement and shortage costs against vehicle capacity constraints, blood group matching, and storage capacity in hospitals. The present research is structured on a set of data obtained from a case study in Tehran’s blood services.
The second part of this paper deals with studies on the blood supply chain, inventory-routing of blood products. The third part provides two mathematical models of the problem (providing two robust and flexible mathematical models) to control the inventory and routine of blood products in the blood supply chain. The fourth part presents a solution to the model with the heuristic and meta-heuristic algorithm and compares the obtained results, and the last part of this research is assigned to conclusions and suggestions for future research.
Research literature
Pertinent literature to studies, carried out on blood supply chain management are provided in this section to identify research gaps. Particularly, studies on the supply chain management of perishable goods and blood products were pioneered by Zyl & Jacobus in the 1960s. Based on the review paper of Beliën & Forcé [2], about 100 research articles have been published in the blood supply chain by 2010.
Researchers have begun to develop new ways to study inventory policies for blood products since 1960. The perishable nature of blood products, with its specific characteristics, such as the compatibility of blood groups, greatly increases the complexity of blood-related problems. However, the complexity of the platelet inventory can be greater than other blood products due to its very short shelf-life. Decision-making is mainly related to the definition of inventory policies at this stage and does not address the constraints and characteristics such as the availability of donors and the compatibility of blood groups.
There are several solution methods for the blood supply chain Mechanistic optimization methods are rarely used on blood inventory, though. The use of conventional optimization techniques seems to be impossible due to the complexity of this type of problem. The problem size and the variables nature can affect the quality of the obtained solutions. The evaluating criteria for the answer in this model are the available inventory level, availability of fresh blood, age of blood, date, and cost.
Recently, Gunpinar [11] and Gunpinar & Centeno [10] introduced optimization models to minimize total costs (purchase costs, maintenance costs, waste cost, shortage cost, and expiration cost). Gunpinar & Centeno [11] developed three mathematical models aimed at improving the efficiency of blood-related activities in blood centers and hospitals. The first model used the Integer Programming (IP) to identify the optimal order levels, so that the cost of purchasing, maintaining, shortage, and loss of blood products is minimized in a hospital with a given planning horizon. The IP model clearly indicates the age of the blood inventory, the non-deterministic (uncertain) demand, the demand for the two types of patients, and the rate of matching test for the injection. Sapountzis [27, 28] developed an optimization model to reduce the expiration rate based on the level of activity of each hospital and the allocation of inventory in two modes of deterministic and probabilistic demand. Inventory strategies were also designed to reduce waste and shortage. Federgruen et al. [6] proposed two models for the routing and inventory allocation aimed at minimizing the shortage costs, shipping costs, and expiration cost. Hendalianpour [14] presented mathematical modeling for integrating production-routing-inventory perishable goods: a case study of blood products in Iranian hospitals. obtained results showed high efficiency of this algorithm regarding time and quality of answers. Lowalekar [21] demonstrated an application of TOC’s thinking process (TP) in a blood bank environment. The results in this study should be readily applicable to other blood banks which are trying to promote their operational and financial performance. Ghasemi [8] studied a selective covering-inventory-routing problem to the location of bloodmobile to supply stochastic demand of blood. They proposed model that considered inventory management rules of Iranian Blood Transfusion Organization (IBTO) and also the bloodmobile routing problem. Jabbarzadeh et al. [16] examined dynamic supply chain network design for the supply of blood in disasters: a robust model with real world application. Location and allocation decisions were specified in a set of earthquake scenarios developed using different combinations of critical parameters. Hssini et al. [15] presented modeling inventory routing problem in supply chain of blood products. They studied the simultaneous optimization of the storage and distribution of blood products. this problem explained by introducing two literature reviews, including the first one was about the researches concerning the blood products inventory and distribution processes and the second one examined to various works dealing with IRP problems. Li and Liao [20] studied the optimal parameter design for a blood supply chain system by the Taguchi method. This model was able to find the optimal minimum and maximum inventory and the optimal donor entry rate. However, the model does not include important features such as compatibility testing. Telles et al. [29] presented a normal inventory model for platelets, plasma and erythrocytes. Their model does not include any specific properties of blood products. Hemmelmayr & Doerner [12] used integer programming for the delivery of blood products to Austrian hospitals with a cost-centered approach. Hemmelmayr et al. [13] provided an improved version of their model. In this model, demand is considered randomly and the model includes several forms for responding to demand in the event of an emergency. Ganesh et al. [7] modeled the distribution and collection of blood as a vehicle routing problem with delivery and collection. Since the problem is in the NP-hard category, they provided a heuristic method to find the initial solution as the input for the meta- heuristic method. Pegels & Jelmert [25] used a Markov chain model to evaluate two blood-transfusion policies (FIFO, LIFO). They examine the effects of these two policies on the average levels of inventory (which determines the blood shortage probability) and investigated the average age of blood at injection time.
The subject literature can be divided into based on a hierarchical structure: at hospital level, at regional blood center level and the supply chain level. Among the papers devoted to this category are Godin et al. [9], Denesiuk et al. [5]. The studies on the blood center level deal with distribution policies between hospitals. The present research is conducted at this level.
After presenting the existing gaps in supply chain management, and according to conducted research, no research has been addressed the problem of production, inventory and routing of blood products so far, and most studies in the field of production management and distribution of blood products has provided a replenishment (or production) policy for the blood center without addressing the problem of routing it to hospitals. Therefore, the first model is the first integrated model of production-routing-inventory in the field of blood transfusion between hospitals. Transfusion between hospitals and the ability to replace blood groups simultaneously is only seen in the Long (2010), regardless of the problems of blood products production and delivery routing and with the optimization-simulation approach. A number of papers have proposed initiatives to replenish blood products in hospitals, among them, only Hemmelmayr et al. [12, 13] studies the routing problem for distributing blood products to hospitals; however, they did not consider the replacement and transfusion possibility in their model. This is the first model of inventory-routing, which involves both transfer of replacement. It should be noted that this model is the first model in the field of inventory-routing problem, which considers uncertainty both in supply and demand. Finally, the present study contributes to the extant literature by providing the heuristic methodology and the development of an Adaptive Large Neighborhood Search algorithm to solve the proposed models and the conducting a case study on Tehran’s blood services.
Mathematical problem
Two robust and flexible mathematical models were provided in this paper for inventory control, decision making regarding production rates, distribution schedules, vehicle routing, transfers between hospitals and supply with compatible blood groups. The first model incorporates an optimal policy for replenishment or production at the blood center, the FIFO policy for use in hospital and the blood transfusion between hospitals as a kind of flexibility. The second model, in addition to considering blood transfusions among hospitals, considers the matching of blood groups and the demand for a blood type from any other compatible blood type as another type of flexibility. The matching of blood groups is displayed with a binary matrix in the model, which reflects on the demand for red blood cells in each blood group to be provided using other compatible blood groups, so the model has the ability to compensate the demand of non-available blood groups with other blood groups compatible with it. The goal is to minimize transportation, shortages, transfusion and maintenance costs at the blood center and hospitals. In the second model, replacement costs are included in addition to the aforementioned costs. This cost in included when a matched blood type is used to supply demand. The demand parameter in the first model and the supply and demand parameter in the second model include uncertainty and the robust optimization of Mulvey & Ruszczyński [22] was used to deal with uncertainty.
Research contributions
Although many studies have been carried out on blood supply chain management duo to the attractiveness and importance of research in this field, however, most studies have used the numerical and non-analytical simulation approaches because of the complex nature of problem; so that the transfusion between hospitals and the possibility of supplying demand with matched groups are not investigated within the optimization approach at all. Also, most studies on the management of production and distribution of blood products have provided production policy for the blood center (the place where blood products are produced) and the issue of routing it to hospitals is under consideration. This study covers studies of the application of research to operations in the blood supply chain. This research includes the application of operations research in the blood supply chain. In addition to production management, inventory management, and distribution planning, this study considers inter-hospital transfers to cope with demand uncertainty, as well as offers an innovative problem-solving approach to a case study of Blood transmission services. Research contributions are: Providing a robust and flexible mathematical model for the integrated production-routing inventory of blood products Providing a robust and flexible mathematical model for the inventory -routing problem of blood products Considering uncertainty for demand and supply of blood products in the inventory -routing problem Providing a heuristic algorithm and an Adaptive Large Neighborhood Search algorithm for the proposed problems. Using a case study on Tehran’s blood transfusion services to examine proposed models and algorithms.
Problem statement: Production-routing-inventory
The problem is modeled as a three-level supply chain, including a blood center and a set of hospitals and patients in a limited time horizon. The blood center is constrained by the production (or replenishment) of each period and should decide on the amount of blood products at the start of each period. Also, a limited-capacity vehicle is available, which provides a delivery route of blood products from the blood center to a subset of hospitals at the start of each period. However, since hospitals have different demand scenarios in each period, there is a possibility of transfusion between hospitals and also direct transfusion from the blood center to hospitals (in general, transfusion) after occurrence of any of any scenario during the period. Other assumptions are as follows. The blood banks and hospitals inventory is known for any age group at the start of the first period. The hospitals capacity is limited. The maximum amount of production is known for each period. The blood product longevity is limited and evident. FIFO policy is used in hospitals.
Next, after the definition of sets and indices, parameters and variables, the problem presented in certainty condition is modeled; then a brief explanation of the robust method is given and finally, the robust problem is developed.
Sets and Indices
V: set of hospitals and blood centers i, j∈ { 0, 1, 2, . . , n }
V′: Set of hospitals i, j∈ { 1, 2, . . , n }
T: set of periods t∈ { 1, 2, . . , τ }
G: set age group g, gg∈ { 1, 2, 3, . . , H }bsv
S: set of scenarios s, s ∧ ′ ∈ {1, 2, . . Ω}
h i : Storage cost at the ith hospital and the blood center
PC: Production cost of each unit of blood products
C ij : Transportation cost of a vehicle between nodes i and j
b ij : Transfusion cost between node i and j
Ω: Weighted penalty for trade-off between solution robustness and model robustness (shortage cost)
BB t : Maximum amount of production at the blood center in the period t
Q: vehicle capacity
C i : Storage capacity at the ith hospital
ML: Maximum waste amount
λ: Weight assigned to the objective function variance
p s : sth scenario probability
Mathematical model of the first problem in certainty conditions
The objective function (1) minimizes inventory, routing, transfusion, and production costs. The constraint (2) updates the blood level of the blood center for the upper two years old age group, while constraint (3) indicates the level of blood center for a one-day blood product according to the amount of production. The constraints (4) and (5) determine the level of hospital inventory for upper two years old age group and upper one-year-old age group age group, respectively. The constraint (6) limits the number of waste. The constraint (7) indicates the production constraint. The constraint (8) indicates that demand can be provided from any age group. The constraints (9) to (11) are used to enforce FIFO policy for use in hospitals. The constraint (9) shows that if demand is provided from an age group g, its associated auxiliary variable (
The constraint (15) indicates vehicle capacity constraints. The constraint (16) is the tour formation constraint and Constraints (17) and (18) are the tour removing constraints. The constraint (19) states that a vehicle is available. The constraints (21) to (25) show the type of variables.
The network considered for this problem includes a blood center and several hospitals. The function of this network is as follows: firstly, a large, limited-capacity vehicle visits a set of hospitals through routing and supplies some blood products to them. Since the blood center and hospitals deal with different supply and demand scenarios, there is the shortage probability. Hence, there is the possibility of transfusion between hospitals and direct sending from the blood center to hospitals (generally, transfusion) and estimating demand with a matched blood type (shortly replacement) to prevent shortage. Figure 1 demonstrates a schematic view of the second problem. More clearly, when a hospital suffers from a lack of a blood type, it can do several measures: 1) to allow for occurrence of shortage, 2) to acquire blood from a matched blood group in the same hospital, 3) to acquire blood from the same blood group in the blood center or another hospital; or 4) to use the matched blood type available in the blood center or other hospital to supply demand. Also, the blood center can also respond to the lack of the matched blood type. Other proposed model assumptions are as follows:
Blood banks and hospitals inventory at the start of the first period, the demand of hospitals in each period and the amount of replenishment of blood bank in each period are known for each blood type.
Hospitals capacity is limited.
The demand for each blood group can be estimated based on the matched blood type.
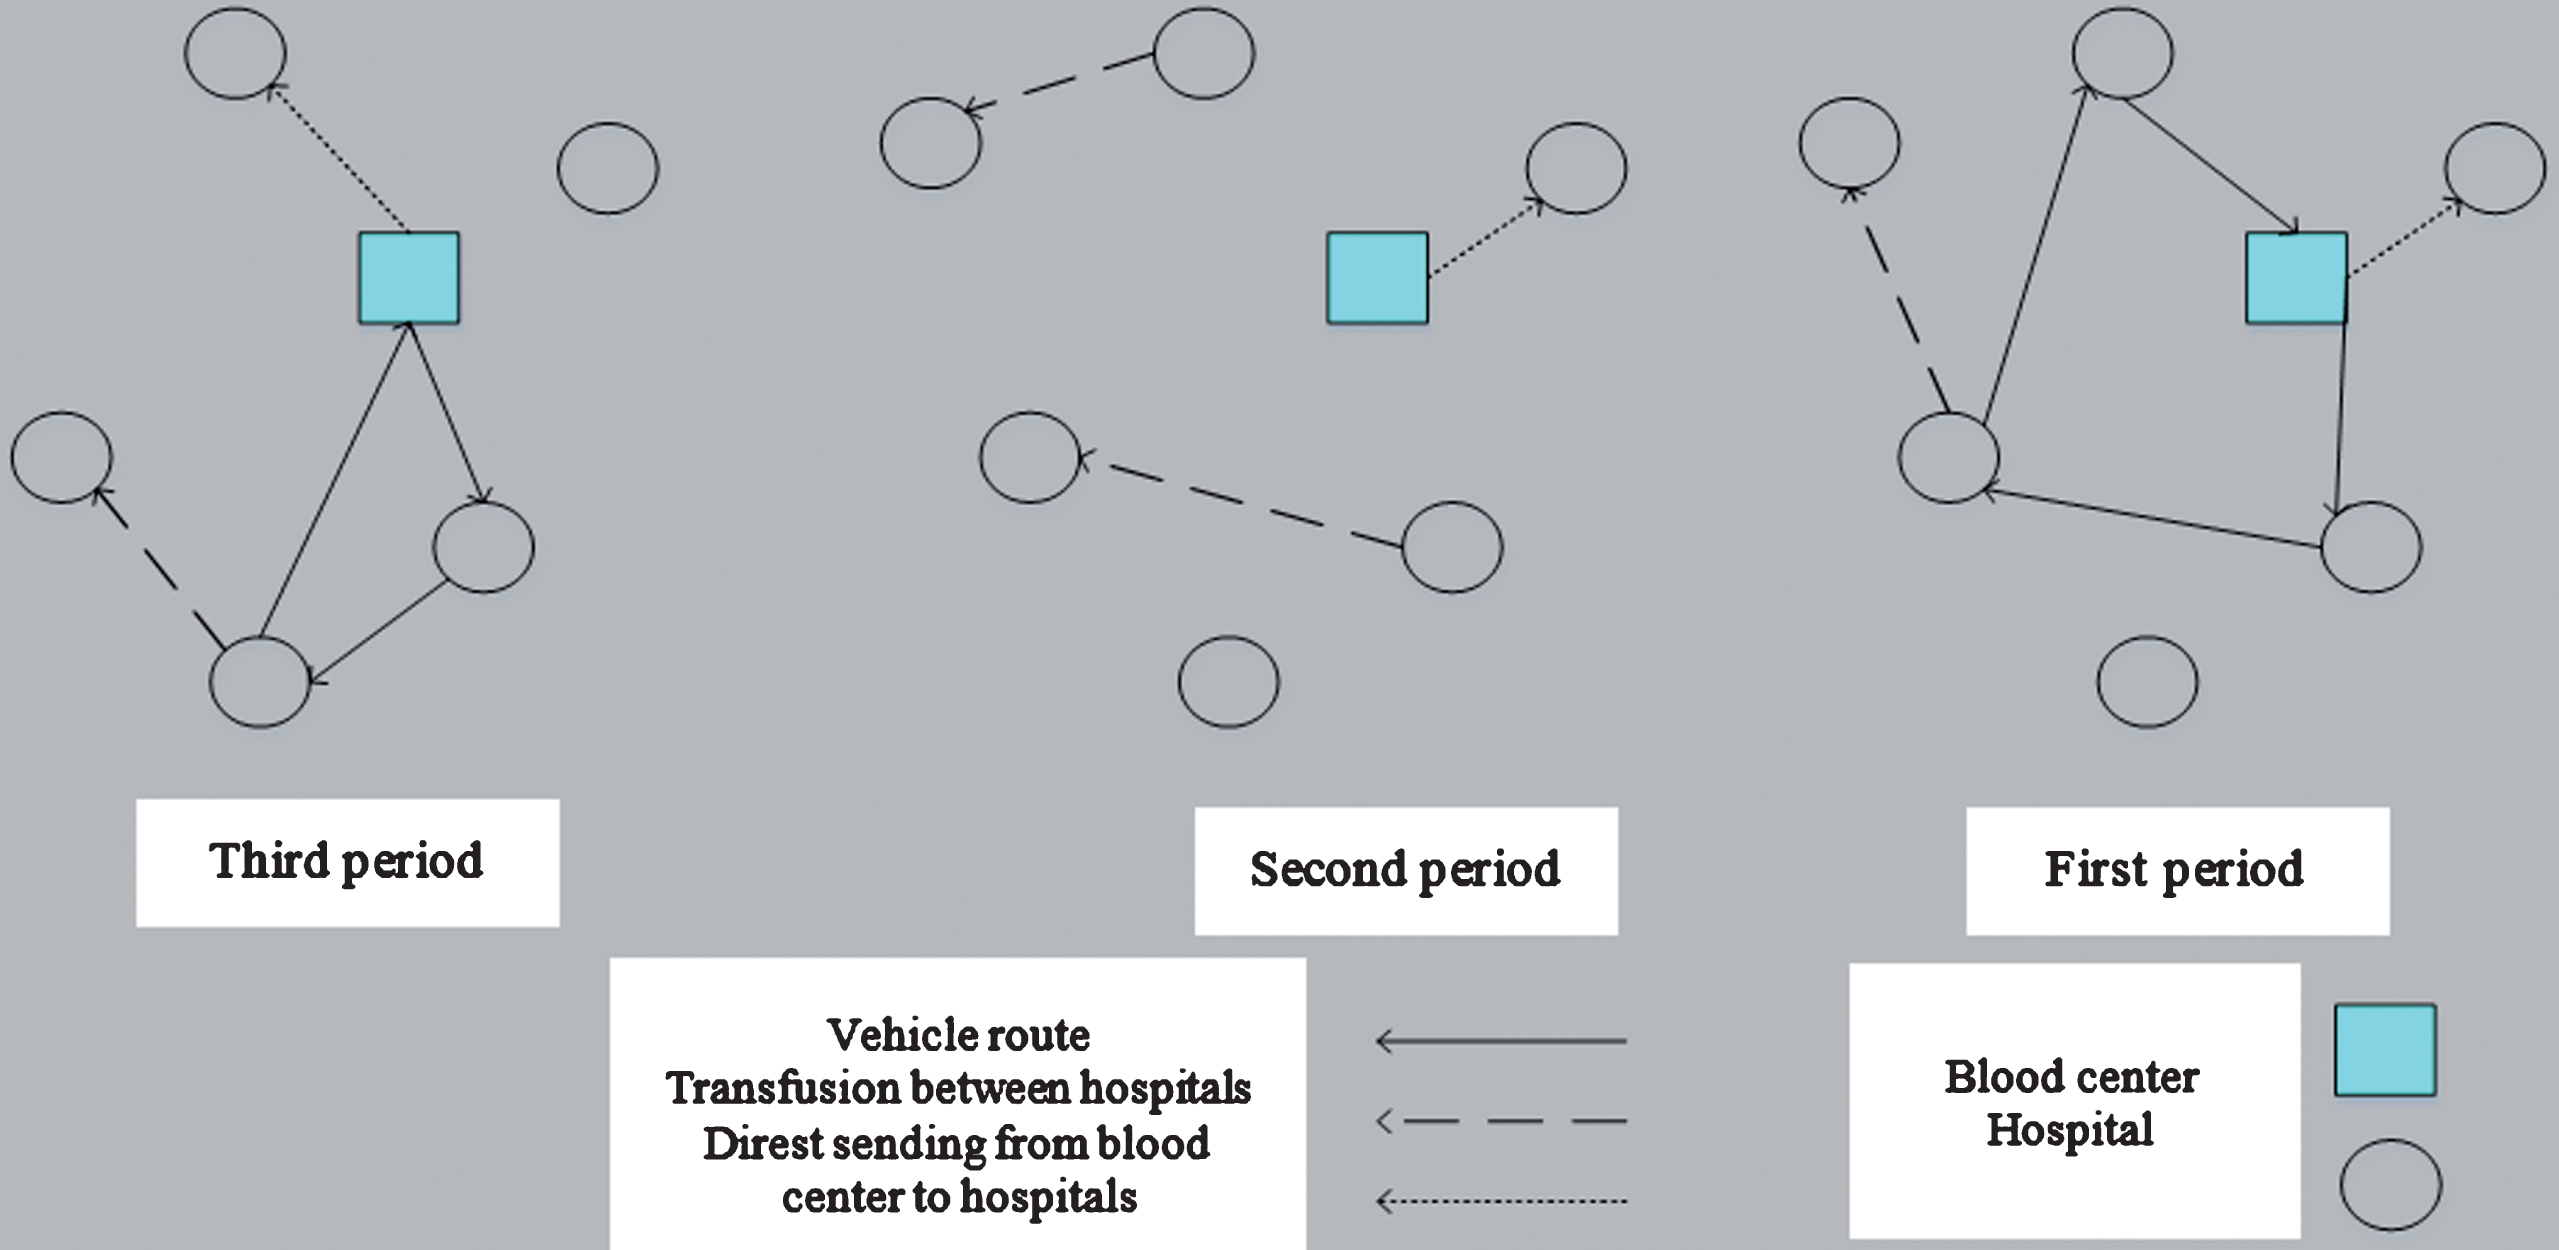
The schematic view of the second problem: inventory-routing with transfusion.
Table 1 shows the matched blood groups in terms of the Red Blood Cell product. For example, the O- blood group (blood type 2) can supply blood to all of blood groups and can only receive blood from its blood group. Plasma and whole blood also have their own capabilities. There is no matching problem about platelets, and all blood group owners can donate platelets to each other. The only exception is for the use of this product in lower aged patients, that matching with ABO blood group should be considered in order to receive platelets.
Blood group matching for the red blood cell
The indices, sets, parameters, and variables related to the second model are presented in the following section. It should be noted that the additional and existing items provided in the first model are no longer expressed.
R: blood group set r, u∈ { 1, 2, . . , 8 }
Ft,r: Degree of replenishment of the blood center from the blood group r in period t
Ft,r,s: Realization of Ft,r under the scenario s
MSr,u: Matching matrix of blood groups, r blood donator and u blood receptor group
The mathematical model of the second problem in certainty conditions
The objective function (26) is to minimize the cost of routing, the cost of storage in blood center, the cost of storage in hospitals, the cost of transfusions between hospitals, and the direct transfer from the blood center to hospitals and replacement costs. The constraint (27) indicates that the blood center’s inventory of any blood group in each period is equal to the blood center’s inventory of that blood group at the end of the previous period plus the amount of replenishment of that blood group, minus the amount sent from that blood group to hospitals via routing, minus the amount sent from that blood group directly to the hospitals. The constraint (28) states that the level of inventory of each hospital for each blood type is equal to the level of inventory of that blood group at the end of the previous period plus the amount received from that blood group via routing, plus the sum of the amounts received from that blood group from the blood center (direct delivery) and other hospitals, minus the sum of the amounts sent from that blood group to other hospitals, minus the sum of the amounts used to estimate the demand for a matched blood type (e.g. the blood group AB- can be divided into two blood types namely AB- and AB+. So, the coefficient
In order to model scenario-oriented problems where objective function and problem constraints are measured under different conditions, methods should be used to answer the solution for all the different robust response scenarios (close to the optimal answer). Robust method is one of the ways in which an answer can be achieved by finding the most suitable performance in all scenarios. See Mulvey [22] and Yu & Li [30] for more information in this regard.
The robust counterpart of the first model: Production-routing-inventory
Consider the components of the objective function below for the robust modeling of the first problem:
According to the above components, the objective function model of the robust model is suggested as follows.
The first and second phrases in the objective function (48) represent the cost of routing and production respectively that are independent of the occurrence of each scenario. The third phrase is the mean and the fourth phrase λ is equal to the variance of the objective function, except of production and routing costs. The average of these costs (production and routing) is equal to themselves (first and second phrase) and their variances are zero. Finally, the final statement indicates a penalty for violating control limits or the same shortage cost.
According to the constraints (7), (13), (15) – (19), (23) – (25) and the constraints:
Constraints (47), (48), (49), (50), (51), (53), (54), (55), (56) and (57) are the constraints (2), (3), (4), (5), (6), (9), (10), (11), (12) and (14) respectively that are defined for each scenario. The constraint (54) is the control limit that equates demand with the sum of inventories of different age groups that are used to supply demand and the amount of shortage. The constraint (58) is an auxiliary constraint that is used to linearize the model. Finally, the constraints (59) - (61) indicate the type of variables.
Consider the components of the objective function below for the modeling of the first problem:
According to the above components, the objective function of the robust model is suggested as follows.
The first phrase of the objective function (67) represents the cost of routing. The second and third phrases represent the mean and λ times of the objective function variance, respectively. Note that the routing cost variance is equal to zero and the mean is equal itself (first phrase). The last phrase is also used to penalize violation of control constraints under different scenarios.
According to the constraints (31), (33) – (37), (39), (42) and the constraints below
Constraint (70) is an auxiliary constraint that is used to linearize the model. The constraint (75) is a controlling constraint and updates the blood center inventory level by considering the demand for the blood product (shortage). The constraint (73) is also a control constraint that equalizes the amount of demand with the demand provided by different blood groups and shortage. The constraints (72), (74) and (75) are the same constraints (29), (31) and (33) defined for each scenario. The constraints (76) - (79) indicate the type of variables.
The mathematical models presented in the previous sections are NP-Hard Therefore, solving it is not possible in a reasonable time. On the other hand, a heuristic solution methods and a meta-heuristic solution are suggested to solve these problems. Hence, two heuristic algorithms and an Adaptive Large Neighborhood Search algorithm are proposed for solving models. The modeling results are compared with the proposed algorithms. Also, a data set in the research literature is used for the validation of the two problems presented with an exact solution method.
The heuristic algorithm
The proposed solution method starts with an initial solution (i.e., an initial value problem) and improves the solution found iteratively by two local searches called “inserting the best” and “removing the worst” and also a shocking step to prevent the algorithm from being trapped. It is optimally localized.
Developing the initial solution
Developing the initial solution involves two steps; in the first stage, the paths are formed, and then the values of other variables are determined according to the fixed paths. In order to form the route, 75% of the hospitals are selected randomly in each period, and then, they are included in that route using the cheapest Insertion rule. It is worth noting that the 2-opt operator should be used to improve the formed routes as long as the improvement is possible. For the second stage, the heuristic algorithm uses a mathematical model known as the flow network problem. See Coelho & Laporte [4] and Coelho et al. [4] for further information. The flow grid model for the first and second problems is studied as follows.
•the flow network model for the first problem
According to the constraints (7), (15), (24) – (25), (47) – (61) and
Where
•The flow network model for the second problem
Considering the constraints (33), (39), (67) – (77) and
Construction (83) ensures that delivery is only made to hospital, visited by the vehicle.
As mentioned earlier, two local searches are used to improve the answers. Local search adds the first local search (inserting the best) of unvisited hospitals to the route, that inserting them decrease the total cost more than the insertion of the other hospital. To determine these hospitals as well as the values of other variables attributes such as the amount of production, the amount delivered by the vehicle, the amount of transfer between hospitals, etc., the following model is used, which is derived from the idea et al. (2012). cited in the work by Archetti
•the best insertion model for the first problem
According to the constraints (7), (15), (24) – (25), (47), (61) and
Where

How to calculate hospital insertion and elimination cost.
•The best insertion model for the second problem
Considering the constraints (33), (39), (67) – (77) and
The second local search seeks to remove the visited hospitals, which, in turn it would lead to the value of objective function being further reduced. According to a previous local search, a mathematical model is used to determine these hospitals and their corresponding variable sets. The worst elimination model for the first problem
According to the constraints (7), (15), (24) – (25), (47) – (61) and
Where The worst elimination model for the second problem
Considering the constraints (33), (39), (67) – (76) and
There is a possibility of falling into a local optimal solution if the algorithm is always improving the solution. Therefore, a shocking stage is incorporated into the solution methodology, i.e., like random walk, to avoid this and to expand the search space. At this stage, a period is randomly selected and all hospitals visited at that period are eliminated. To determine the values of other variables, the flow network model (like determining the initial response) is used.
Adaptive Large Neighborhood Search Algorithm
The Adaptive Large Neighborhood Search Algorithm (ALNS) starts with an initial response, and then addresses searching for neighboring answers in a loop. The search phase in the ALNS algorithm is divided into several sections. In each replication of each section, an operator is selected from several possible operators to move to the neighboring answer. The operator selection is performed by the roulette wheel based on the weight of the operators (the weight of all operators is 1 in the first section). There are three modes in the operation of the operators: 1) operator obtains the best answer. In this case, the operator’s range is increased byσ1 (the range of all operators is zero at first); 2) the operator has a better answer than the current answer. In this case, the domain increases by σ2; 3) the result obtained by the operator has not improved that the operator’s domain increases or does not change by σ3, depending on whether the answer is accepted or rejected according to the acceptance criterion. So that σ1 ≥ σ2 ≥ σ3 ≥ 0. The acceptance criterion mechanism is in this way that a random number is created between zero and one; if the generated number of is lower that ΔS (94) phrase, the new answer is accepted; otherwise, it will be rejected. S n in this case denotes the value of the objective function of the new answer, and S f denotes the value of the objective function of the previous answers. In fact, in early iterations where the temperature is too high, it is more likely to accept worse solutions. With a gradual decrease in temperature, there will be less chance of accepting worse solutions in the final iterations. Each section also requires that the range of operators to be set at zero and the weight of the operators is calculated using Equation (95).
Where W i is the weight of the operator i, o ij is the times of using the operator i in the last section j; η ∈ [0, 1] is the response factor and v i ≥ 1 is the normalization factor (this factor depends on the operator’s computational time). π i is the total range of the operator i in the last section. It should be noted that the weighted acceptance criterion is used in this study. The idea of this acceptance criterion is that the temperature is so high in the initial iterations so that it is more likely to accept worse solutions. With a gradual decrease in temperature, there will be less chance of accepting worse solutions in final iterations.
Two case studies on Tehran Blood Transfusion Services for distributing red blood cells and platelets to 70 social care hospitals have been investigated in the present study as Fig. 3. Costs, including transportation, maintenance, and production, are based on real data. Also, data such as demand, initial inventory, maximum production, vehicle capacity, and hospitals are generated according to hospital bed capacity as described below. Finally, the probabilities of the first, second and third scenarios are 0.3, 2.0, 0.5, and 0.2, respectively.

Geographical locations of hospitals and blood centers in Tehran, Iran. (Hospitals with yellow tags and blood center with red tag.)
Vehicle Capacity: 35% of total hospital bed capacity
Capacity of each hospital: 70% of the hospital’s bed capacity
Platelet demand for each hospital: for the first, second and third scenarios is between 4% and 8% of the hospital’s capacity, between 10% and 14% of the hospital bed capacity and between 16% and 20% of hospital bed capacity, respectively which is selected randomly.
Maximum Platelet Production: is randomly selected between 8% and 20% of the total bed capacity of the hospitals.
Platelet starting inventory in each period in blood center: is randomly selected between 5% and 10% of the total bed capacity of the hospitals, so that the inventory is 8% of the total inventory from the third age group and 2% of total inventory from the second age group.
Platelet starting inventory in each period in each hospital: is randomly selected, between 5% and 10% of the bed capacity of each hospital, so that the inventory from the third age group is 6% of the total inventory and inventory from the second age group is 4% of the total inventory.
Red blood cell demand: is randomly selected between the interval (a* e r ) % and (b* e r ) % of the hospital bed capacity. Where e r represents the percentage of r blood type in Iran. a and b are 5 and 10 for the first scenario, between 15 and 20 for the second scenario, and between 25 and 30 for the third scenario.
Red blood cell replenishment in the blood center: is randomly selected from the interval (c* e r ) % and (d* e r ) % of the hospital bed capacity. c and d are between 8 and 12 for the first scenario, between 18 and 22 for the second scenario, and between 28 and 32 for the third scenario.
RBC starting Inventory: is randomly selected from the interval between (5* e r ) % and (20* e r ) % of hospital bed capacity.
The age of blood products and the FIFO policy of uncertain consumption and demand for hospitals is considered in first model. Whereas in the second model, both demand and supply are uncertain and the model seeks to determine the best alternatives (supply of a blood group with compatible blood groups) and transfers between hospitals along with optimal delivery of blood products to hospitals
(Hospitals with yellow tags and blood center with red tag)
Table 2 displays the proposed replacement cost (cost of demand for a matched blood type). This cost is provided so that the cost of supplying each blood type to its blood group is assumed to be zero and a shortage of a blood type is firstly provided by the most commonly available blood group. Also, any blood type is initially used for resolving the shortage of a rare, matched blood type. For example, the cost of supplying the A + blood group with the matched blood groups of O +, O- and A- is 750, 6750 and 9000 USD, respectively, which makes the shortage of the A + blood group to be initially resolved by the O + with 36% frequency. If O + is not available, it is resolved by O- (4%) and if O- is not available, with it is resolved by A- with 3% frequency. Also, O + is initially used to eliminate the shortage of the blood group AB+(7%), then B + and eventually for A+(27%). The proposed algorithms have been programmed and implemented in Matlab 2014a environment for solving models. All computations are run on a computer system with a 2.6 GHz 5core I processor with 4 GB RAM.
Proposed cost of replacement (Tomans)
Both the first and the second models of the problem are validated by the GAMS software with the specification GAMS 24 with solver Cplex12.5. In this section, the first and second models are solved by the heuristic and meta-heuristic algorithm such as Adaptive Large Neighborhood Search Algorithm (according to Table 3 parameters) and the results obtained by these algorithms are compared mutually, and the results will be discussed at the end of the section.
Parameters used in the ALNS algorithm
The results obtained by the heuristic algorithm and ALNS are compared in this section. This comparison is provided in Table 4. As you can see, the heuristic algorithm outperforms the ALNS algorithm in terms of gap and time to solution.
Comparing the average results obtained with the heuristic algorithm and the ALNS algorithm for the first model
Comparing the average results obtained with the heuristic algorithm and the ALNS algorithm for the first model
As mentioned earlier, ω leads to a trade-off between the solution robustness and the model robustness. Generally, lower values of Ω lead to a lower solution robustness (closer to the optimal answer) and higher model robustness (farther than the feasible answer). When Ω increases, the solution robustness increases, while the model robustness decreases (closer to the feasible answer and farther away from the optimal answer). Figure 4 indicates the balance between the solution robustness (total cost) and the model robustness (under realization of demand or shortage) for 70 hospitals. As one can see, with a rise of Ω from 10,000 to 100,000 Tomans, the total cost increases to 818699891.5; so that the number of shortages is reduced to zero. A risk-averse decision maker chooses high values of Ω to completely avoid shortages; however, the risk-taker chooses low values of Ω to reduce their costs. In fact, any decision-maker can choose some of the Ω according to its degree of risk-appetite. The increase in λ causes the final answer to be more sensitive to changes in input data (Mulvey et al., 1975); so according to Lalmazloumian et al. [18], λ is considered equal to one in this study.

The trade-off between the model robustness and the solution robustness.
In this section, a comparison is made between the total cost, the number of shortages and the number of losses in two modes of transfusion and lack of transfusion between hospitals for 70 hospitals. For this purpose, the shortage cost is set at 70,000 Tomans. As shown in Figs. 5 and 6, the cost and number of shortage are far less than that in the transfusion mode than lack of transfusion. The results also show that the amount of waste is the same in the two cases and does not exceed the maximum planned loss. In fact, the transfusion has not helped to reduce waste and the application of FIFO policy has been investigated in two cases for consumption and production optimal policy leading to a lack of loss in periods other than the first period [17].

Comparison of the number of shortage in the two modes of transfusion and lack of transfusion between hospitals.
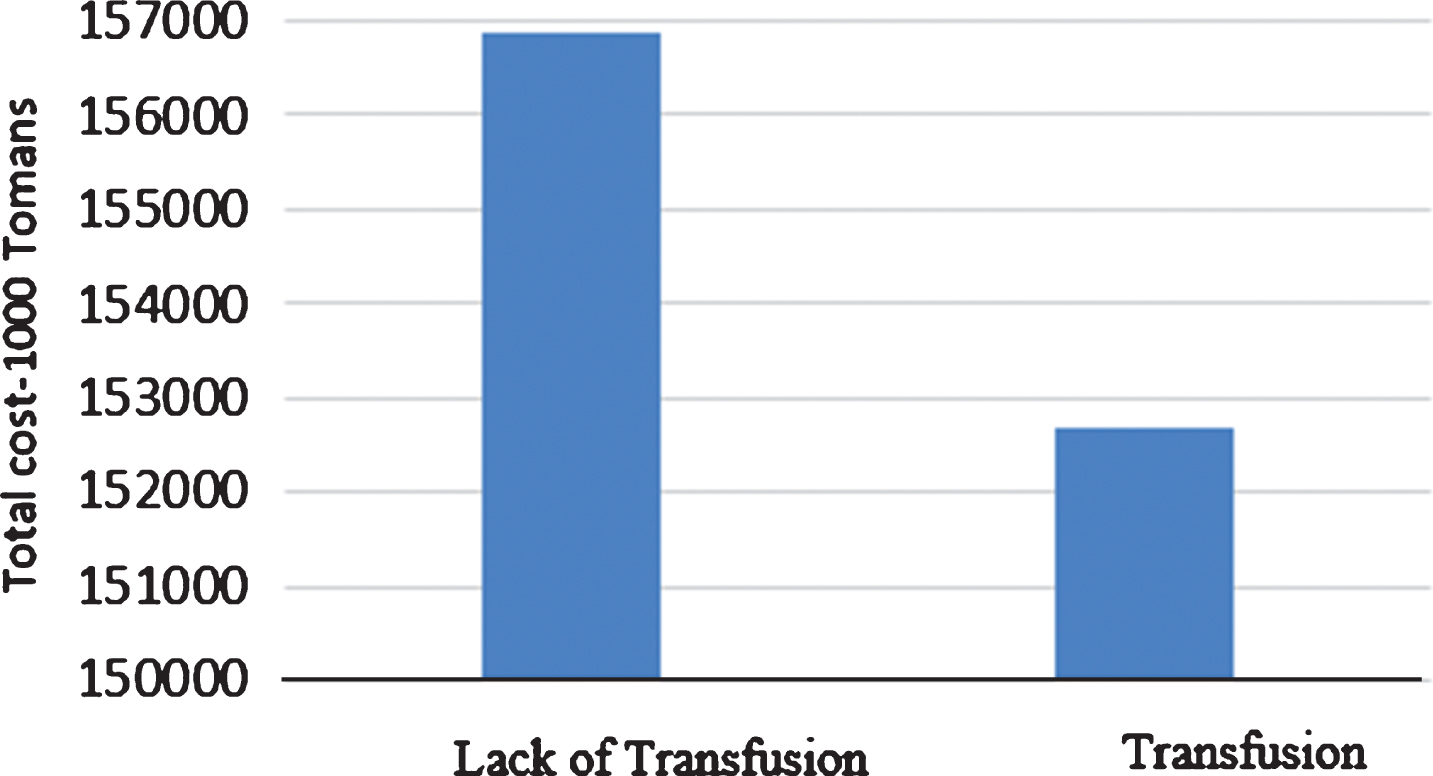
Comparison of total cost in two modes of transfusion and lack of transfusion between hospitals.
The comparison of the results obtained with the heuristic algorithm and the ALNS algorithm for the second model is presented in Table 5. As it is clear, the heuristic algorithm outperforms ALNS algorithm in all cases. It has only a few weaknesses in terms of the gap in examples with 10 hospitals.
Comparing the results obtained by the heuristic algorithm and the ALNS algorithm
Comparing the results obtained by the heuristic algorithm and the ALNS algorithm
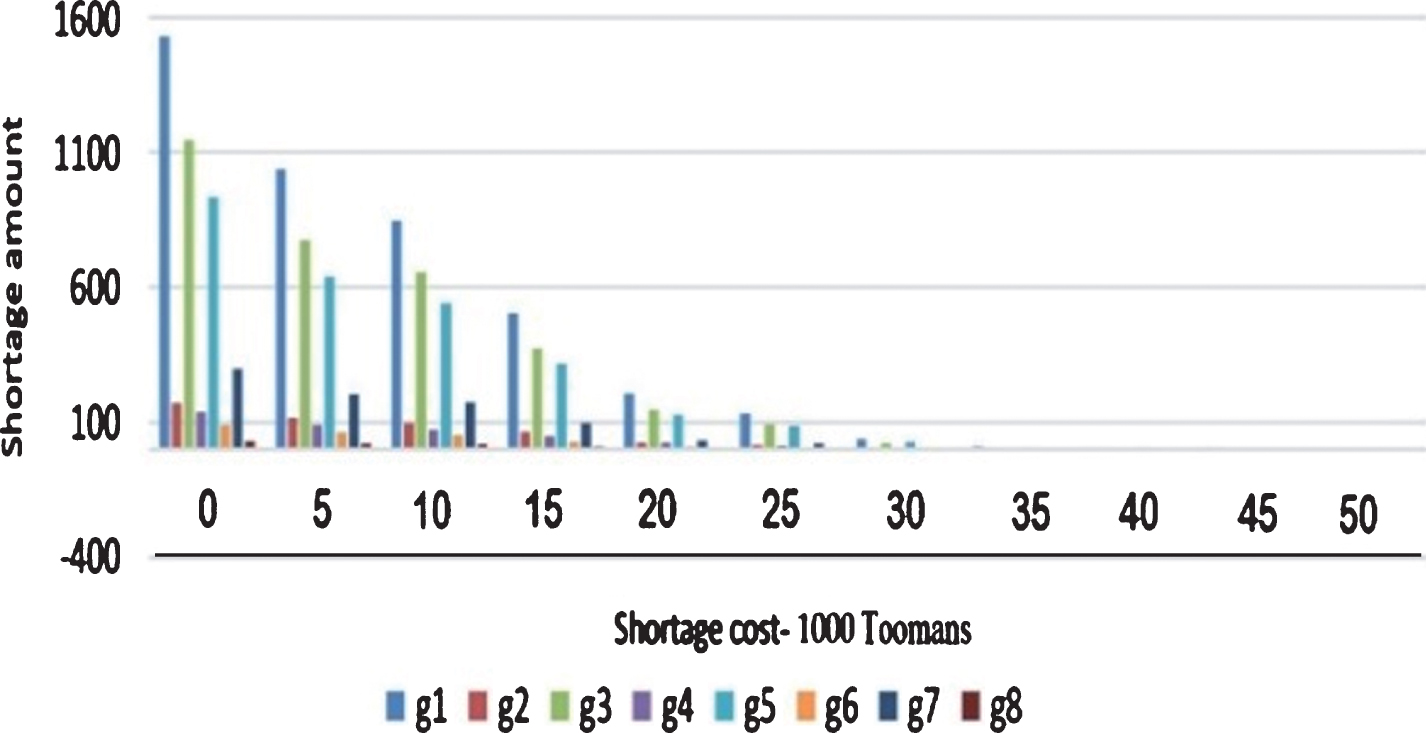
Based on the trade-off between the solution robustness (total cost) and the model robustness (under realization of demand or shortage) for 70 hospitals, it can be seen that with an increase of Ω from 0 to 50,000 Tomans, the total cost increases to 5042401719, so that the number of shortages is reduced to zero. The number of shortages from each blood group also reaches zero as shown in Fig. 7. Moreover, Figure 8 shows the Number of shortages from each blood type for shortage cost variations. A risk-averse decision maker chooses high values of Ω to completely avoid shortages; however, a risk-taker chooses low values of Ω to reduce his costs.

Trade-off between the solution robustness and the model robustness.
As mentioned earlier, three low, medium and high demand and supply scenarios with probabilities of 0.3, 0.5 and 0.2 (basic assumption) are considered, which allows for changing conditions, such as, changing the probability of scenarios. Furthermore, sensitivity analysis is conducted in this section to detect changes in results (total cost, shortage, vehicle value, direct delivery, transfer, replacement, and inventory level) in four modes of: 1) both transfusion and replacement, 2) only replacement, 3) only transfusion, and 4) neither replacement nor transfusion. To this end, replacements, transfusion, and both are eliminated from the model, respectively. It should be noted that only transfusion between hospitals are eliminated and direct transfusions from the blood center to hospitals are not eliminated. Also, Ω is adjusted at 40,000 Tomans for these comparisons. Also, four assumptions I, II, III and IV are considered for scenarios probabilities. In assumption I, all scenarios have the same probability of occurrence) p1 = p2 = p3 = 1/3. In assumptions II, III and IV, the highest probability (0.8) is assigned to the first, second and third scenarios, respectively and the remaining (two) scenarios have a probability of 0.1. The results of this sensitivity analysis are presented in Table 6.
Comparing the results in different assumptions and modes
Comparing the results in different assumptions and modes
As it is clear from the Table 6, the total cost in the first case where both replacement and transfusion are allowed is lower than other states in the mentioned assumptions. In general, in the absence of transfusion between hospitals, the total cost is higher than the one in which the transfusion is allowed. In fact, it can be concluded that transfusion helps reducing cost mostly through decreasing transportation costs than reducing replacements costs. Also, the total cost in assumption II (allocation of higher probability to the first scenario) is lower than all assumptions.
Regarding the usefulness of the transfusion and replacement in reducing the shortage, the transfusion is more important as is clear from the results. In fact, the replacement value in the basic assumptions I, II and III is very low and is not proposed by the model. However, when the probability of the third scenario increases (assumption VI), the replacement value is also increased and it is suggested that a replacement be made to reduce the shortage. That is, when the probability of high demand increases, it is suggested that a replacement be made to reduce the shortage.
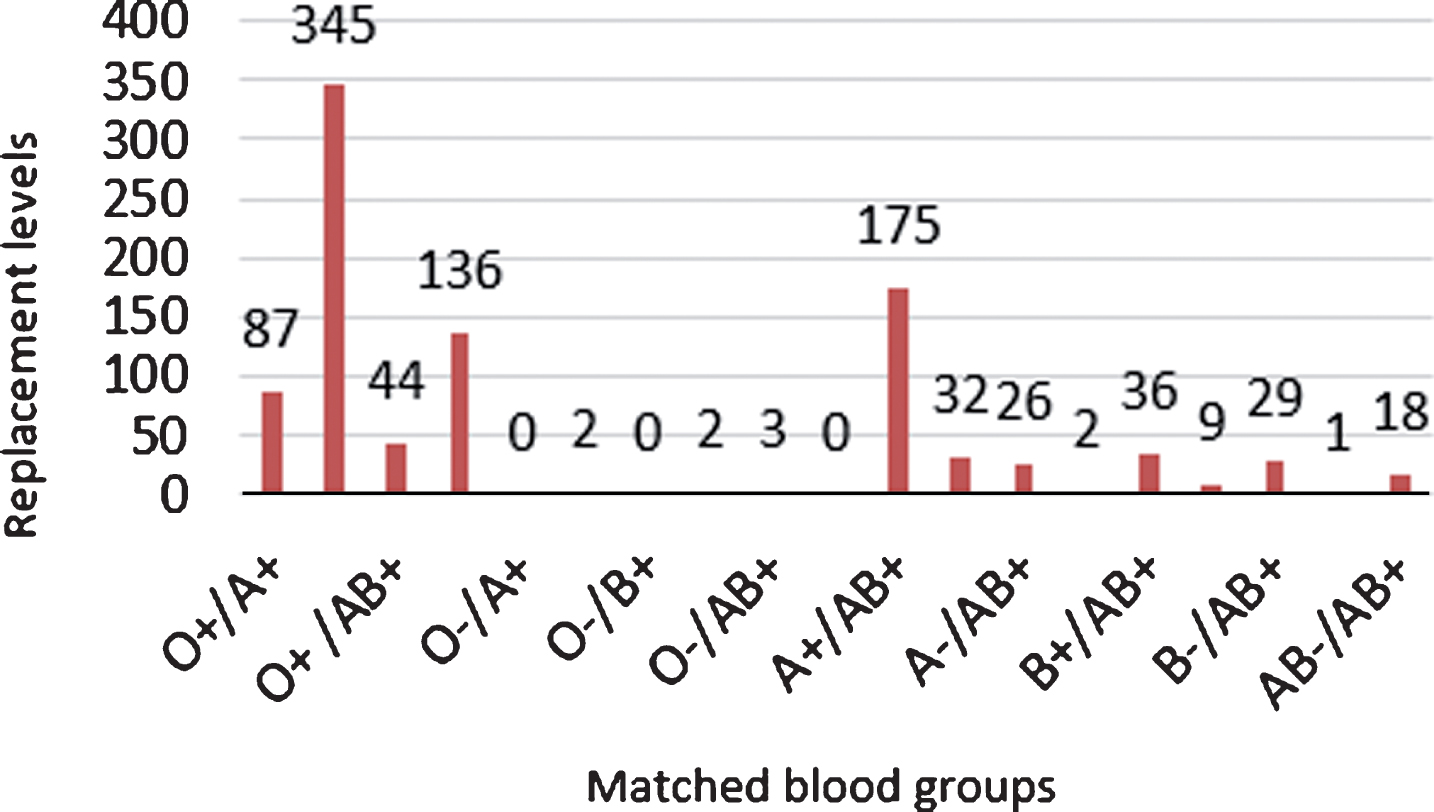
At the shortage cost of 40,000 Tomans, the shortage amount for basic assumptions I, II is less than 100 units, while it is very high under the VI and III assumptions. Also, the shortage cost for the VI assumption is increased to 100,000 Tomans, and it is observed that in order to reduce the shortage, the direct delivery, transfer, replacement and inventory levels of the blood center should increase to 8761, 8756.621, 946, and 6203 units. This is while the amount of vehicle and hospital inventory levels should be reduced to 4809 and 12313 units, respectively. Also in this case, the total cost will be 52,612,330 Tomans and the shortage will be 9 units. Figure 9 shows the replacement levels for matched blood groups for this assumption and shows the shortage cost of 100,000 units. As it is clear, most of replacements is related to the blood type O + (donator) and B + (receptor), followed by the blood group A+ (donator) and AB + (receptor).
Number of shortages from each blood type for shortage cost variations.
Replacement levels for matched blood groups.
The management of blood resources is a complex process because of its scarcity and limited longevity. In addition to imposing production, maintenance, transportation, and destruction costs, the waste of blood products will increase the likelihood of a shortage in the future. The loss has negative effects on the donors and the high rate of waste results in the loss of donors [23]. On the other hand, lack of available blood for donation can also lead to an increase in mortality rates, and thus leave a profound effect and excessive cost on society. These are only a few of numerous reasons that suggest a world-wide need for conducting research on this subject matter.
In the simplest and most commonly used way, minimizing overall vehicle use cost, in line with existing constraints, is the subject well studied under the vehicle routing paradigm. One of the most important, yet, challenging developments in the vehicle routing problem is the routing-inventory and inventory-routing integrated problem. It is difficult to solve these problems due to the separate nature of the routing problem and the production and inventory problem (flow network).
Two robust and flexible mathematical models for managing production, inventory and distribution of blood products are presented in the study. The first mathematical model is related to the production-routing-inventory integrated problem in a network, including a blood center, several hospitals with non-deterministic patient demand. The above-mentioned problem, in addition to managing production, inventory, and distribution planning, addresses the FIFO policy in hospitals as well as transfers between hospitals in order to deal with the uncertainty of patient demand.
In the second mathematical model, which is presented for the inventory-routing problem, both supply and demand are assumed to be uncertain, and the ability to replace blood groups and transfers between hospitals are incorporated into the model to avoid shortages. Minimizing production, maintenance, shortage, transfer and transportation costs is the objective in the first model and minimizing the cost of maintenance, shortage, transfer, transportation and replacement is the objective in the second model.
Finally, with a case study on Tehran’s blood transfusion services, the performance of the proposed models has been studied. The products examined are blood platelet and red blood cells in the first and second models, respectively. Two heuristic and Adaptive Large Neighborhood Search algorithms were suggested for solving models. According to the results, the heuristic algorithm significantly outperforms the Adaptive Large Neighborhood Search algorithm in both models. Hence, the heuristic algorithm for examining the transfusion and lack of transfusion state in the first problem, and the four modes of both transfusion and replacement, only replacement, only transfusion, and the lack of transfusion and replacement under different assumptions for the probability of scenarios in the second problem. Both algorithms can lead to cost reductions, and the transfusion greatly affects costs reduction due to reduced transportation costs. Also, in most cases, the transfusion was proposed to avoid shortages and the replacement rate was very low. However, in the event of a high demand, a replacement was also proposed to reduce the shortage. Applying the results of the research has led to increased demand supply and it has a significant impact on the shortage in the hospital. In the event that a hospital is unable to meet demand within a given period, the required amount of blood products from other hospitals associated with the hospital in question will be provided. This makes it possible to respond to demand in a shorter period of time and even at a lower cost and to avoid the high costs of occurring shortages. Due to the perishability of blood and the importance of supplying the demand for blood products, the disorder is one of the factors that need to be planned because the disruption in any of the centers or routes will reduced the ability to meet demand in different locations. Side blood transfusions between hospitals can prevent shortages in hospitals in cases where the blood center for whatever reason is unable to fully meet the needs of the hospitals or uncertainty in the daily demand of the hospitals may lead to disruption of previous forecasts and increases system flexibility to deal with uncertainty; This is especially true in urban and high-traffic areas where hospitals are close to each other and blood centers are far from some hospitals. Considering the return of unused products from hospitals to the blood center, incorporating the routing for transfusions between hospitals over a period of time, including time window for delivering the perishable product to a hospital, and considering the demand for an undetermined blood type in the emergency conditions are among the recommendations made for future research.