
Abstract
Nowadays, the crime rate increases dramatically in every country. Therefore, it is an urgent need for governments and social associations to produce persistent solutions and disincentive penalties to prevent crime issues. Specifically, social media plays an important role in crime rate detection; thus, reducing crime rates significantly. It would be a good medium for the desired task. In this paper, we analyze Twitter data collected from Twitter accounts for seven different locations (Ghaziabad, Chennai, Bangaluru, Chandigarh, Jammu, Gujarat, and Hyderabad) from January 2014 to November 2018 in a case study of India, which is opted to illustrate the efficiency of the proposed work. Sentiment analysis has been used to analyze users’ behavior and psychology through the tweets of people to track crime actions. Twitter part-of-speech tagger, which is a Markov Model of first-order entropy, has been used for part-of-speech in online conversational text. Brown clustering is used for a long set of unlabeled tweets. Comparisons are verified with real crime rates from an authorized source of information according to different locations. We also measure the latest crime trends for the highest (Ghaziabad, Uttar Pradesh) and lowest crime cities (Jammu) in India. It has been found that the latest crime trends have been recorded for the time duration of 7 days (23, January 2019 to 30, January 2019). The analyses demonstrate that the obtained results match with the real crime rate data. We believe that these types of studies will help to detect the real-time crime rate for different locations and detect the crime pattern easily.
Introduction
Criminal activities dramatically increase in every country’s years by years. Strong measures are required for prevention of these criminal activities. Crime rate detection plays a vital role in monitoring these criminal activities and improving public safety. Social media are useful for crime rate detection at different locations in any country, and therefore crime rates can be decreased significantly. Social media are not only a communication tool but also a source of information [1, 2]. Twitter is a good candidate for data analysis with more than 300 million peoples [3]. Users share their feelings, ideas, emotions, and anger on this social media platform. However, it is not easy to extract information from Twitter for crime detection because the Tweets are the intension of users. A Tweet can be a symbol or in other formats. Due to these issues, each Tweet should be analyzed carefully [4].
Researchers have used the social media data to detect or predict the crime by using vicinity of past crime [5], to detect crime by using statistical topic modelling across a city in US [4], to identify the profile of high rank criminals [6], to track the attractiveness of the actors [7], to predict about the election results [8] and to detect high repute profiles [9]. In [10], several online large social networks were analyzed. In [11], a self-exciting point process for the modelling of crime was presented. In [12], a hybrid model was proposed for understanding the actual crime data of Virginia. Goswami et al. [13] performed a survey on the detection of events on social media, which are helpful for the detection of natural disasters. Bosque et al. [14] presented several techniques to predict rude comments on social media. Egele et al. [9] explored how similar techniques can be used to recognize the compromises of some high repute profiles that show consistent behavior. Social media were used for surveys on different emotion frameworks, emotion detection [15] and issues faced due to short text [16]. In [17], events correlation in tweets has been done by using singular value decomposition (SVD). Review analyses have been performed for understanding challenges in collecting data from social media and some advance tools to address these challenges [4, 18–22].
Even though the related works used social media to detect the crime rate; yet they ignored the collected data from authorized security agencies; thus, this would impact the performance of tracking. This raises the motivation for this research, which leads to the objective of this paper for detecting the crime rate by different locations using the collected data from social media.
We have three important goals: (I) Extract the information from twitter by recording tweets of users; (II) Get location-based real-time crime data from security agencies; (III) Make a comparative analysis between Twitter data and real crime data.
Few sensitive keywords directly related to the crime such as Criminal, Rape, Murder, and Attack are used to collect the data from a social media site. 3801 tweets are filtered out from a large number of tweets and used as datasets for the study. The filtering process is applied for a large number of tweets by using keywords in the 4-year period. The data clearing process has been done to eliminate the non-alphanumeric characters [20]. Rate of cognizable crimes has also been collected from the security agencies, and a comparison between the datasheet generated from Twitter data and the real crime data received from security units are also a significant part of our study.
The meaning of Twitter data is the number of Tweets recorded from Twitter using different keywords such as Murder’, ‘Crime’, ‘Encounter’, ‘Hit and Run’, ‘Rape’ and ‘Fight’ for seven determined locations (Ghaziabad, Chennai, Bangaluru, Chandigarh, Jammu, Gujarat, and Hyderabad) of India for the duration from January 2014 to November 2018. Using this analysis, 3801 Tweets were collected and saved to the database. The real crime data for the determined locations were collected from the security agencies (i.e. National Crime Records Bureau, http://ncrb.gov.in/), which are useful to check the accuracy of the present research.
Many researchers are working in different domains of social network, and many models have been proposed for predicting the rank of the users according to their social media account [32]. Centrality measures and network topology have been investigated [33]. Some approaches such as random-walk-based or diffusion-based algorithms have been established for ranking of social media nodes [34].
For measuring the influence of users on Twitter, Leavit et al. [35] used four different features such as retweets, replies and mentions for measuring the influence on Twitter. Other side, Cha et al. [36] discussed about the influences in Twitter such as retweets influence, indegree influence and user’s mentions. The approach has been computed for 6 million users. For assessing the influence of users, belief function theory in weighted networks has been discussed [37]. It is the first time that the belief function was used for assessing of the influence of users on the Twitter network.
In this research, we perform the following steps for crime rate detection using social media.
-
This paper is the sum of three sections, out of which the first section is the introduction. Section 2 discusses materials and methods. This section has been including data cleaning and data collection procedures. In Section 3, Highest and Lowest crime rates representation using Twitter data and real crime data have been discussed. Rank Wise Comparative analysis and the latest crime trend are also part of Section 3. In Section 3, summarized critical evaluation of related works has been discussed in Table 8. Conclusion and future works have been included in Section 4.
Materials and methods
Data collection
Twitter data collection
The collection of data from Twitter accounts has been done from January 2014 to November 2018 by scrolling the search outputs for different accounts of seven locations (Ghaziabad, Chennai, Bangaluru, Chandigarh, Jammu, Gujarat, and Hyderabad) of India. The latitude and longitude are given for the considering locations in Table 1 (extracted from Google Map Online). 3801 tweets were collected and saved to the database. We find keywords on social media sites that match keywords and record these matched patterns. This is a word tagging operation. The identification of keywords is very significant in our analysis. Therefore, we determine the words which are directly related to the crime. The following keywords are selected for the analysis of crime rate by using social media as follows: ‘Murder’, ‘Crime’, ‘Encounter’, ‘Hit and Run’, ‘Rape’, ‘Fight’. 999 tweets are filtered for the first location. The keyword “fight” is a topmost word shared by the number of users on Twitter. In the second location, keyword “crime” is widely used by the users. The number of tweets collected for the seven crime cities is shown in Table 2.
Seven different crime locations in India
Seven different crime locations in India
Numbers of tweets collected for the seven crime cities
The reason to consider these seven locations for the study is because these locations are located in the most popular Indian states for International and Domestic Tourist and the security for Domestic and international tourist is the major concern for Indian Government. According to the report of National Crime Records Bureau, out of these seven locations, 5 locations (Ghaziabad, Chennai, Bangaluru, Gujarat, and Hyderabad) are located in the top most crime rate states in India.
Twitter API is also the part of study for the verification of the proposed approach, we measure the latest crime trends for the highest (Ghaziabad, Uttar Pradesh) and lowest crime cities (Jammu) in India. The measurement of the latest crime trends has been recorded for the time duration of 7 days (23, January 2019-30, January 2019) by using TAGS v6.1.
Handling crime records is important for detecting and preventing crime in any country. Years by years, Indian police is involving in many new approaches for improving the efficiency of crime records system. In 1985, Indian Government constitutes a new task force to maintain the crime records for different locations in India and after the task force recommendations, Indian Government constituted the National Crime Records Bureau (NCRB).
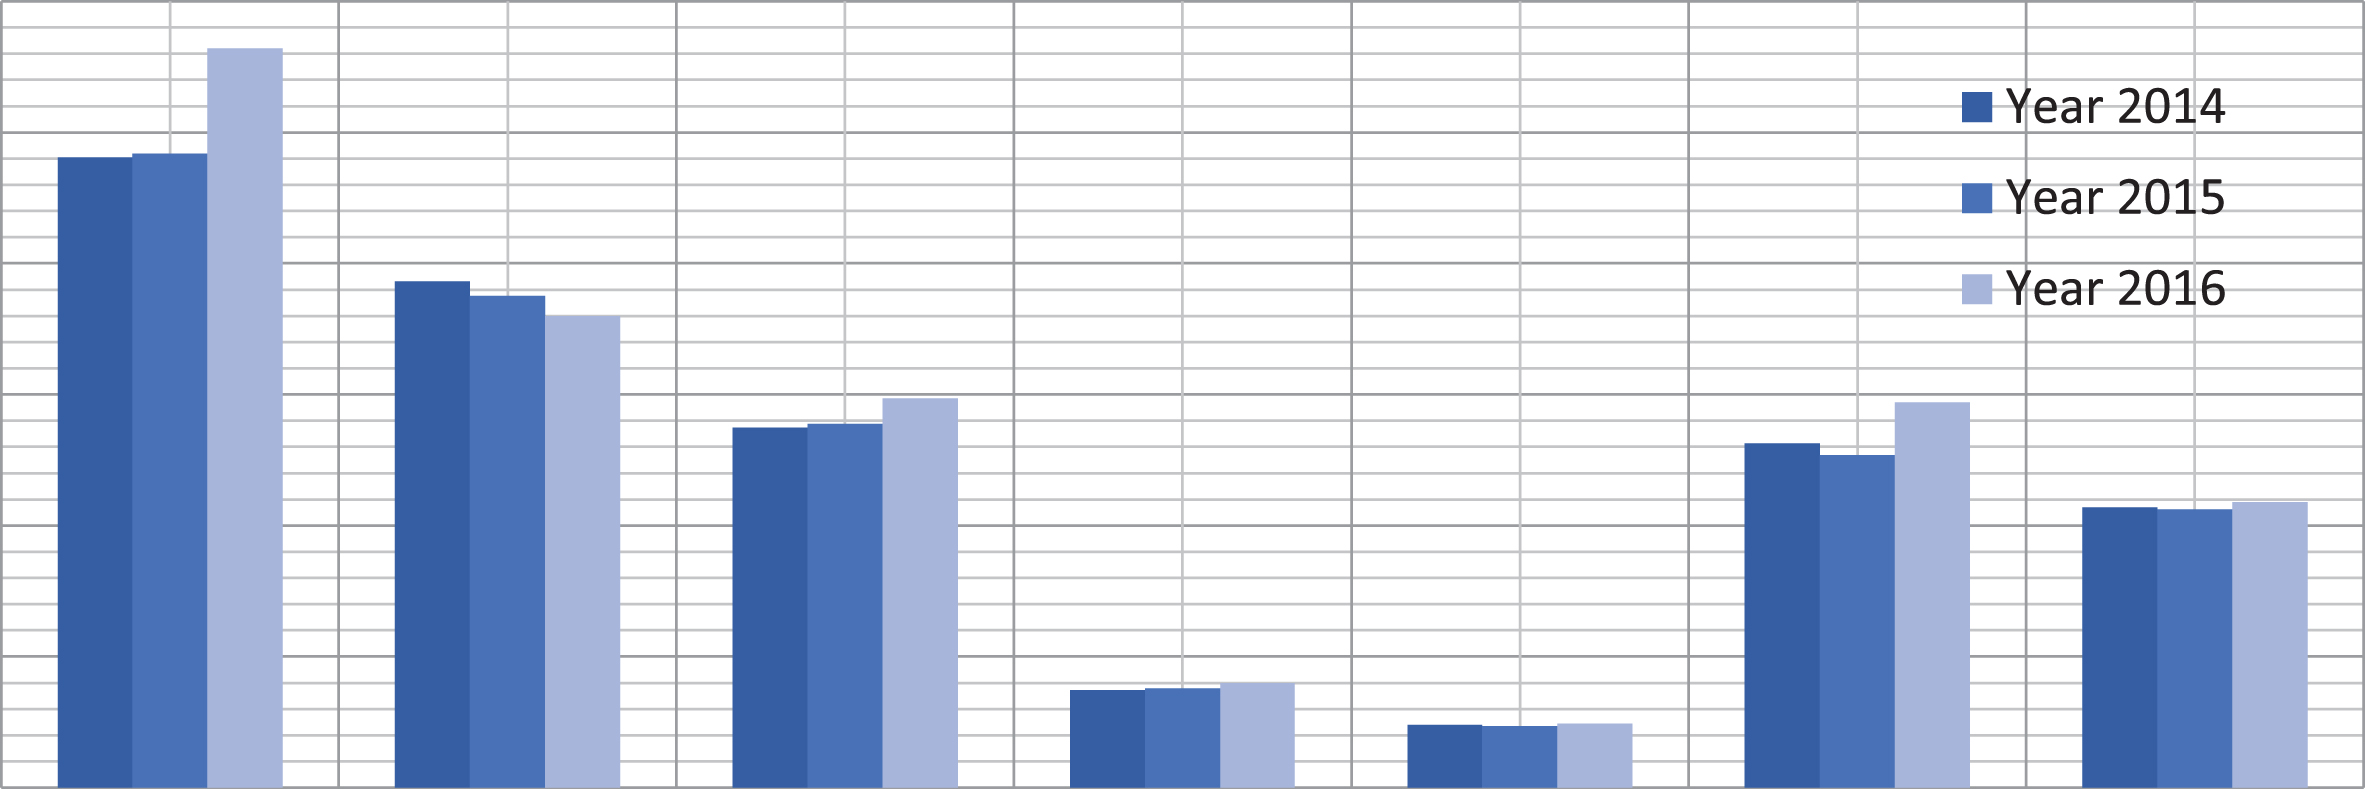
NCRB records are useful for collection of real crime data for the determined locations. The real crime data for the determined locations were collected from the security agencies which are useful to check the accuracy of the present research. Real crime data for seven cities are shown in Table 3 for 2014, 2015 and 2016. Combined datasets of Tweets collected and crime according to NCRB can be shown in Table 4.
Real crime data collected for seven crime cities
Real crime data collected for seven crime cities
Combined dataset of tweets collected and NCRB crimes
Figure 1 presents the proposed model which is the combination of three different steps.
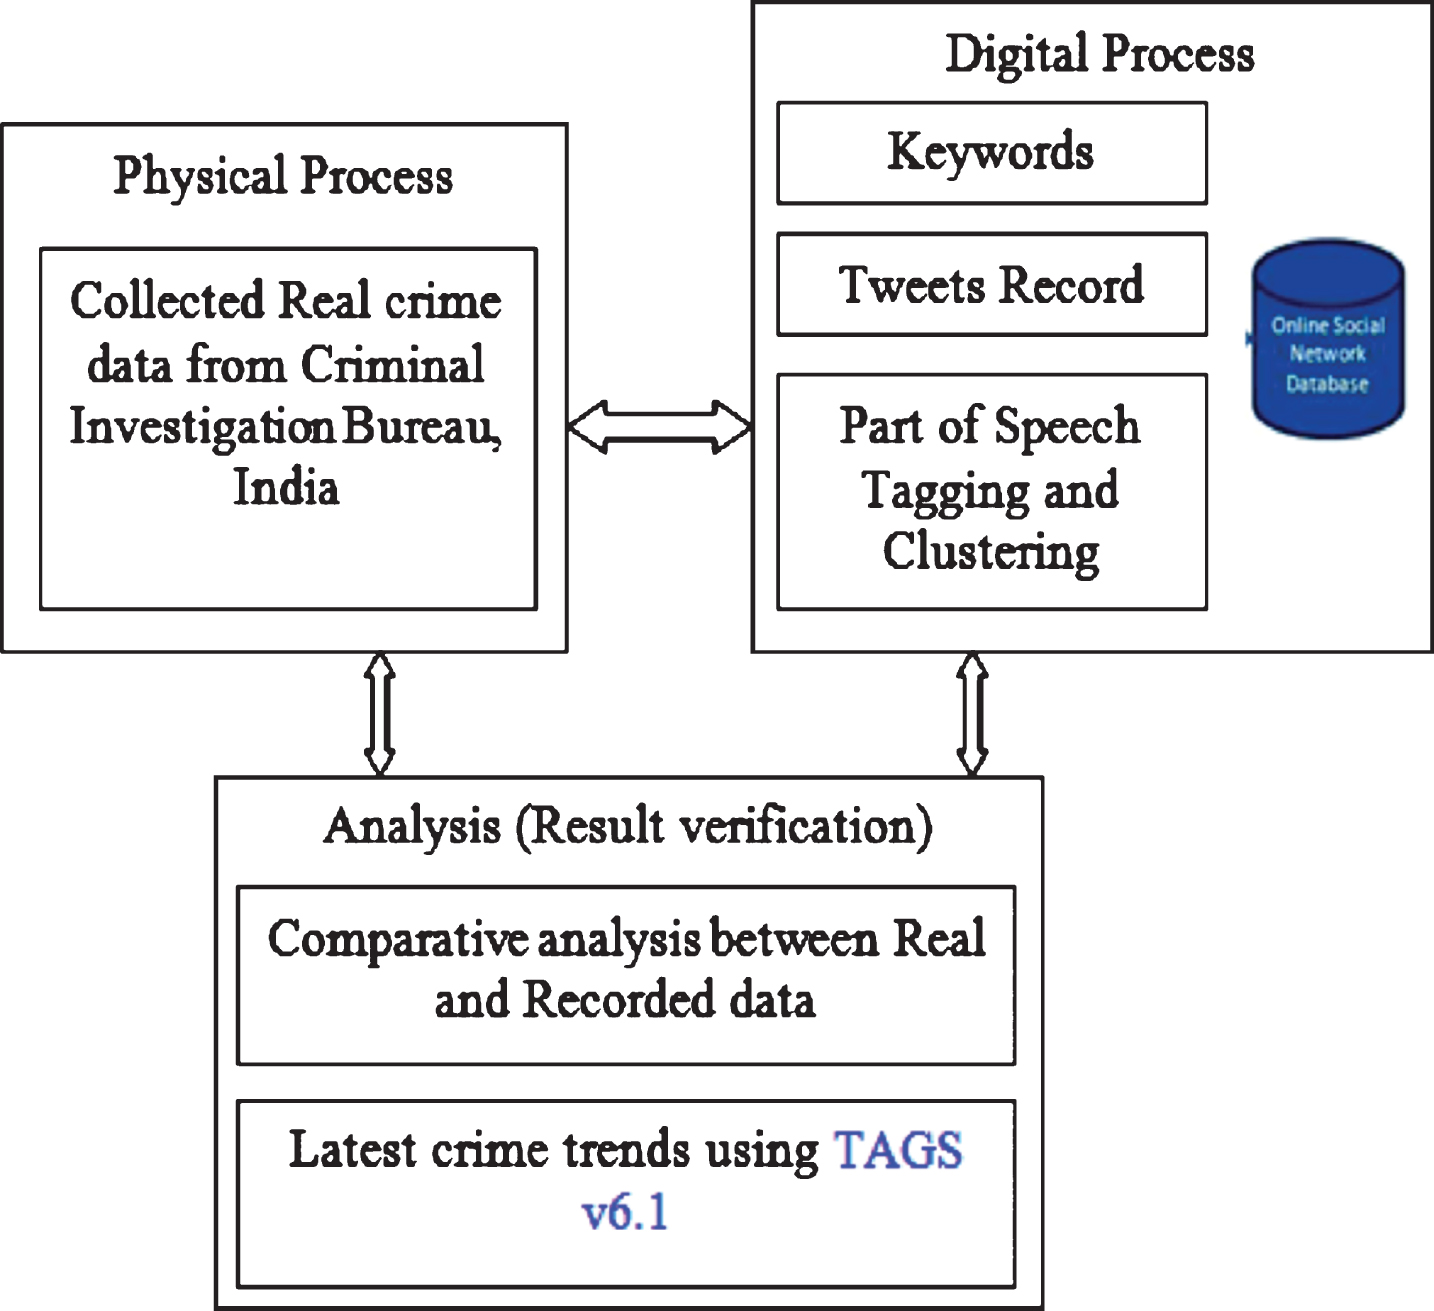
Proposed crime detection model.
In the first step, data are collected from several Tweets shared by users performed by using keywords. This process brings a large number of tweets; therefore, manual filtering process should be applied to extract the useful tweets out of them. Here, approximately four thousand tweets are recorded and filtered out.
In the second step, the real crime data for the determined locations were collected from the security agencies in three years.
In the third step, a comparative analysis is performed between the recorded and real crime data. In what follows, we describe the whole model in detail.
The data labeling process is to read Tweets carefully and try to extract the required information. The data sharing on Twitter is useful for detecting many facts to predict the election results, to predict the weather for any location, to track high profiles and also to predict the stars’ publicity. Here, we perform this operation to detect the crime rate. Few of recorded tweets that show the criminal activity performed at different locations are given below for instance:
“Jammu and Kashmir: Encounter breaks out between terrorists and security forces in#shopian”
The post shows that an encounter is going on between the terrorists and security forces in Jammu and Kashmir.
“2 accused were arrested today in connection with gang rape of a Russian national on 26th Nov in Manali. They were produced before Court.”
In the above post, twitter user shares the information about the “Rape” case of a Russian Lady in Manali.
Data tagging
The part-of-speech is a major problem in the online conversational text. Here, we use large-scale unsupervised word clustering and new lexical features to make our research more accurate. In [20], the authors released a new version of datasets that helps to solve the problem of part-of-speech in online conversational text. These clusters and annotation guidelines are available at http://www.ark.cs.cmu.edu/TweetNLP. By using these features, we can achieve state-of-the-art tagging results on twitter tasks [20]. As known, the tweets are the sentiments or intentions of people. Sometimes, they use some non-alphanumeric characters while typing these tweets. Indeed, these characters need to be eliminated or removed. To solve this issue, we use a new Twitter part-of-speech tagger building proposed by Olutobi et al. [23].
Tagger
This tagging model is a Markov Model of first order entropy. Decoding and training are extremely efficient for this model [24]. The tag probability is y
t
that is conditioned to the input sequence x and yt - 1.
The transition features used for each label pair and base observation features are extracted from token t and neighboring tokens. A Viterbi algorithm {O (|x| K2)} is used for prediction [25]. Here, K is the number of tags. For t = 1... |x| :
In training, for a tagged tweet (x, y), the model is the summation over the y
t
(observed token tags), each condition on observed previous tags and the tweets being tagged.
The parameters L1-capable variant of L-BFGS and β [26, 27] are optimized:
The number of tokens and total ranges over tagged tweets (x, y) are represented by the N. Elastic net regularization of [28] here is the combination of L1 and L2 penalties, note that j corresponds to the indexes over the features.
Finally, to eliminate noisy or irrelevant features, a small value of L1 penalty should be used.
Basically, a linear transformation Y = BX is generated from X⟶Y with help of non-singular matrix B.
Jacobian of Transformation
Now, based on two types of orthogonal matrix, the approach of transformation will take two forms.
Such that sub-matrices are orthogonal to each other, but they are not orthogonal by themselves. According to equation (8), transformation is rewritten as,
Equation (10) shows the transformation with n number of splits of quadratic forms in exclusive subset of the new variables. When B is fully orthogonal and each row is orthogonal to every other row, then splitting occurs fully.
Let Q be a Quadratic form in n variable, and it is a set of n-dimensional data to be clustered, x1, x2, …, x
n
is a homogeneous quadratic function of the variables. Such that
Assume that D is a hypercube and also assume that all data point x
j
(1 ≤ j ≤ q) belong to D. Therefore,
Each interval [s
i
, t
i
] is split into length of l
i
. Therefore, total number of intervals is P
i
. The partition of each [s
i
, t
i
] is defined as
This strips over the domain D. Each slice P
r
(1 ≤ r ≤ p) is defined as:
The centroid of each slice P
r
is an n-dimensional data point x
r
.
The partition P points x r (1 ≤ r ≤ p) defined set Was a sampling data space in a discrete fashion. Every initial data point x j (1 ≤ j ≤ k) belongs to one slice of the domain D, and the data is connected with centroid of this slice. Thus, each data is connected with one point of W.
The clustering method is obtained via Brown clustering [29] for a long set of unlabeled tweets. This algorithm divides words into a set of 1000 clusters. Brown clustering generates effective features in addition to that it provides variants that are much better than some other older models and comparisons according to the study in [30]. Therefore, this algorithm makes easier to scale a big amount of data. Let us see an example:
Here, A1 represents the same cluster, in which few challenging twts are given. A1 Cluster represents the word “not”, A2 cluster represents the word “you” and A3 cluster is used for the word “who”. By using this approach, challenging words can be easily modified and used for our analysis. Note that, sometimes, users can use some acronyms like “prbly” that represents the “probably”. These kinds of acronyms can be decoded by using this clustering approach.
Table 5 shows an example of paths for clusters that can be used for most frequent words. Here, the cluster path B1 shows the string of some challenging words, B1 represents the cluster for the word “always”. Another cluster B2 represents the word “gone”, B3 corresponds to the word “who” and finally B4 indicates the word “I”. This approach is very useful for sorting the challenging words and creating a set of data for our analysis.
Clusters for twitter words
Clusters for twitter words
As known, the tweets are the sentiments or intensions of people [31]. Sometimes, they use some non-alphanumeric characters while typing these tweets. Thus, these characters need to be eliminated or removed. To accomplish data cleaning process, the following steps are playing an important role.
We convert these tweets to lower case letters and then use them at our database. Some examples of these tweets are shown in Table 6.
Some Tweet examples
Some Tweet examples
For data cleaning process, the stop words (such as so, is, its etc.) need to be removed from the recorded tweets. Some examples of these tweets are shown in Table 6.
As it is in notice that many social media users mostly used the abbreviations in their tweets instead of full meaning. These abbreviations have to be clearly explained for data cleaning process. Some examples of these tweets are shown in Table 6.
Data clustering is very necessary to clean the data recorded from social media. Clustering method has been explained in section 2.2.6. Some examples of these tweets are shown in Table 5.
For the data cleaning process, emojis and special character have to be removed from the recorded tweets. Some examples of these tweets are shown in Table 6.
This converting process provides us to obtain an authentic and accurate data sheet. Thus, by using the same methodology, the data can be collected for different locations and used for a comparative analysis with the real crime data for different locations.
The numbers of tweets that are collected from the seven crime cities are shown in Fig. 2 where the horizontal axis represents the seven crime cities in India and the collected numbers of tweets are given with the vertical axis. We also analyze these seven cities according to their highest and lowest crime rates by using the collected number of tweets. The high crime intensity is labeled in Fig. 3. According to our analysis, Ghaziabad has the highest crime intensity as expected because having a very high population of around 2.7736 million and also a second greatest industrial city in Uttar Pradesh, India (http://indiapopulation2018.in). Contrary to this, Jammu has the lowest crime rate because having a population around 783,317. The density of Jammu city is 596 persons per square kilometers. Our observations demonstrate that, when the number of people increases in a city, the crime possibility increases dramatically as expected.
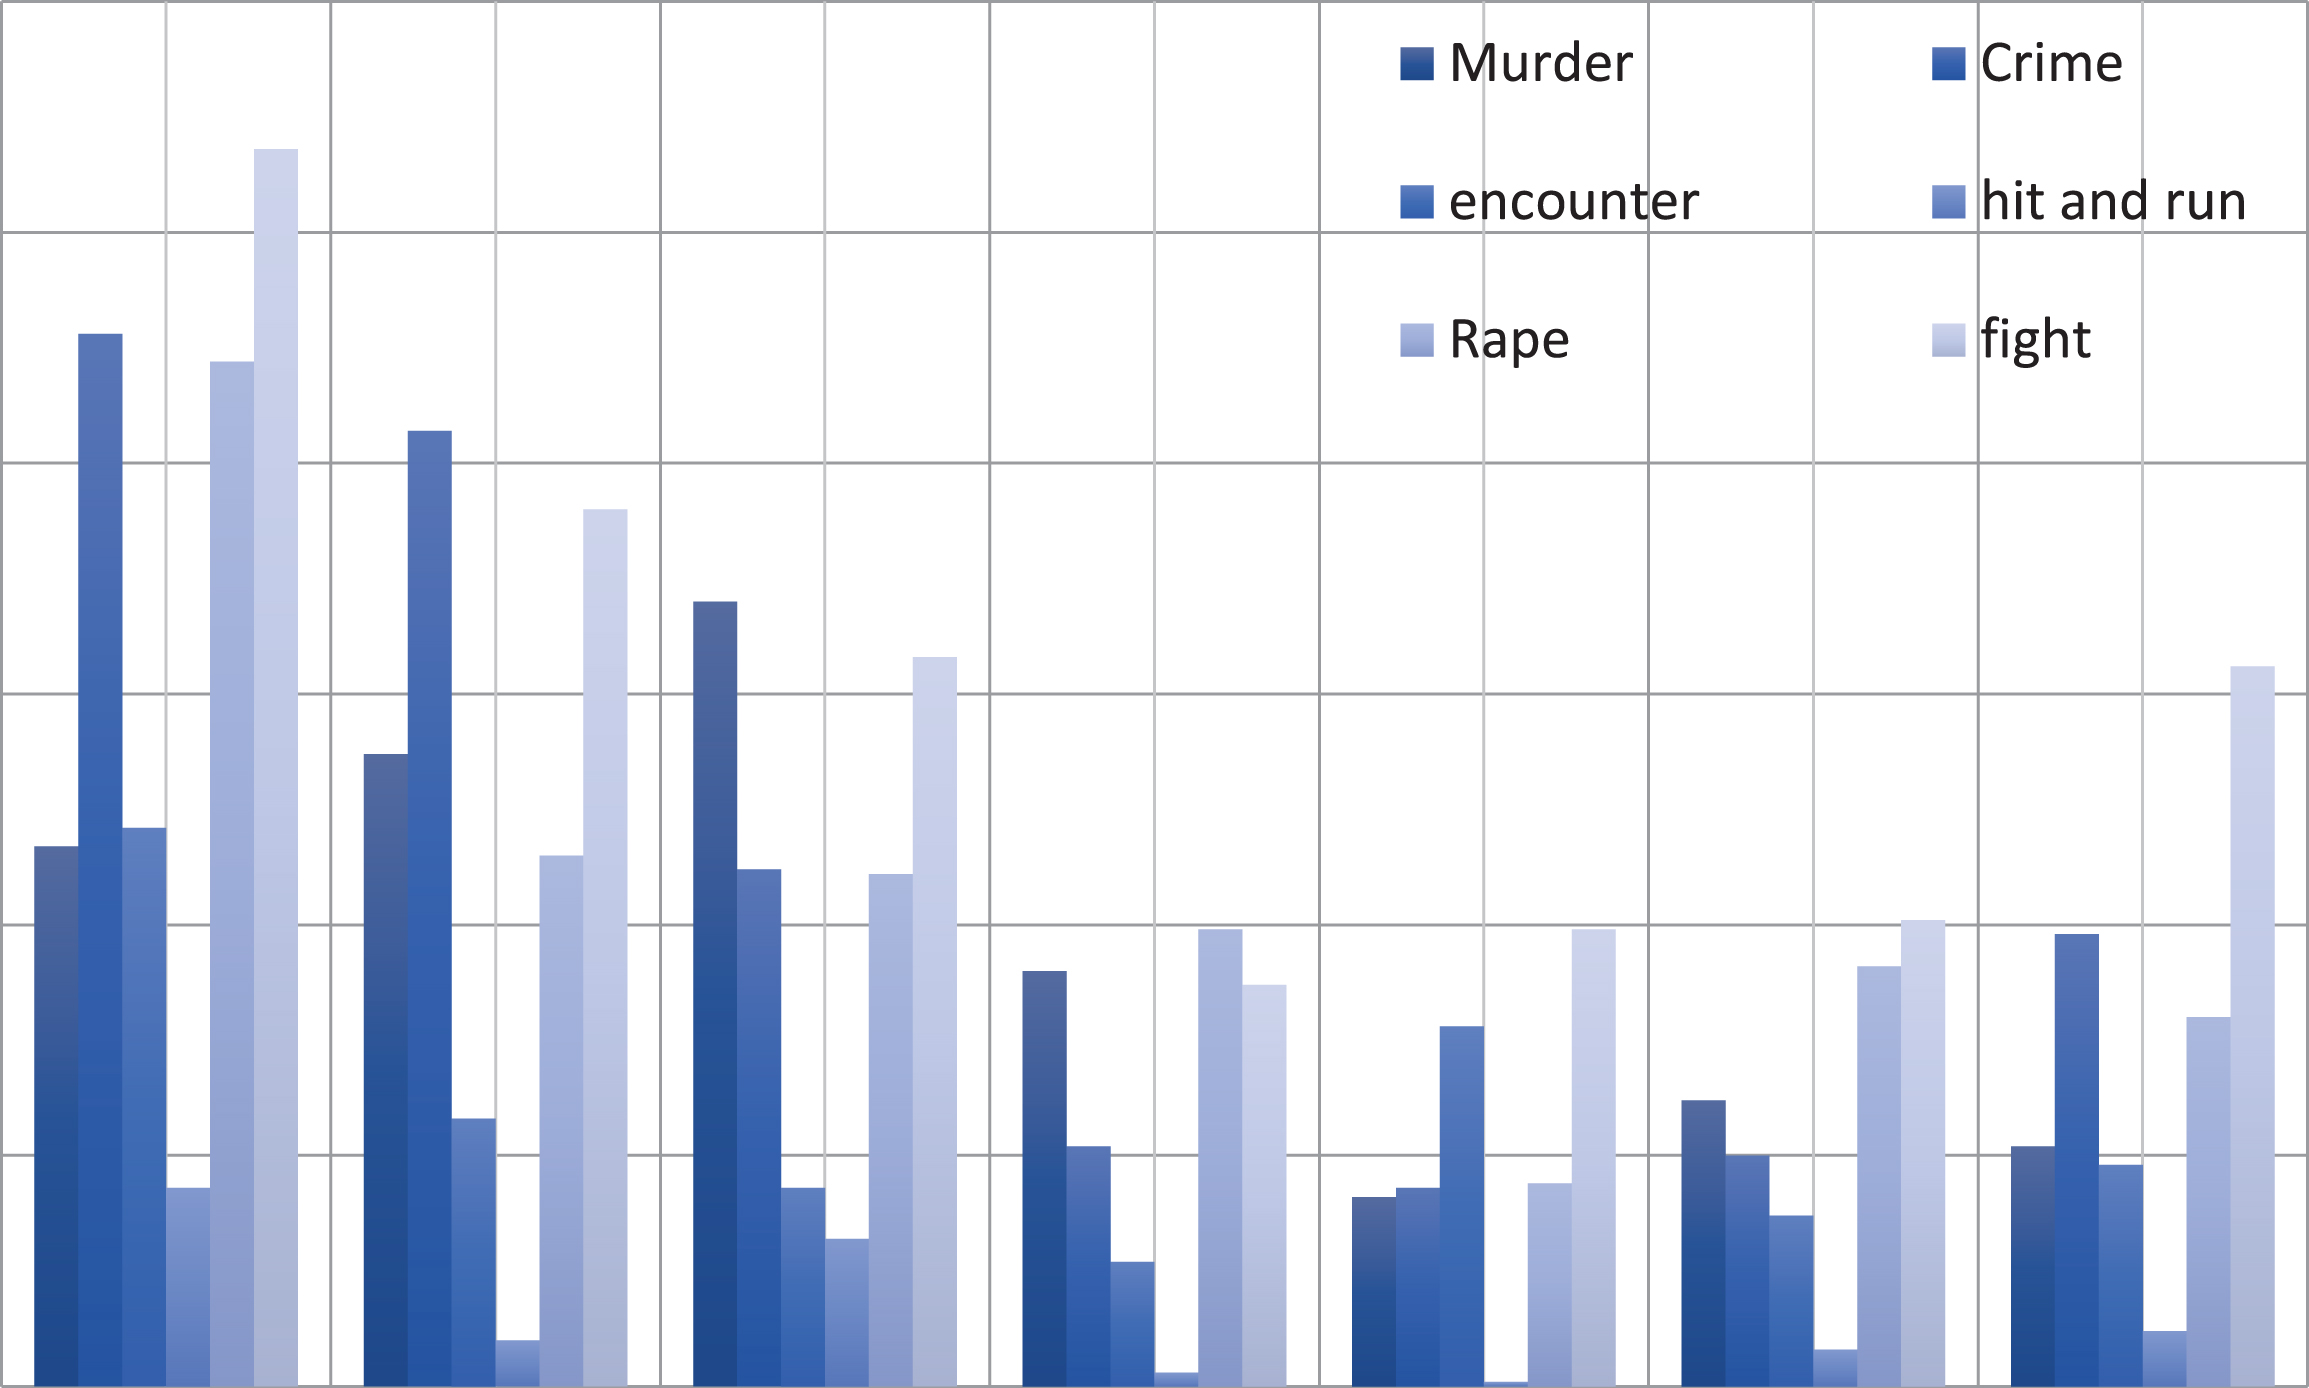
Bar chart representation for the tweets collected.
Highest and lowest crime rates representation using Twitter data.
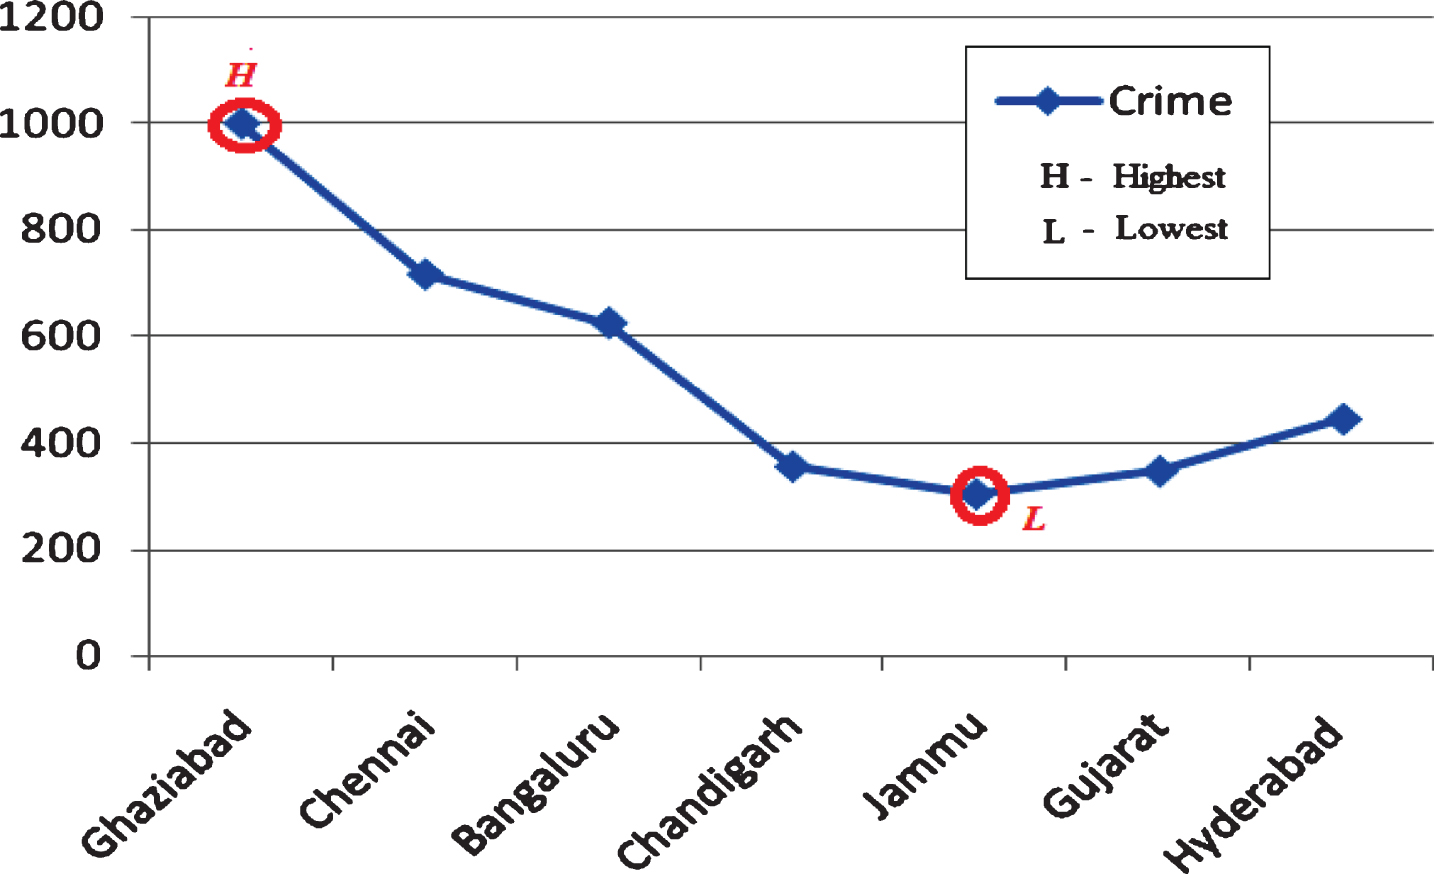
Other graphs in Figs. 4 and 5 show the real crime rate for the seven determined locations. In Fig. 4, the horizontal axis represents the seven crime cities in India. The obtained real crime data from security units are shown with the vertical axis. We also analyze these seven cities according to their highest and lowest crime rates. According to our real data analyzes, it is obtained from Fig. 5 that Ghaziabad has the highest crime intensity and Jammu has the lowest one. Final analyses establish that the results obtained from collected tweets approximately overlap with the results of real crime data gathered from security forces. Further comparative analyses and discussions are given in the following subsection.
Highest and lowest real crime rates representation.
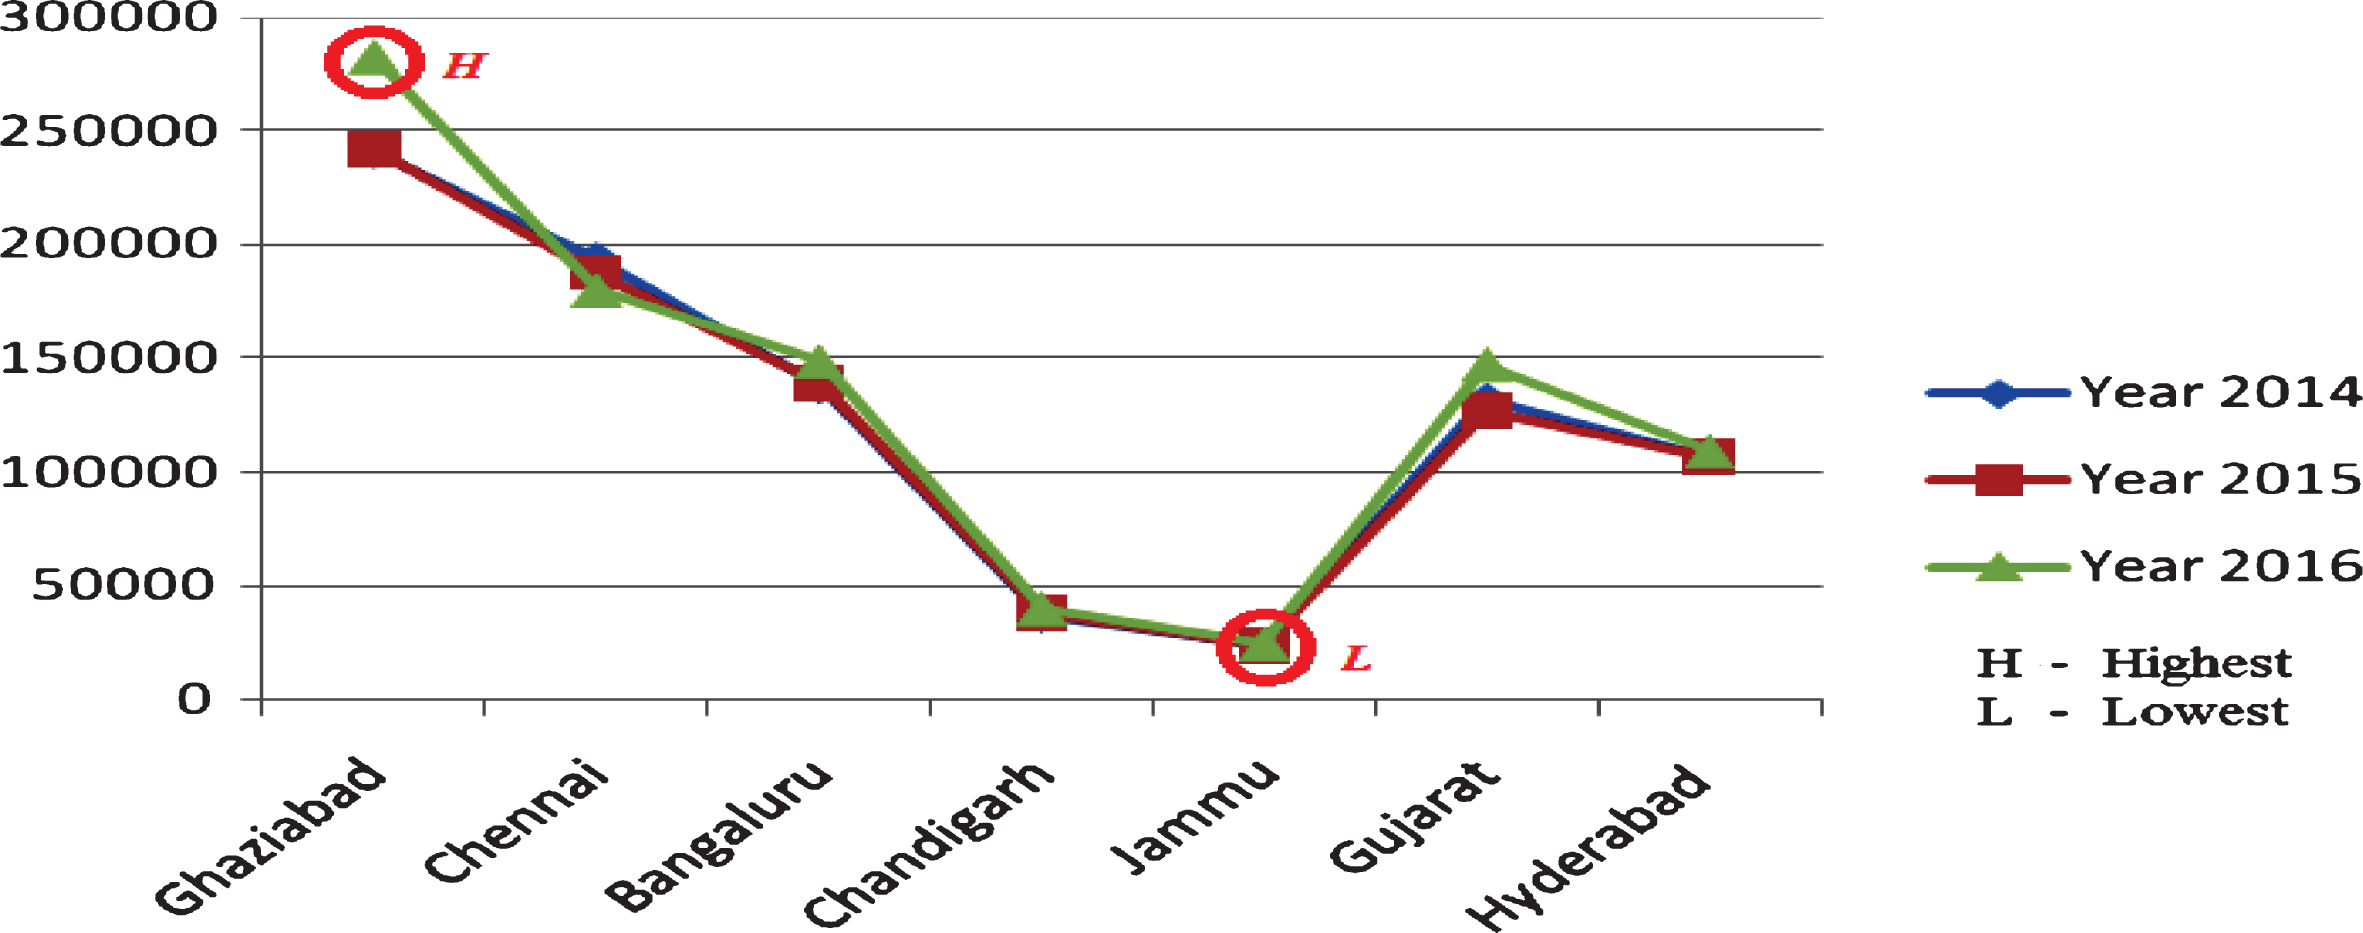
Highest and lowest crime rates representation using real crime data.
In what follows, we make comparisons between the datasheet generated from twitter data and the real crime data received from security units. The objectives of this section are to verify the calculated crime rate obtained from twitter data with the real crime values and to demonstrate that social media can be a good option to detect the crime rate for any city.
After analyzing Figs. 3 and 5, the results show that the highest and lowest crime cities are the same. As per the graph shown in Fig. 3, Ghaziabad is the highest and Jammu is the lowest crime city in India. This result is very significant for security operations because having the knowledge and verified predictions about the highest crime city in a country is important while preventing and foreseeing the crime events. These types of verified social media analyzes as obtained in this paper can also help to predict future crime rates in that city or in any city for taking measures about future crime events. In addition, our study can provide security units to obtain verified statistical outcomes about social media applications such as twitter. It can provide some verified records for cybercrime units for monitoring and detecting cybercriminals. In social media, tagged social media accounts and people can be caught by the proposed method presented in this paper.
This part assigns the rank to the cities according to their crime intensity. This rank assignment process will provide a reliable analysis. The rank-based comparison between Twitter data and real crime data is presented in Table 7. By using this rank-based comparison, we can verify that our proposed framework is working correctly or not.
Comparison analysis based on rank
Comparison analysis based on rank
The rank-based analysis demonstrates that the top three highest crime cities and lowest crime city are having the same rank in real crime data and twitter data. On the other hand, the ranks for Chandigarh, Gujarat and Hyderabad are different ranks at both of them. For instance, Chandigarh is the 5th crime city according to the twitter data but it has 6th place in real crime data. It is an acceptable issue that can be solved by improving the filters that are used in tweet filtering process, increasing the collected number of tweets, enhaing the data analyze methods, improving the expression detection process, using natural language processing methods, using error correction methods for obtained data via comparing the collected data with real data, using further statistical analyze methods, using new generation machine learning approaches and utilizing deep learning approaches. Here, the most significant thing is to detect the cities which have the highest crime intensity and lowest crime intensity.
Thus, we approximately obtain 70% accuracy at detection. Here the most significant point is detecting the cities that have the highest and lowest crime rates; however, we aim to enhance our study to obtain 100% accuracy by improving our filtering process, software skills.
For the verification of the proposed approach, we also measure the latest crime trends for the highest (Ghaziabad, Uttar Pradesh) and lowest crime cities (Jammu) in India. The measurement of the latest crime trends has been recorded for the time duration of 7 days (23, January 2019-30, January 2019) by using TAGS v6.1. In the latest crime trends, we show the measurement of a number of tweets recorded and the graph for users versus user friends counts. Figure 6 shows the recorded recent trends for Uttar Pradesh, India using TAGS v6.1.

Latest crime trends for Ghaziabad, Uttar Pradesh.
For seven days of crime trends, 93 user’s tweets were recorded for the highest crime location in India. The user friend count intensity is also very high for the determined area, near seventy-two thousand. This latest crime trend analysis for Ghaziabad, Uttar Pradesh is verifying the results of our analysis. Another latest crime trend measurement for the lowest crime cities (Jammu) can be shown in Fig. 7.
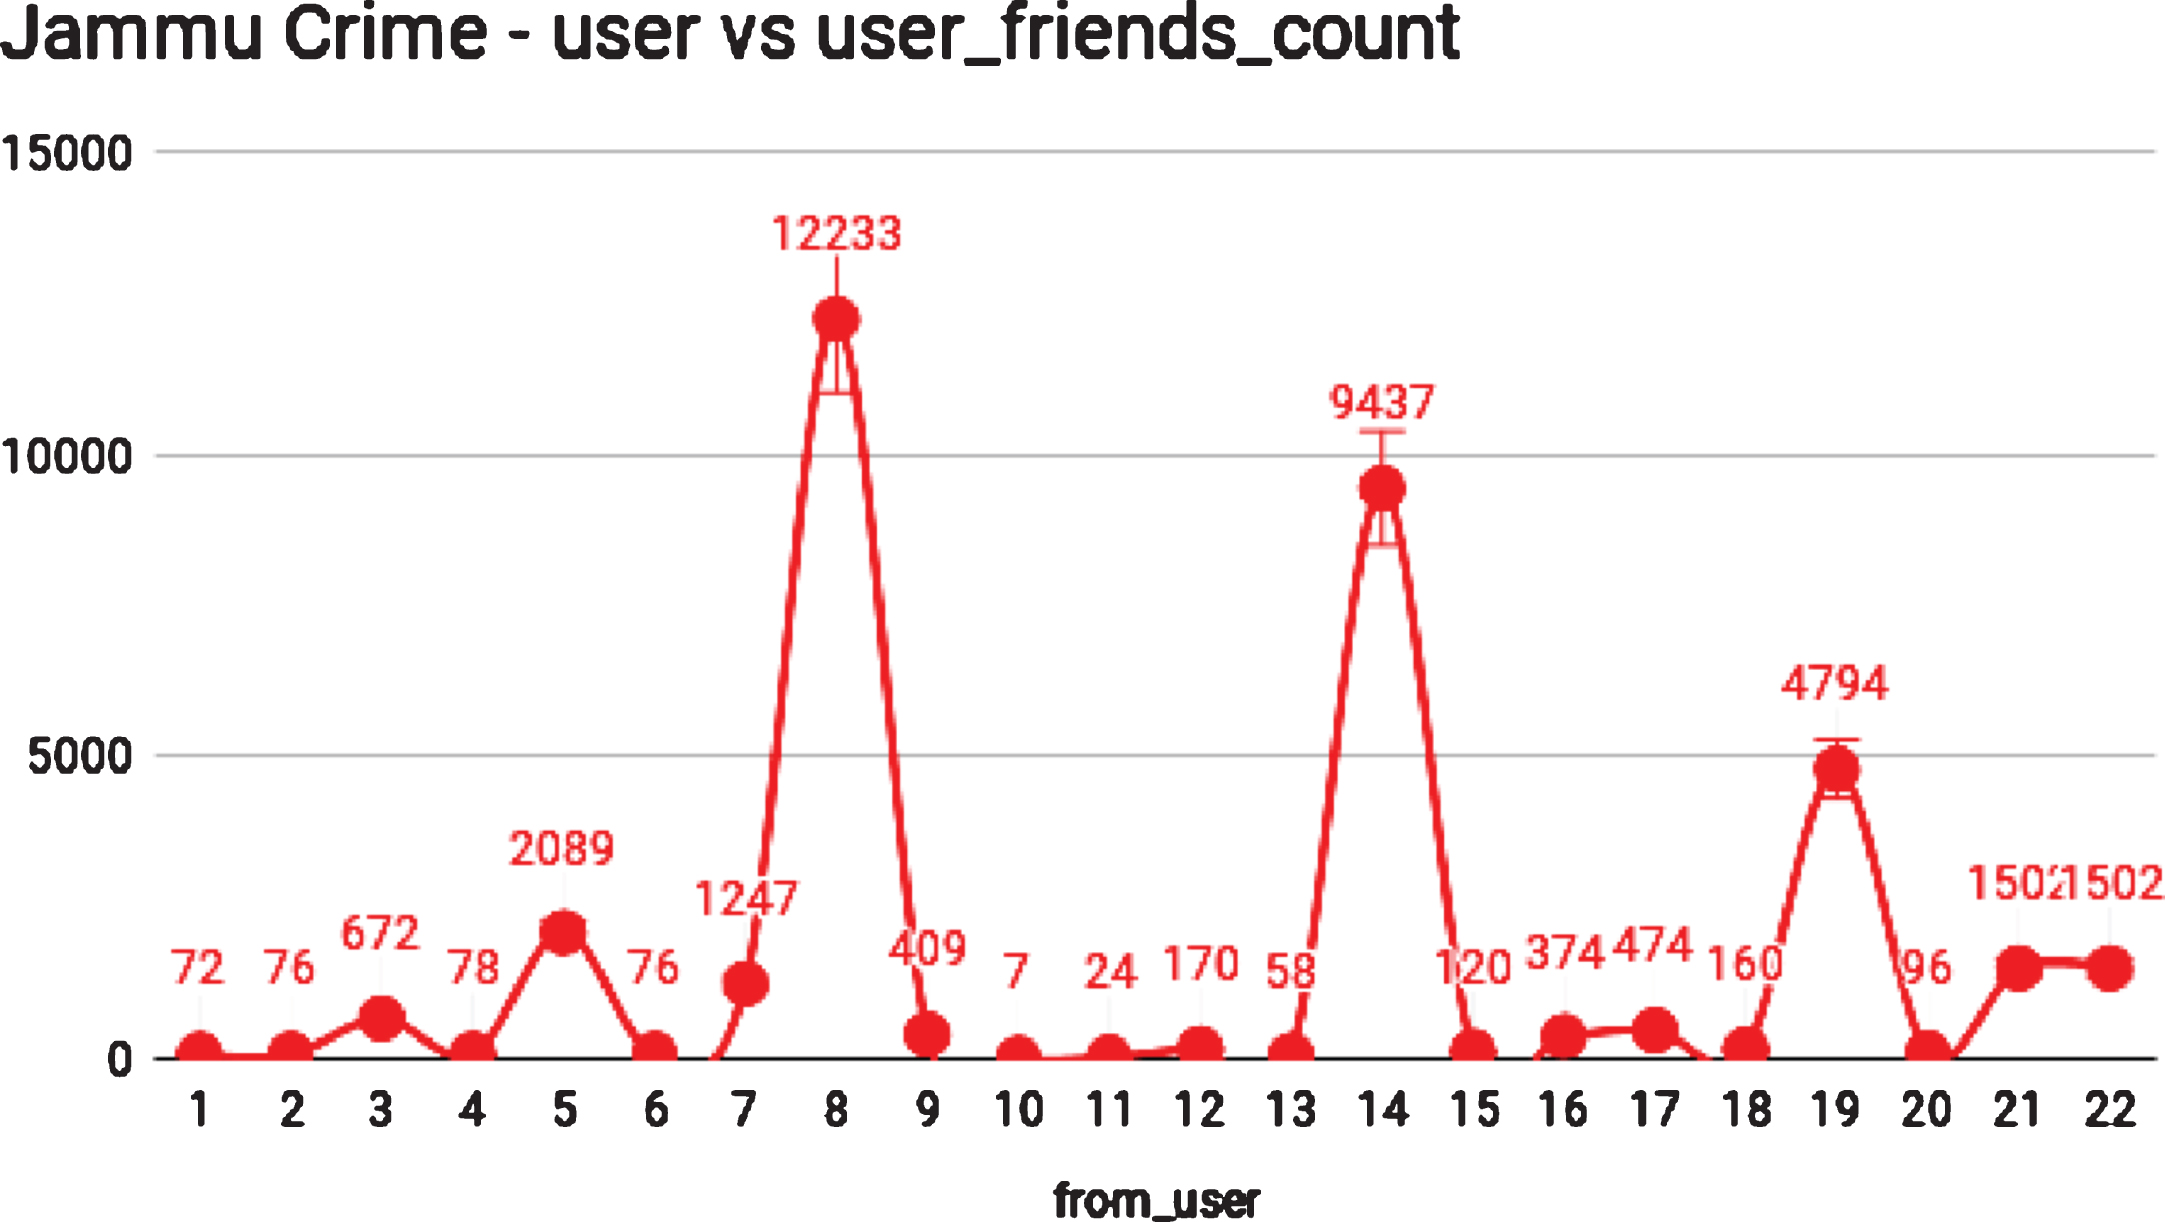
Latest crime trends for Jammu.
For seven days of crime trends, 22 user’s tweets were recorded for the lowest crime location in India. The user friend count intensity is very less as compared with the intensity of Ghaziabad, Uttar Pradesh, near twelve thousand two. This latest crime trend analysis for Jammu is also verifying the results of our analysis. Here, if we compare the seven-day crime trends for both locations “Ghaziabad, Uttar Pradesh, and Jammu” then it can be an outcome that the crime intensity of Ghaziabad, Uttar Pradesh is very high compared to Jammu. Comparison of existing work and proposed work are discussed in Table 8.
Theoretical comparison between different researches
An algorithm for the proposed work is detailed below.
The objective of the paper is to make real-time crime data analysis according to real data obtained from security units and social media datasets. Seven strategic cities are determined in the case study to realize this proposed study. As known, Twitter is one of the most popular social media that people use it to tell their feelings to their followers from all around the world. For this reason, we decided to use Twitter as a social media device to collect crime data in this study. The data collection process using Twitter is a task with a huge computation load because the tweets are the intentions of users, they can be specific and in any format. Our methodology starts with collection of the Tweets, filtering of them and finally comparing them with real crime data. Our comparison results prove that usage of social media is a good way to detect the crime rate for any city all around the world.
According to our detection, we exactly have the same results with real data obtained from security units for five cities out of seven in India. Thus, we approximately obtain 70% accuracy at detection. Here, the most significant point is detecting the cities that have the highest and lowest crime rates; however, we aim to enhance our study to obtain 100% accuracy by improving our filtering process, software skills. To enhance the accuracy of our obtained results, we aim to enlarge our dataset and to use machine learning, deep learning methods, and next-generation language processing approaches. In addition, usage of smarter and next-generation filtering tools can increase our accuracy performance.