
Abstract
The use of the social media (SM) has become more and more widespread during the last two decades, the companies started looking for insights for how they can improve their businesses using the information accumulating therein. In this regard, it is possible to distinguish between two lines of research: those based on anonymous data and those based on customer specific data. Although obtaining customer specific SM data is a challenging task, analysis of such individual data can result in very useful insights. In this study we take up this path for the customers of a bank, analyze their tweets and develop three kinds of analytical models: clustering, sentiment analysis and product propensity. For the latter one, we also develop a version where, besides the text information, the structural information available in the bank databases are also used in the models. The result of the study is a considerably more efficient set of analytical CRM models.
Introduction
As computers take a greater prominence in our personal and business lives, large volumes of human data in various digital formats are generated. Prior attempts to extract useful and actionable knowledge from this vast data source relied on natural language processing and data mining research but mainly focused on relatively well-structured portions of the accumulated data, ignoring the rest. However, the narratives of greater interest and the main social discourse are currently in the process of shifting onto social media where the expression of facts, opinions and emotions are free of structure and the rules of communication are rapidly evolving. For instance, on Twitter and Facebook the communication is often unstructured, distributed and networked via multiple messages from multiple sources. This complex data is challenging but should be examined for various purposes including marketing, customer satisfaction, detection of crime, fraud, money laundering, etc.
In this project we take up the marketing and customer satisfaction objectives and use Twitter data to open new dimensions in marketing efficiency. This medium contains text data that may be quite irregular and contain grammar and typographical errors, special chat language, abbreviations and icons. In particular, we aim to apply text processing and text mining techniques to classify the messages and the people, to determine if there is a sentiment in the message and its polarity and, to identify potential responders to targeted campaigns, both for existing and potential customers. The data analyzed was obtained from a bank partner that is located in Turkey and was augmented by public Twitter data. We compared the newly developed marketing models to the existing models that are developed using demographic and behavioral information and reported the achieved efficiency improvement. The developed methodology will be transposable to applications in other problem domains and sectors.
Predictive modeling is also known as classification where we try to predict which one of the class values that the target variable will take [1]. If the target variable takes only two values (e.g positive-negative, good-bad, 1-0) like in our case, it is called the binary classification. In the literature it is possible to find thousands of papers discussing the applications of binary classification [2–4].
Because of the high volumes and high number of customers, banking has been one of the pioneering sectors for data science applications. It is possible to find a lot of papers on banking applications in the literature where most of them are related with the marketing department [5–7] or the credit risk prediction [8–11]. Perhaps card or transactional fraud detection takes the third place [12–15] followed by some others including ATM/Branch location and cash management and optimization [16–18], and, collection and early warning [19, 20].
Recently, there have been some studies addressing social media analytics. In this regard, Abkenar et al. [21] provides a comprehensive review of the literature on social media analytics. They have identified 74 papers published between 2013 and 2020 whom they classified into two main categories: Content-oriented approaches and network-oriented approaches. According to their categorization, our study is in the content-oriented group. Zhang et al. [22] develops a social media-based decision support system to improve the efficiency of the businesses. Their model is based on the anonymous data where the owner of the messages is not known, and conclusions are driven from the data as a whole. Yang et al [23] suggests a business decision making system based on social media analytics and discusses that it is more useful as compared to simpler methods based only on customer segmentation or sentiment analysis etc.
The syntactic constructs that are recognized in tweets can be noun phrases, verb phrases, or other special chunks like idioms, slang etc. Different languages may require different approaches for preprocessing. Turkish for instance is an agglutinative language similar to Finnish and Hungarian and it has syntactic relations between words or concepts through discrete suffixes and can have very complex word structures. Additionally, when it comes to stemming and extracting nouns or verbs for SA (sentiment analysis) purposes, Turkish verbs can be converted into nouns and other forms as well as nouns can be converted into verbs and other grammatical constructs through affixation [24–26]. This study discusses efficient TP (text processing = methods specific to Turkish and the way they are applied on SM (social media) messages to feed the TM (text mining) and SA process.
Related to the SA objective of our study, it is possible to find some relevant studies in the literature which made SA on Turkish texts. Öztürk [27] did a SA in Turkish and English to analyze the public opinion towards the Syrian refugees. Karayiğit et al [28] analyzes Instagram comments in Turkish to detect the abusive ones. They state the CNN (convolutional neural network) performs the best among Naïve Bayes, support vector machine, decision tree, random forest, logistic regression, Adaboost, and XGBoost. Demircan et al. [29] classifies product reviews in Turkish data as positive, neutral and negative. They concluded that SVM and RF methods outperform decision tree, logistic regression and k-NN (k nearest neighbors).
In any SA work, feature (word) selection plays an important role in the success of the classification algorithms besides the choice of the classification algorithm itself. The studies of Forman [30], Garnes [31] and Tutkan et al. [32] and Yang and Pedersen [33], provide an extensive comparison of some feature selection algorithms including Term Frequency (TF), Document Frequency (DF), Inverse Document Frequency (IDF), Information Gain (IG), Chi-Square etc. On the other hand, among the classification algorithms SVM (support vector machine) is reported as the best algorithm in text data by many researchers [32, 34].
This study focuses on different applications of text mining and thus it has multiple contributions to the literature. First of all, we discuss a novel real-life application of social media analytics. Second, we discuss the pros and cons of some of the well-known text processing tools available for the Turkish language. Third, we propose of a two-level clustering of text messages. Fourth, we discuss and compare different modeling alternatives and feature selection methods for the purposes of SA. Fifth, we develop text-based propensity models and discuss the contribution of text-based information to the classical propensity models developed by the demographical and behavioral information.
Solution Framework.
Outline of the remainder of this paper is as follows: in the next section we explain the main modules of our solution approach and their functions shortly. Then, in the following four sections the modules (NLP, clustering, sentiment analysis and propensity models) are explained in a greater detail. Where appropriate the results obtained are also provided and interpretated. In section seven, we summarize the study and the main conclusions arrived. We also discuss the limitations of this study and indicate some potential future studies.
Our bank has been one of the pioneering banks in Turkey which makes effective use of data analytics tools for not only CRM purposes but also for the risk management and fraud prediction purposes. As for the analytical CRM, they have already deployed value segments, demographical segments and behavioral segments, product propensity models (cross-sell, up-sell), and churn prediction models. With this project, we aimed at developing a new segmentation based on the text data, text-based propensity models, customer sentiment analysis and augmented propensity models with the inclusion of text data in addition to demographical and behavioral data already available at the bank.
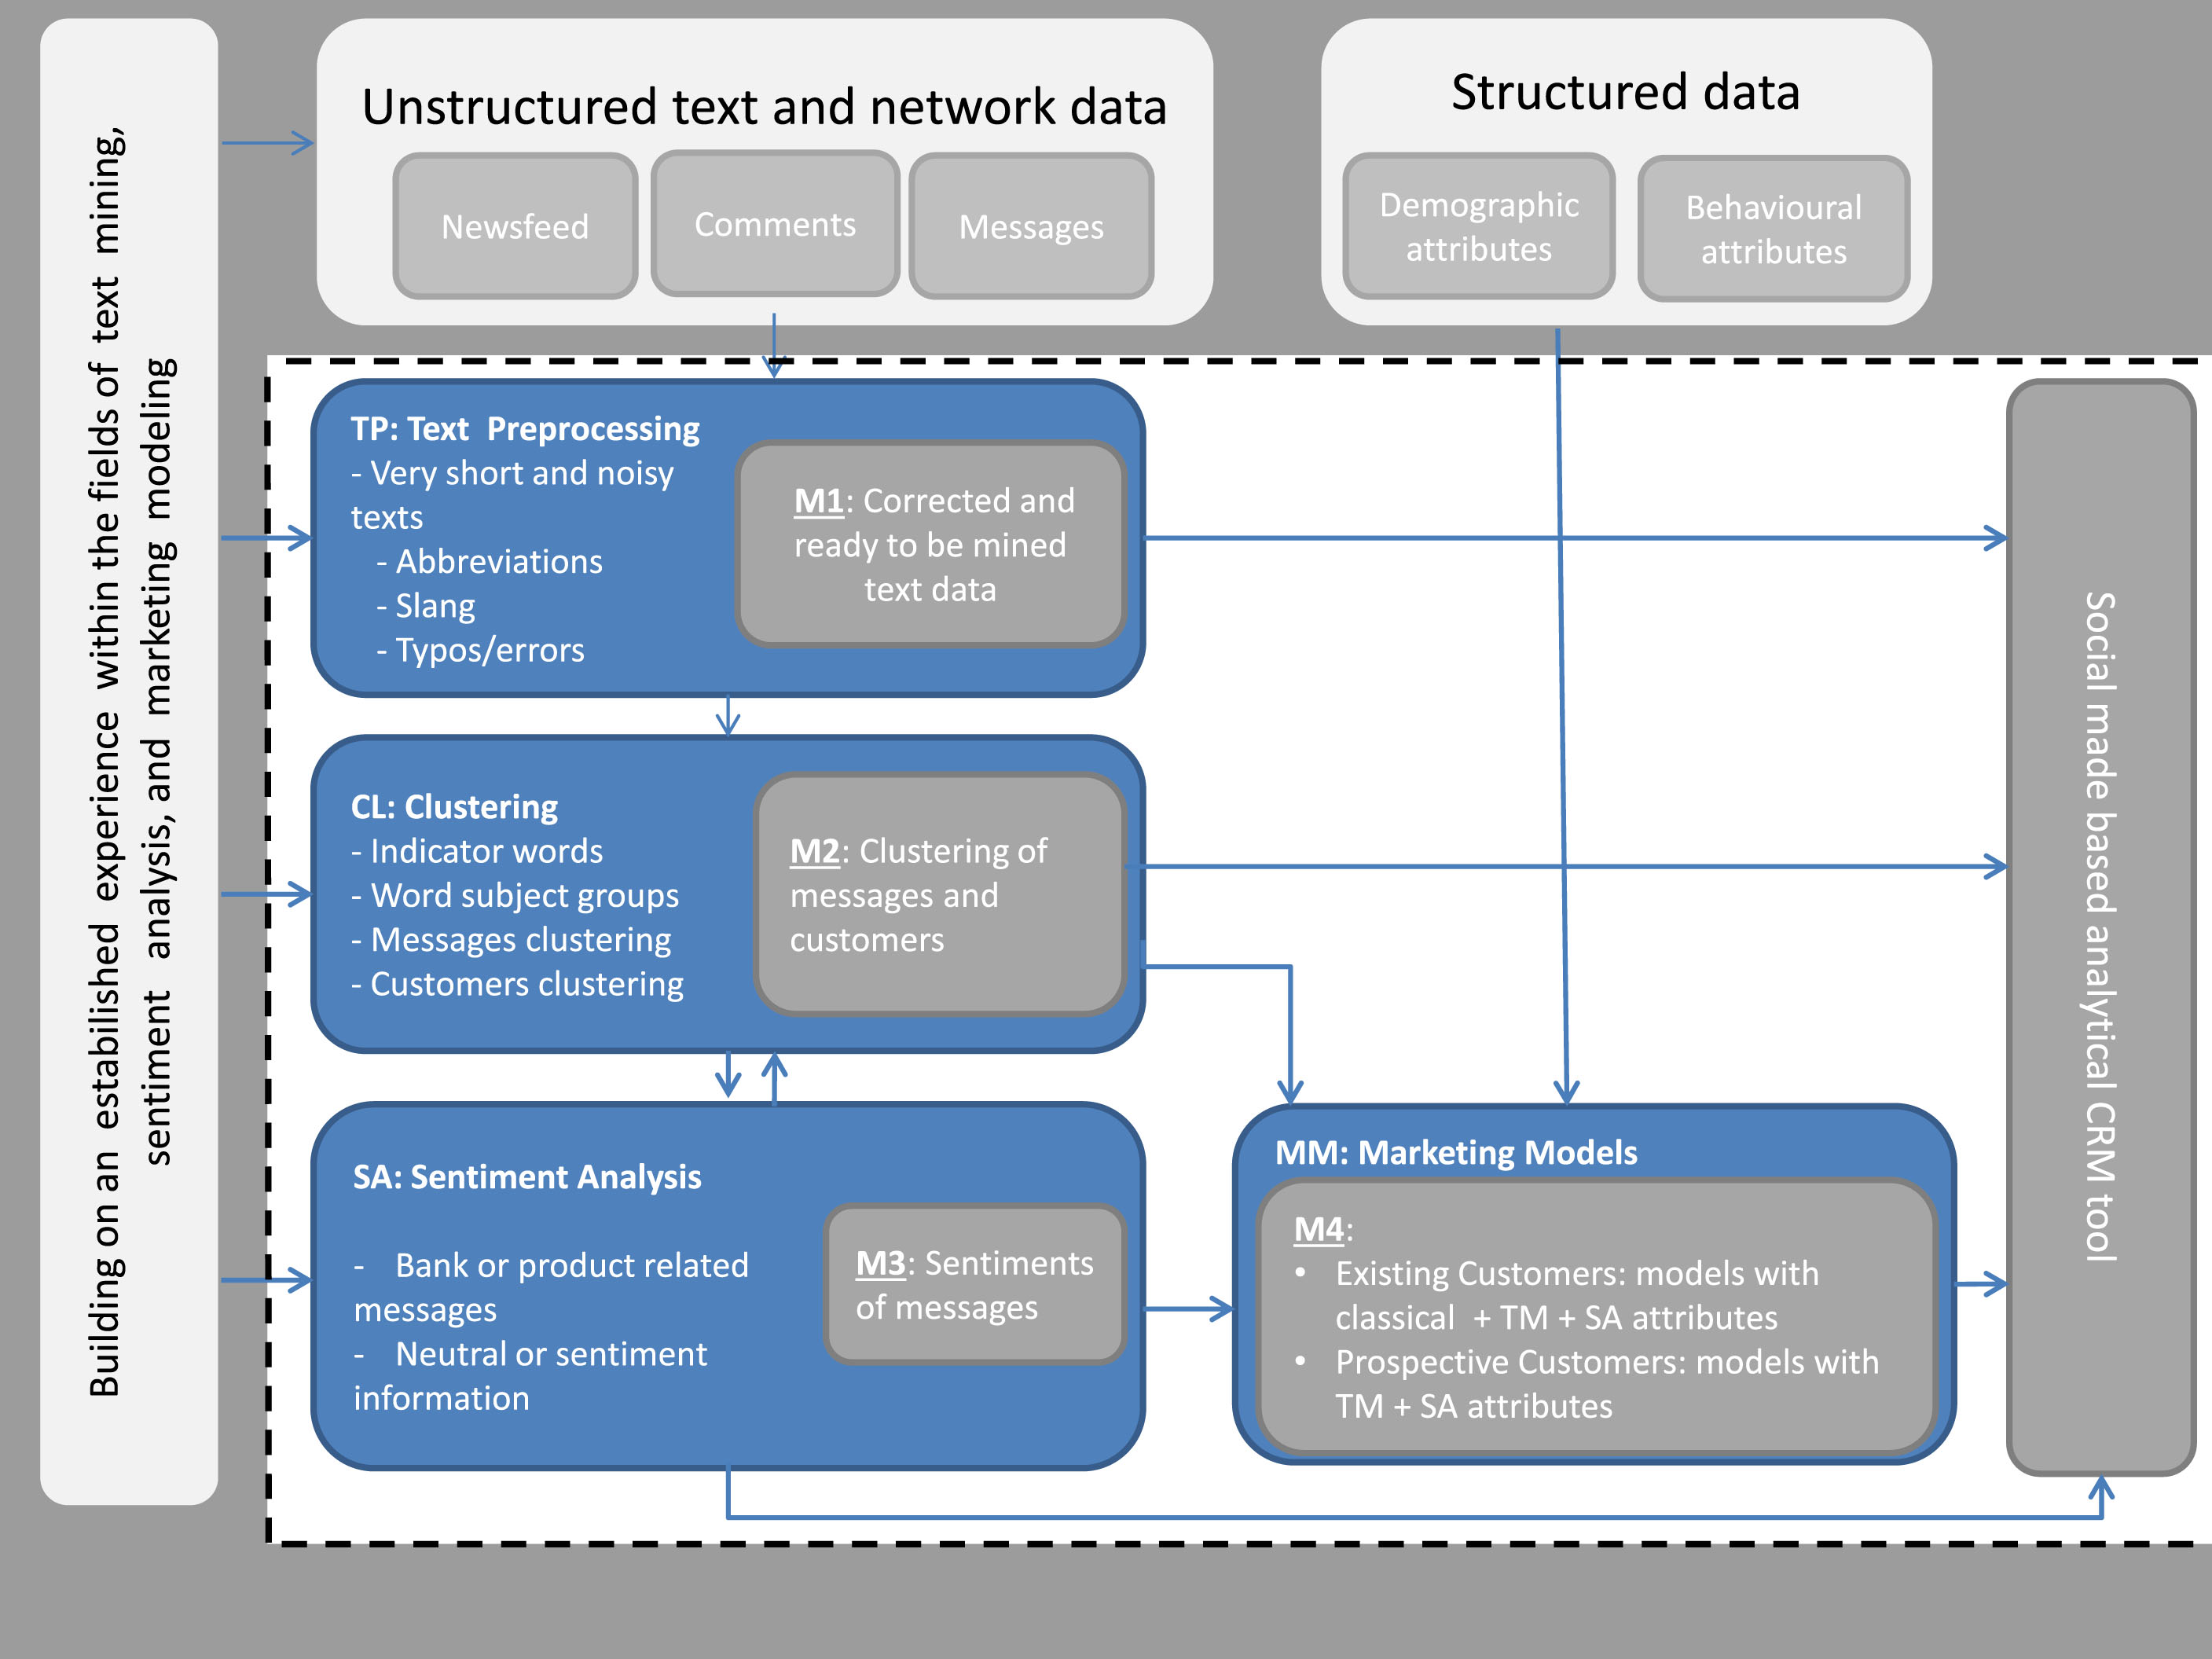
The solution approach starts with text preprocessing (M1: module 1) where the text data is prepared for text mining purposes using the tools of the NLP. In this module, the typos/errors are corrected, abbreviations are identified, and long forms of the words are obtained and then, morphological analysis is made to obtain the roots and types of the words.
In the second module (M2), we develop text-based clustering in two steps. In the first step, the individual messages are clustered and then the people (not necessarily bank customers) are clustered based on the types (clusters) of messages they have written so far.
Our third module (M3) is about developing sentiment analysis models. In this regard, we have to note that, although there are plenty of good performing sentiment analysis models for English, for Turkish, depending on the complexity of the language, we are not that lucky. Sentiment analysis is not applied to all messages but only to the ones that are related to the bank or one of its trademark products.
The last module combines the findings of the previous ones where we develop product propensity models using: a) only the text information from M2 and M3, b) using both the text information and the structural data available in the bank databases. The models using all kinds of information will be used for the existing customers whereas the models based on text information only can be used to gain some of the prospective customers.
The studies made to develop each of these modules are explained in the next four sections.
Text Pre-processing
First, the last two years (to be exact last 26 months as detailed in section six) Twitter data of anonymous Turkish users and some un-anonymous users whose permission have been already obtained by our bank are crawled.
In this study we did not aim at improving the state-of-the-art techniques for Turkish text pre-processing and NLP techniques. Rather, based on the previous experiences of team members and project consultant, we aimed at putting together a set of well performing techniques to enable the development of analytical CRM models as explained in the next sections.
The steps we followed for NLP are: Tokenization Deasciifier Vocalization Spelling correction Morphological analysis and disambiguation
Tokenization is parsing a message into tokens (words). Any non-ASCII character that might be observed in the text is converted to the most similar Latin character (Deasciifier). For this purpose, we have used the Lucene tool existing in Zemberek [35]. In vocalization, we convert some tokens used in informal language like cnm, tmm to their formal versions as canım, tamam etc. For this, we could not find a satisfactory open-source tool and thus coded it inhouse during the project. Then, for the spelling correction of syntax errors we used the tools available in Zemberek again.
For the Turkish morphological analysis, we have investigated Zemberek [35], TRMorph [36] and ITU-NLP [37] tools. ITU-NLP was not preferred since it was not open source and was cloud based. Zemberek and TRMorph were found to be usable for our project.
Zemberek contains the root words dictionary as a tree structure. First, it finds the most similar root tree and starting from the top node of this tree it makes the morphological disambiguation using the grammar rules to determine the suffices that the root can take. The rules for all root words are kept in an XML file and during the run, Zemberek keeps them in memory and makes the disambiguation to obtain the roots and their suffices. It can also give priorities to alternatives if there are any. Zemberek is a Java application.
TRMorph, differently than Zemberek, finds the roots and suffices using the Stuttgart Finite State Transducer (FST) tool. Due to inherent rules of FST, it produces more alternatives as compared to Zemberek. It is also capital letter sensitive. However, it runs much faster. It was argued that the tools can complement each other, and especially since new words and definitions can be added to TRMorph, a hybrid system was decided to be used.
In our project, the morphological analysis is made by Zemberek first and then TRMorph. The words that could not be disambiguated were inspected manually and the ones with high frequency were disambiguated manually and added to the TRMorph database. To increase the process efficiency, we prepared a list of words already disambiguated and when processing a new tweet, this list is checked and only the new ones were taken to the disambiguation process. As far as we know, we were the first to combine two different morphological analyzers in such a setting in the same project.
Clustering
Since we are concerned with the contents of the messages or what people are talking about, we decided that it is enough (or, more appropriate) to use nouns. Thus, for the clustering purpose, we kept only the nouns and eliminated the rest. Also, in Turkish, since especially the nouns can take numerous numbers of suffices, of which some of them turns the noun into an adjective or an adverb, we decided that it is better use the plain forms (roots) of nouns.
Clustering of messages
After having the full list of nouns, we calculated their frequencies, in other words the number of times they appeared in the full list of tweets. After sorting these frequencies in non-increasing order, we eliminated top two per cent too frequent nouns and bottom two per cent too rare nouns, and, in the end remained with approximately 4000 words.
Afterwards, following a lot of brainstorming sessions, we decided that it would not be wise to try to make a clustering with almost 4000 dimensions because of mainly two reasons: First, the word-tweet availability matrix was too sparse, i.e., most words did not appear on most tweets. Second, some of these words have similar meanings and if we treat them independently, they can appear in different clusters, and this would make the differentiation and interpretation of clusters a harder task. Thus, we decided to group the words according to the closeness of their meanings. This way we were able to obtain 25 different groups of words such as clothes, cars, banking, other financials etc. Still, it was not possible to place most of the words to any of these groups and it was also not possible to define any further group of words that can be named nicely. Here, note that, our perspective is related with the objectives of the bank project; maybe in another application other work groups can be defined.
Then, we calculated the word-group –tweet availability matrix where only existence counted and then applied K-means clustering where for the value of K, we experimented the values between 5 to 20. After discussions with the line of business (LOB) we liked 15 clusters that can be named as in Fig. 2. Actually, there is one more cluster which contains all tweets that do not include any of the word groups we have defined.

Names of the 15 clusters of messages.
The names of the clusters are given by the LOB experts. The distribution of these clusters is given in Fig. 3 where the smallest cluster (1.8%) is the collection of the seven smallest clusters and the largest cluster (65.2%) is the NONE cluster consisting of all tweets that do not include any of the word groups decided above.

Cluster Sizes.
First, we prepared a person-tweet cluster matrix where the numbers in the cells showed the number of messages of that person falling in that cluster. Then, using these numbers as the values of the 15 dimensions (variables) together with the 16th dimension showing the total number of tweets, we applied K-means clustering again. We experimented different values for K and in the end, we decided to keep it at 11, in other words we wanted to have 11 clusters for people. Again, the biggest cluster appeared to be the one where no tweets are observed from the 15 tweet clusters (38.3%). If we exclude this cluster which can be named as the group of people that do not write meaningful (in terms of the goals of the project of course) tweets, the sizes and possible names of the remaining 10 clusters appear to be as shown in Fig. 4.

Clusters of people
To obtain the necessary labeled data, we first went through our messages database and filtered out the ones which contain some words about our bank (say, XBANK) or its trademark products (like the credit card). Then, we asked the business experts to label them as a positive message for the bank, or negative, or neutral. This way we obtained 1895 positive messages, 1840 negative messages and 1895 neutral ones. In these 5630 messages there were a total of 3018 distinct words. Depending on the feature selection algorithm selected, as much as 800 different words were selected to be used in the sentiment analysis.
Well-known feature selection methods for text classification include Document Frequency (DF), Term Frequency (TF), Chi-Square (χ2) [38], Information Gain [39], Mutual Information [40], Odd ratio [41], Cross-Entropy [42] and, CPD (categorical proportional difference) [43].
In our study, we have implemented four different feature selection algorithms: CPD, χ2 (Chi-Square), IG and ABS which are explained below. The reason for choosing CPD, χ2 and IG was their ease of implementation and proven success record in the literature [33, 43]. Yang and Pedersen [33] determined IG and χ2 as the best two methods. Then, Simeon and Hilderman [43] stated that CPD generally outperformed six other methods including IG and χ2. On the other hand, the reason for choosing ABS was that it was suggested by one of the team members.
To explain the feature selection methods we have implemented, lets utilize the famous contingency table shown in Table 1. Here, A shows the number of tweets where the word w appears on the tweets in class c, B shows the number of tweets the word w appears on the other classes, C shows the number of tweets of class c that does not contain the word w, and D shows the number of tweets in the other classes that does not contain the word w.
Word-tweet classes contingency table
Word-tweet classes contingency table
CPD [43] measures the degree to which a word contributes to differentiating a particular category from other categories in a text corpus. In other words,
CPD can take values between –1 and +1. The CPD for a word is the ratio associated with the category ci for which the value is greatest. That is,
χ2 measures the lack of independence between a word w and a category c if it is assumed that the occurrence of a word is actually independent from the category label. For the above contingency table;
Similar to CPD, the χ2 value of a word w is defined as the maximum of the χ2 values for all the categories. That is;
IG measures the decrease in entropy when a selected feature is present versus when it is absent. One of the most popular feature selection methods in text classification is the Information Gain (IG) [47, 43]. The formulation of IG is;
Where;
P(w) = (A + B)/N = the ratio of tweets the word w appears
P(w’) = (C + D/N) = the ratio of tweets the word w does not appear
P(ci/w) = A/(A + B) = the ratio of ci for the tweets the word w appears
P(ci/w’) = C/(C + D) = the ratio of ci for the tweets the word w does not appear
We have also implemented a simple feature selection method that we call ABS and it is equal to absolute value of the difference between the minimum ratio and the median ratio of tweets that contain a specific word in the three classes (positive, negative, neutral.;
For example:
ABS=Absolute value of (MIN Ratio –MEDIAN Ratio) = absolute (0.3 –0.4) = 0.1
The words having the highest CPD, χ2, IG or ABS values will be chosen for modelling. In order to have a fair comparison between the feature selection methods, we have chosen the top 800 words for each of them.
For the prediction of the sentiments, we implemented and compared three alternative approaches:
Alternative 1: learn from positive and negative messages only, after scoring label the medium scored messages as neutral
Alternative 2: learn a three-class model from positive, negative and neutral examples
Alternative 3: learn in two steps where in the first step classify the messages as opinion (positive or negative) or fact (neutral) and in the second step, classify the messages in the opinion group as positive or negative
For model building and testing we applied the 5-fold testing. That is, we divided our data set of 5630 messages into five parts and trained the model in four parts and tested in the fifth part. This way, we obtained five different models and while deciding on the best feature selection method and the best modelling alternative, we based our decision on the average of these five runs. According to our experimentation, as detailed later below, we have concluded that the best modeling alternative is Alternative-3 (the two-phase approach) and the best feature selection method is IG. In Fig. 5, we can see a comparison of the three alternatives on one of the test sets with IG feature selection method. The algorithm used for all three algorithms was the SVM because of its confirmed successes in text mining by various researchers [34, 44]. We used the default settings of SVM as available in the IBM SPSS Modeler and among the alternative els we preferred to use polynomial el since it performed better then linear el and RBF.
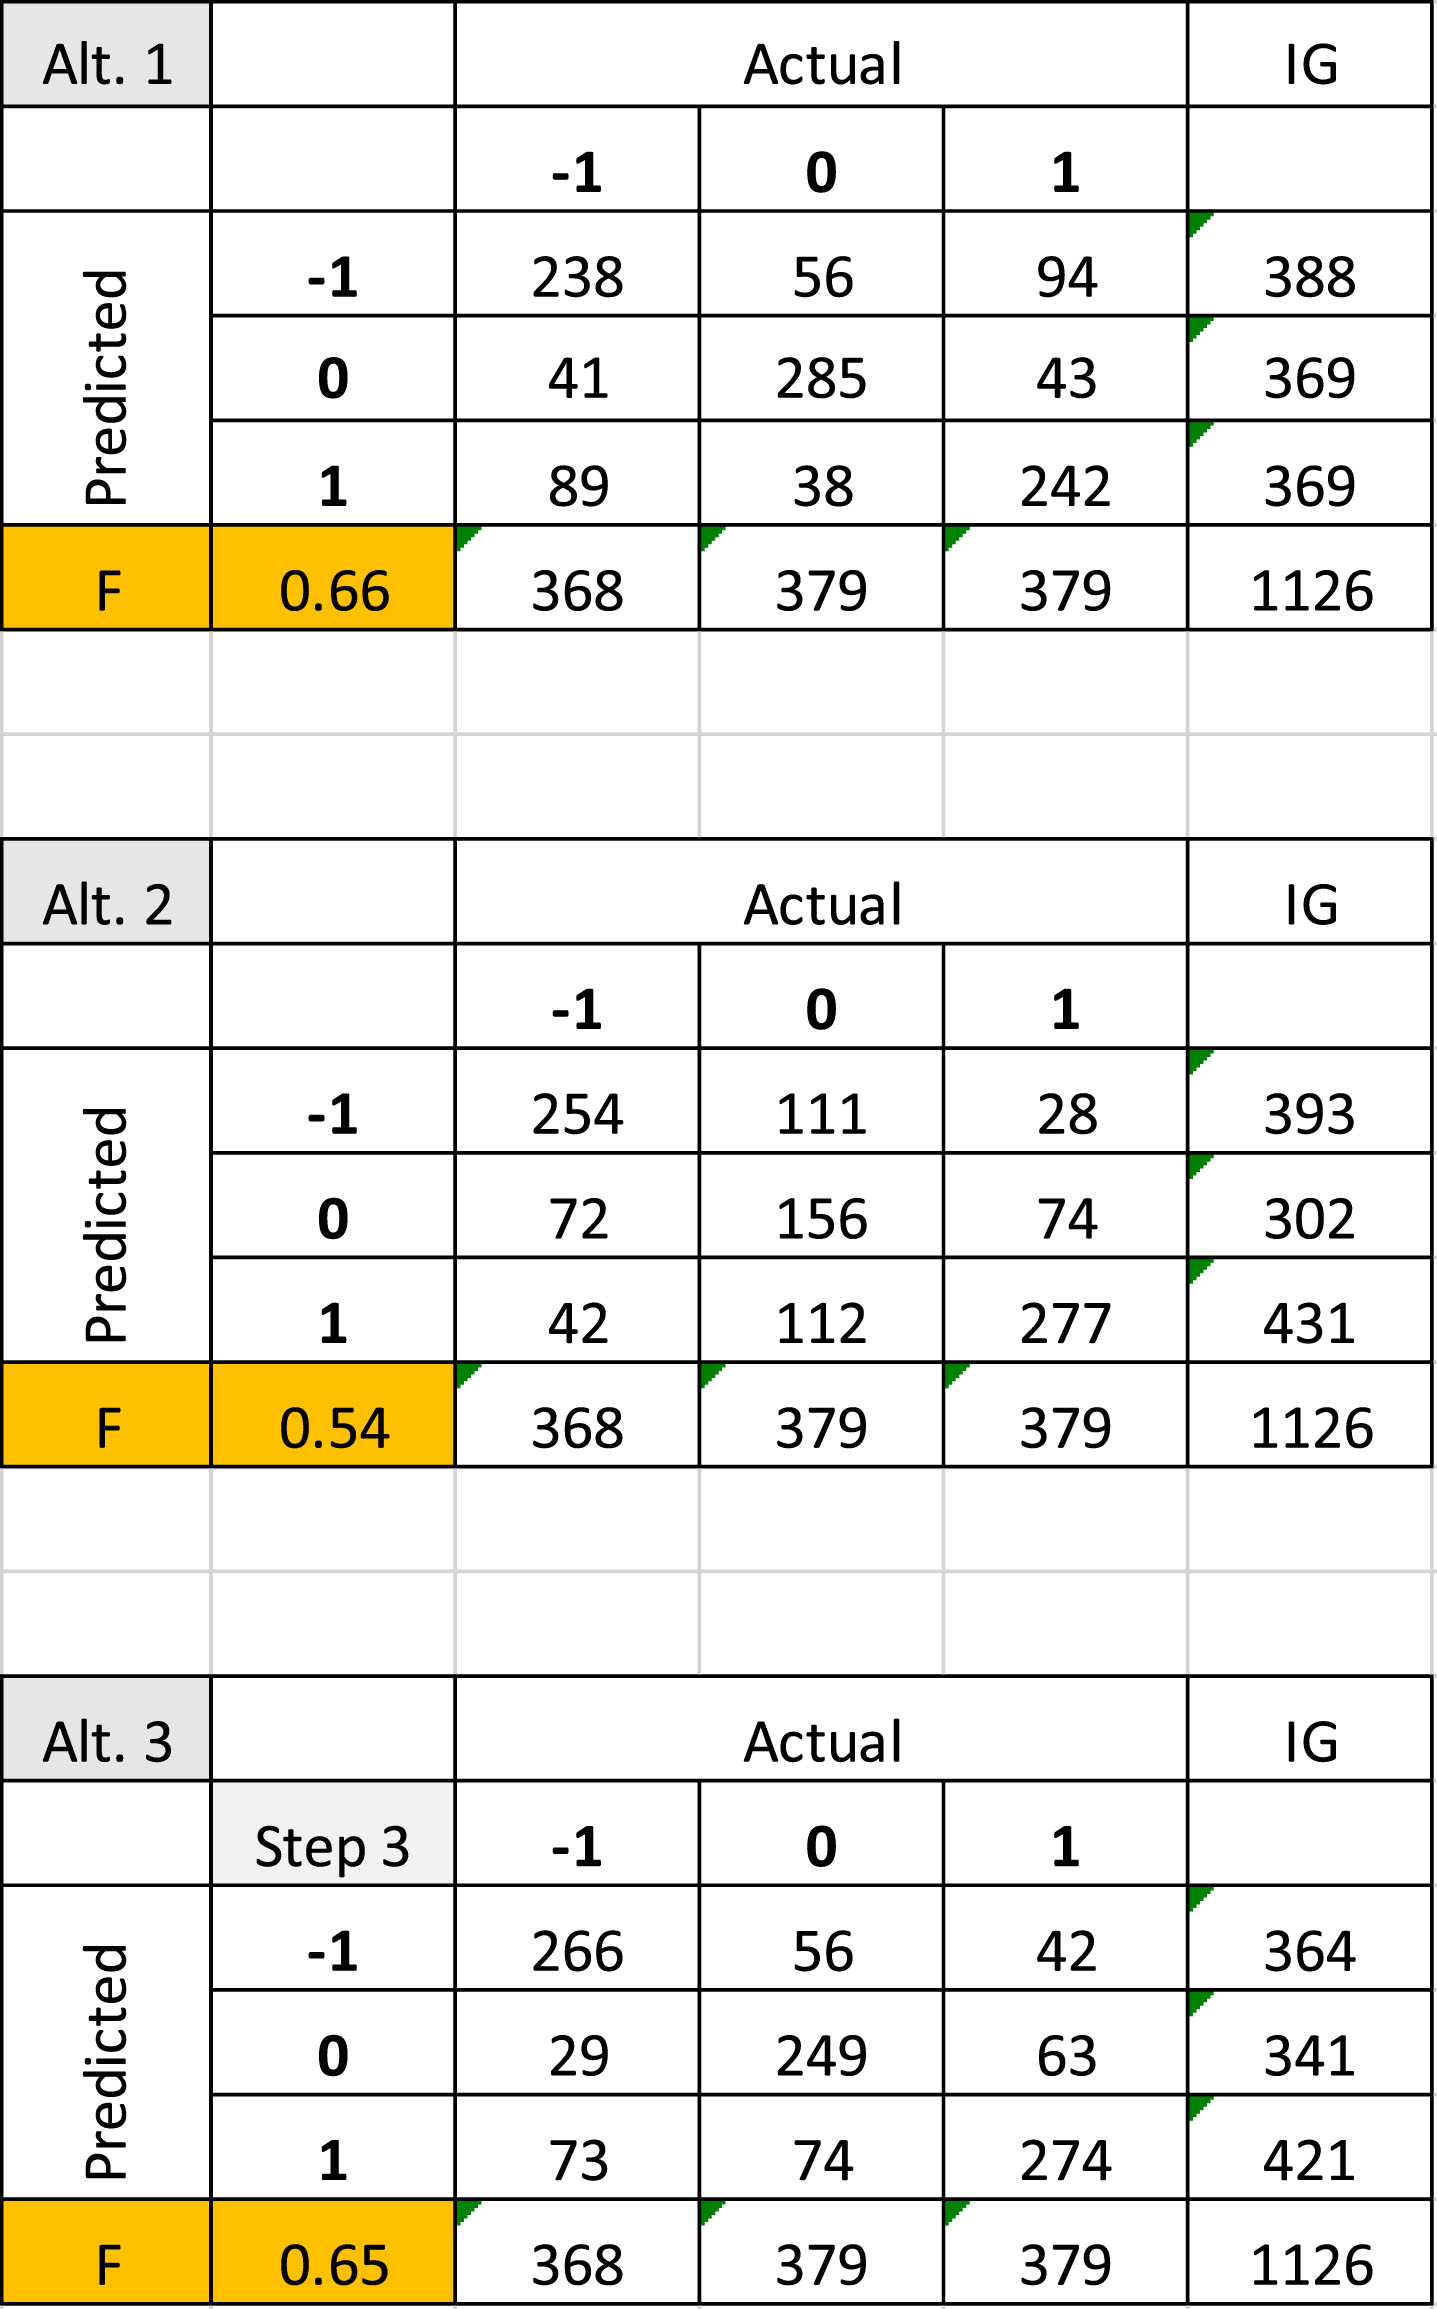
Confusion matrices of one of the runs.
Note that the only modeling alternative directly producing the confusion matrix is alternative 2 (Alt. 2). Since Alternative-1 is trained from the positive and negative tweets only, during the scoring, we assigned the neutral label to those tweets which get intermediate scores. While arranging the number of labels for each class, we followed the proportion of the number of classes in our data. In other words, the top 379 tweets having the largest positive class score are labeled as positive, the next 379 labeled as neutral and the remaining 368 are labeled as negative. For the unlabeled data that could be faced in the future, the score thresholds obtained in this experiment is planned to be implemented.
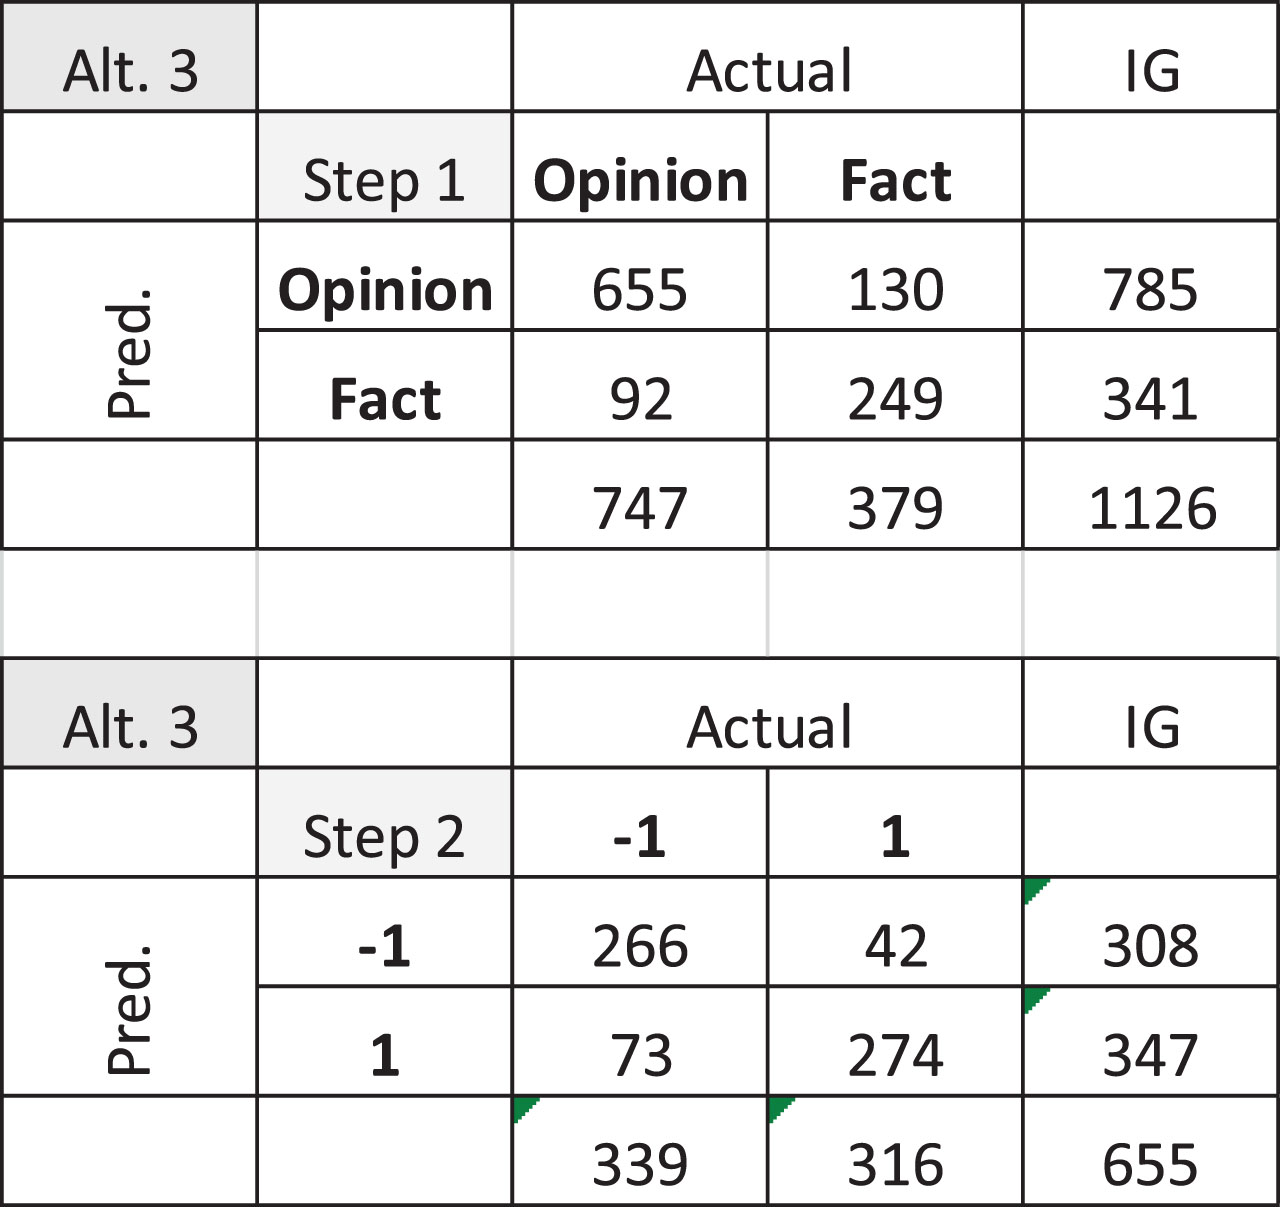
Since Alternative-3 is a two-step approach we obtained its confusion matrix in three steps as shown in Fig. 6. First, the confusion matrix of the first step is shown where the class labels are Opinion and Fact. The confusion matrix of the tweets that are predicted as opinion and are actually opinion or shown in the second part of Fig. 6. When the tweets predicted as opinion but are actually facts and the tweets predicted as fact are added, we obtain the confusion matrix shown in Fig. 5 (Alt.3 Step 3).
Confusion matrices of the steps of alternative-3.
For a binary classification problem, the performance measures Precision (p), Recall (r) and F-measure are defined as follows:
For multiclass classification problems the definition of these measures differs a bit. In this case, first we calculate the precision and recall values of each class and calculate their averages. In the average calculation, one can either take a simple average where each class will have the same weight or a weighted average can be taken where the weights are determined by the number of records falling in each class. Since in our case, the records in each class are almost equal to each other both methods will produce almost the same results. The F measure which is obtained by simple average is sometimes named as the F1-measure in the literature. As an example, the details of the calculation of performance measures for Alternative-2 are shown in Fig. 7. Note that the F-measures of all three alternatives are provided in Fig. 5.
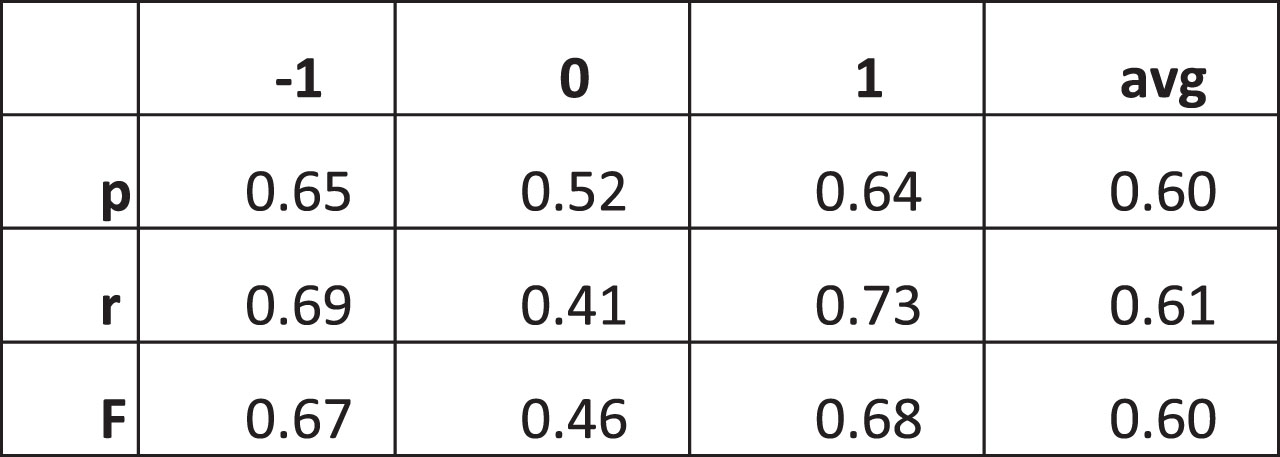
Performance measures of Alternative-2.
In order to compare the modeling alternatives and the feature selection methods, we made a full design of experiments. In this regard, we developed a total of 60 models (three alternatives times four methods makes 12 combinations where with each combination five models are developed as per the 5-fold cross validation) and recorded their F measure performances. As a result, we observed that Alternative-3 with IG produced the best results. Since tabulating all experimental results will take an unnecessary amount of space, we content with displaying summary results comparing modeling alternatives (Table 2) and feature selection methods (Table 3).
Average performances of modeling alternatives
Average performances of different feature selection methods for Alternative-3
Table 2 shows the results across all four feature selection methods. Here we can see that the best modeling approach is alternative-3 followed by alternative-1. Alternative-2 which is a 3-class classification model building did not perform satisfactorily.
Then, we preferred to show the results only for alternative-3 in Table 3. From Table 3 we can see that IG is the best performing feature selection method followed by the χ2 method. The CPD method also performed very good in parallel to the literature but ABS method we introduced here did not perform as good as the other three.
Note that, for a three-class classification problem F measures around 70% can be regarded as good since for a binary classification the typical good F measure does not exceed 80% much.
After some brainstorming sessions with the LOB experts, we have concluded that the two main bank products that might be predicted by analyzing the text information in tweets are time (term) deposit accounts and loans (either consumer, or automotive or mortgage). For the time deposit accounts we assumed that those words showing that the person is wealthy can be good indicators. On the other hand, for the loans any word indicating the interest of a person to cars or to houses or words indicating the financial difficulty of the person could be among the predictors of a loan product usage.
The number of bank customers whose Twitter IDs were known was in the order of several ten thousand. Among these customers who has bought any time deposit or loan product in the recent time was not enough to build a good enough product propensity model. Thus, we put some effort to increase the number of bank customers whose Twitter ID we can identify. For this, we made a general search on public Twitter profiles that matches the bank customer names. We first identified the names and surnames for which there is only one match in Twitter domain. From these we eliminated those that we know either the name or the surname is very popular in Turkey in order to avoid any random match (it might be possible that our customer do not have a Twitter account and that account belongs to someone else in the country). This way we have obtained about around 130.000 matches, including the ones that we know before, we obtained a working base of about 150.000 people. We crawled the messages of these people in the last 26 months.
Out of these 150.000 customers we have identified the ones who bought a time deposit or a loan product during the last 24 months. If a customer bought the product in more than one month s/he is counted more than once. This way we obtained 3756 time deposit buyers and 7264 loan buyers. Then, we matched the messages written by the customer 60 days prior to product buying for model building. We eliminated those customers who had not written even a minimum of two messages. In the end we came up with 1887 positive examples for the time deposit account and 3807 positive examples for the loan product. We added the same number of negative examples from 150.000 to obtain balanced data sets. We used 70% of these data for model training and 30% for testing. The algorithm we implemented was the logistic regression algorithm because of its steady good performance in our earlier propensity models for banking. The model performances on the test tests are discussed below.
In the bank there have been classical propensity models in place. In these models the input variables were mostly behavioral ones whereas occasionally demographic variables also took place. To make these models more comparable with the would be developed text models we trained them again. Note that, for the classical models we had more positive examples compared to text-based models. As a result, we developed three types of models: classical, text based and hybrid. The performance results are shown in Table 4 where the number of positive and negative examples in the test set were taken as equal.
Performances of propensity models
Performances of propensity models
Maybe there is no need to discuss what variables took place in the classical model, but it could be nice to provide a discussion on the other two types of models. The variables in the text-based models were the total number of the tweets of the customer together with the number of tweets in each tweet cluster. During the preprocessing we found it more useful to turn them into flag variables which took value 1 if there were any tweet in that cluster, 0 otherwise. This explanation is valid for both products. In the time deposit model, the existence of tweets in the “fun”, “celebration”, “technology”, “education” and “finance” turned out to be more important whereas in the loan model, total number of tweets and the number of tweets in the “vehicles” and the “technology” clusters were more important.
In the hybrid models, most input variables were chosen from the classical ones with a few inclusions from text-based variables. In the time deposit account, the two text-based variables turned out to be existence of tweets in the “fun” cluster and the “celebration” cluster. This is logical since such kind of activities might be indicators of wealth. In the loan model, only the total number of tweets variable had a chance to be included.
The results in Table 4 indicate that, the inclusion of text-based information brings a non-negligible increase in the performance of classical models. However, we have a limitation here in that for most of the bank customers we do not know their Twitter IDs and thus the values of the corresponding attributes are not obtainable. On the other hand, for the people that are not customers of the bank yet or that we do not know they are the customers of the bank indeed, the text-based models can help the acquisition of new customers or help in increasing the product diversity of the existing ones by targeting them via “special mention” tool of Twitter.
In this study, we discussed a comprehensive data analytics framework to analyze the Twitter text data and gain useful insights to increase the marketing efficiency of a bank.
Our study had four modules. In the first module, the Turkish texts are preprocessed using NLP tools. In the second module, a two-step clustering is developed. In the first step, tweets are clustered and then in the second step, the people are clustered based on the clusters of the tweets they have written. The clustering is made using all tweets and all people independent of whether they are bank customers or not. In the third module, the sentiments of the tweets related with the bank are analyzed and classified as positive, negative or neutral. The last module is about determining the propensity of people to buy particular bank products (loans, time deposit accounts). For bank customers both the bank database and text information are used to improve the efficiency of the previously developed propensity models. For non-bank customers only the text information is used to determine their banking needs.
For future studies, one can consider using other non-structured and non-text data (like videos) as well to understand the needs of customers even better.
Footnotes
Acknowledgments
The author would like to thank to Buket Begüm Semercioglu for her contribution to discussions and helping the model development in IBM SPSS Modeler and professor Gülşen Cebiroğlu Eryiğit for her support to Turkish NLP.