
Abstract
Focus on the distribution vehicle scheduling problem under travel time delay, a series of rescue modes generalized from practical vehicle planner’ experiences were presented. The measurement method of value function based on prospect theory and the disruption management strategy of customer’s psychological perception are put forward in this paper. A multi-objective optimization model for disruption management of logistics distribution is established through multi-objective programming at first. Next, the idea of gradual optimization for the target to obtain the terminal logistics distribution adjustment scheme with minimum disturbance is introduced. Acting the customer’s psychological perception time as the reference point, the degree of the customer’s psychological perception of the expected time of goods is measured with the prospect theory. In order to optimize the disruption management model and search the optimum solution of multi-objective optimization problem, an improved quantum bacterial foraging algorithm is proposed. The effectiveness and practicability of the proposed method is verified through the comparison and analysis with rescheduling method.
Keywords
Introduction
In recent years, the electronic business improves very quickly and it is confined by the efficiency of the logistics. In which the terminal logistics presents complexity due to its long time, high cost and low efficiency. There are some problems existing in the terminal logistics in China such as the change of the time window and the change of the address etc. Distribution vehicle travel time delay is the most common disruption event, and it may hinder the normal implementation of transport plans, so that the quality of logistics services can not be effectively guaranteed. Therefore, the disruption management of distribution vehicle scheduling under travel time delay has important research value. It focuses on the efficient and fast vehicle routing adjustment strategy under travel time delay to meet or exceed customer’s distribution needs in this paper.
The dynamic disruption in terminal logistics belongs to the category of disruption management. The main work of disruption management is to establish the correct model according to the degree and property of disruption to adjust the initial scheme locally, so as to minimize the disruption. The key step of disruption management is to control the adjusting of initial scheme within the range as small as possible. The scholars from related fields at home and abroad have made some exploratory research on disruption management of logistics from many aspects. For example, Bushuev M, et al. (2013) studied how to shorten the physical delivery time based on modern logistics network [1]. Mohammad, et al. (2013) researched how to create the customer value through improving the timeliness of delivery, meeting the personalized needs and strengthening the interactivity [2]. Guiffrida, et al. (2014) proposed the method to improve scheduling pattern through adjusting the distribution time in business district and building a pick-up point at the location where the customer received the goods [3]. Ehmke J, et al. (2014) analyzed the elements and activities involved in urban freight distribution, e-commerce, and convenience store [4]. Gevaers (2015) pointed the importance of sending the goods to the final customer directly at terminal delivery phase [5]. M.D.Yap, et al. (2016) designed the scheme which had the least influence on the environment combining the characters of B2 C [6]. Tang J F, et al. (2010) designed two-phase algorithm to integrate the delivery order and undelivered order from the angle of improving the utilization rate of distribution tools and enterprise delivery efficiency [7]. Jiang L, et al. analyzed the vehicle failure rescue problem from the aspect of capacity disruption [8]. Freeman Elmer, et al. (2011) compared the mode of point to point with the mode of hub radiation from the aspect of emergency supplies and established the functional model of mixed collaborative delivery [9]. Hu X P, et al. designed the scheme of disruption management to balance the interests of all parties based on the prospect theory [10]. Erkan Kose, et al. (2014) implanted the internet of things and mobile phone message service in the process of logistics distribution and realized the “agriculture-household” distribution mode which supports the asynchronous receipt [11]. Ning T, et al. (2016) verified the influence of asymmetric information and risk aversion on the optimal delivery time contract in logistics distribution through numerical experiment [12].
The above literatures have made meaningful researches on the disruption management of terminal logistics. But the existing research does not consider the influence of behavioral factors based on customer psychological perception on the feasibility of optimal solution, and distribution vehicle scheduling disruption management theory system has not yet formed. The problems faced by distribution vehicle scheduling disruption management under vehicle travel time delay such as the measurement of disturbance degree, the construction of multi-objective programming model and the real-time solution of large-scale problems have not been effectively broken. In this paper, aiming at the disruption management of terminal logistics scheduling, the disruption management model is established through combining the method of customer psychological perception and quantitative analysis in operations. Moreover, an improved bacterial foraging algorithm and disruption measurement strategies are proposed to provide theoretical basis and technical support for logistics disruption management.
Disruption measurement strategy based on prospect theory
The disruption factors of this kind of problem include three aspects: customer satisfaction based on time, logistics delivery costs and delivery efficiency [13]. These three aspects are focused on the human behavior factor and the implicit driving force and decision-making is the customer’s psychological perception.
Definition and hypothesis
The common process of the terminal logistics scheduling with disruption is as following: the distribution system consists of a distribution center and several customer points; when the delivery vehicle leaves the distribution center, it needs to complete all the services of the customers firstly and then return to the distribution center. When the disruption (such as the customer’s demand changes or the vehicle does not work) occurs, it needs to modify the initial distribution plan and reschedule, that is, local disruption management [14]. In actual disruption management of terminal distribution, if there is disruption, the system needs to balance the above objectives while minimizing the disruption. The main hypothesis of the process includes: (1) the road situation is certain to obtain the travel time between different customers; (2) the amount of freight should be more than the demand of the next customer; (3) the quantity of the goods, customer number and demand in distribution center can be obtained in real time.
In actual distribution, the customer psychology will be affected by the disruption. It is difficult for the above rational hypothesis to apply in the actual disturbance management directly. Therefore, a disruption measurement strategy based on prospect theory is proposed in this paper.
Function based on prospect theory
Prospect theory is a kind of decision model to describe the degree of sensitivity of the customer to the result under uncertain condition. On the basis of prospect theory, the overall evaluation value V
i
of the objective i can be expressed as the function of τ
i
and υ
i
in Equation 1 [14]:
In which, m represents the probability value with negative effects and n represents the probability value with positive effects; τ
i
(m) represents the probability decision weighting function of m, τ
i
(n) represents the probability decision weighting function of n, that is τ
i
(0) =0, τ
i
(1) =1; υ
i
represents the value function, υ
i
(x) and υ
i
(y) represent the subjective value of the customer relative to reference point (customer’s mental expectation time is chosen as the reference point here). The value function model V
i
(x) can be described as Equation 2 [15, 16]:
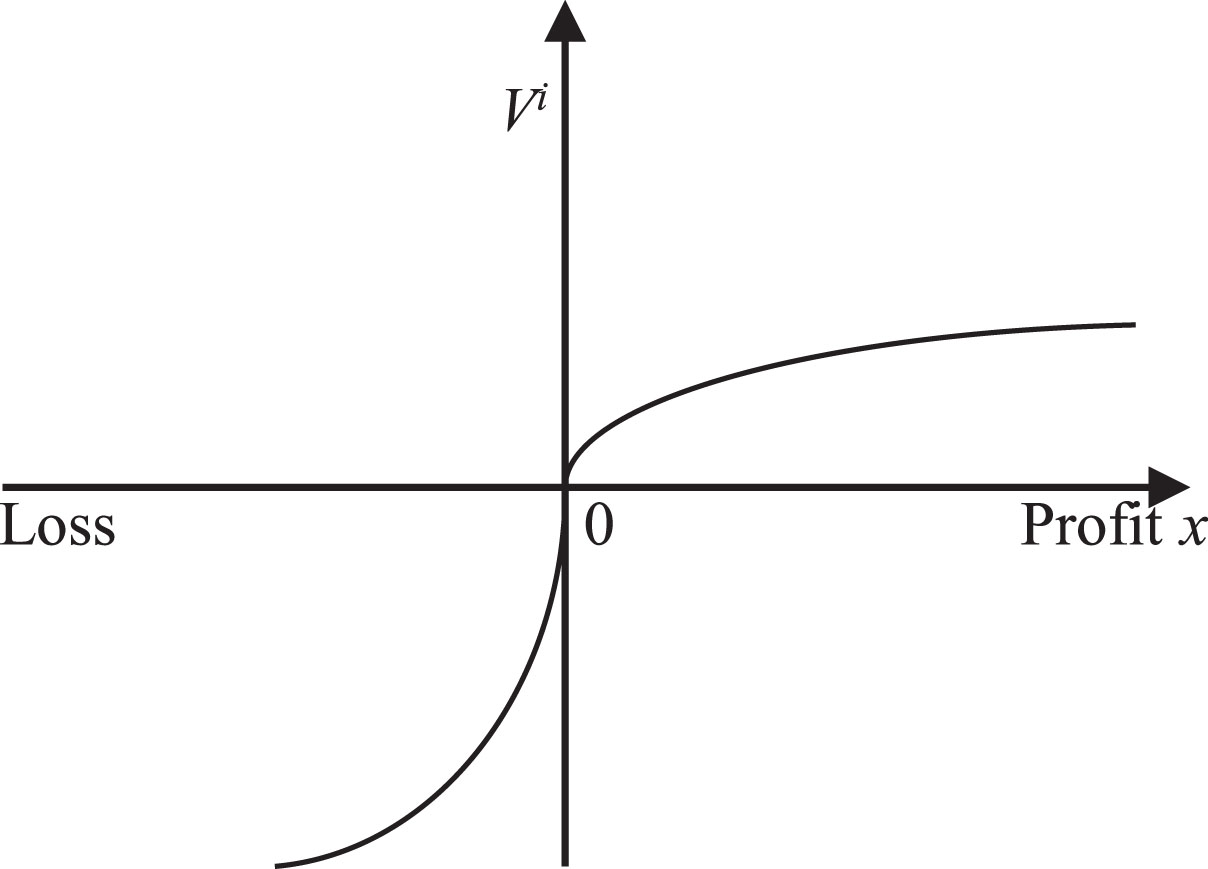
Value function curve of prospect theory.
The psychological perception of the customers to goods distribution is affected by various information of the distribution system, such as the efficiency of the backbone logistics, the terminal logistics and the subjective decision-making of the delivery agent. If the delivery time differs greatly from the customers’ psychological expectation time, the customers’ psychological disgust value will be increased. From the time when the orders are sent out, the customers will collect the delivery time Th about the arriving of the goods through different channels and generate psychological expectation time T0, that is, the greater value of (Th-T0) is, the higher the psychological disgust perception for the customers to the delivery service is.
The psychological perception of the customers to goods distribution is related to the logistics enterprises and the actual arrival time of the goods Tf . When the customer is eager to obtain some goods, the weight function of the expected decision can be described as follow:
The expectation of the terminal logistics for the customer is described in Equation 3 [16]:
According to the prospect theory, if the psychological expected time T0 is acted as the reference point, when Tf < T0, the customer’s psychological expectations disgust is very low, and it will increase if the value of Tf is approaching T0, when Tf > T0, the customer’s psychological expectations disgust will increase significantly. Therefore, the psychological expectation curve of the customer to the terminal logistics can be described in Fig. 2 [17], in which the terminal logistics distribution time is the abscissa and the degree of the psychological expectation of the customer is the ordinate.
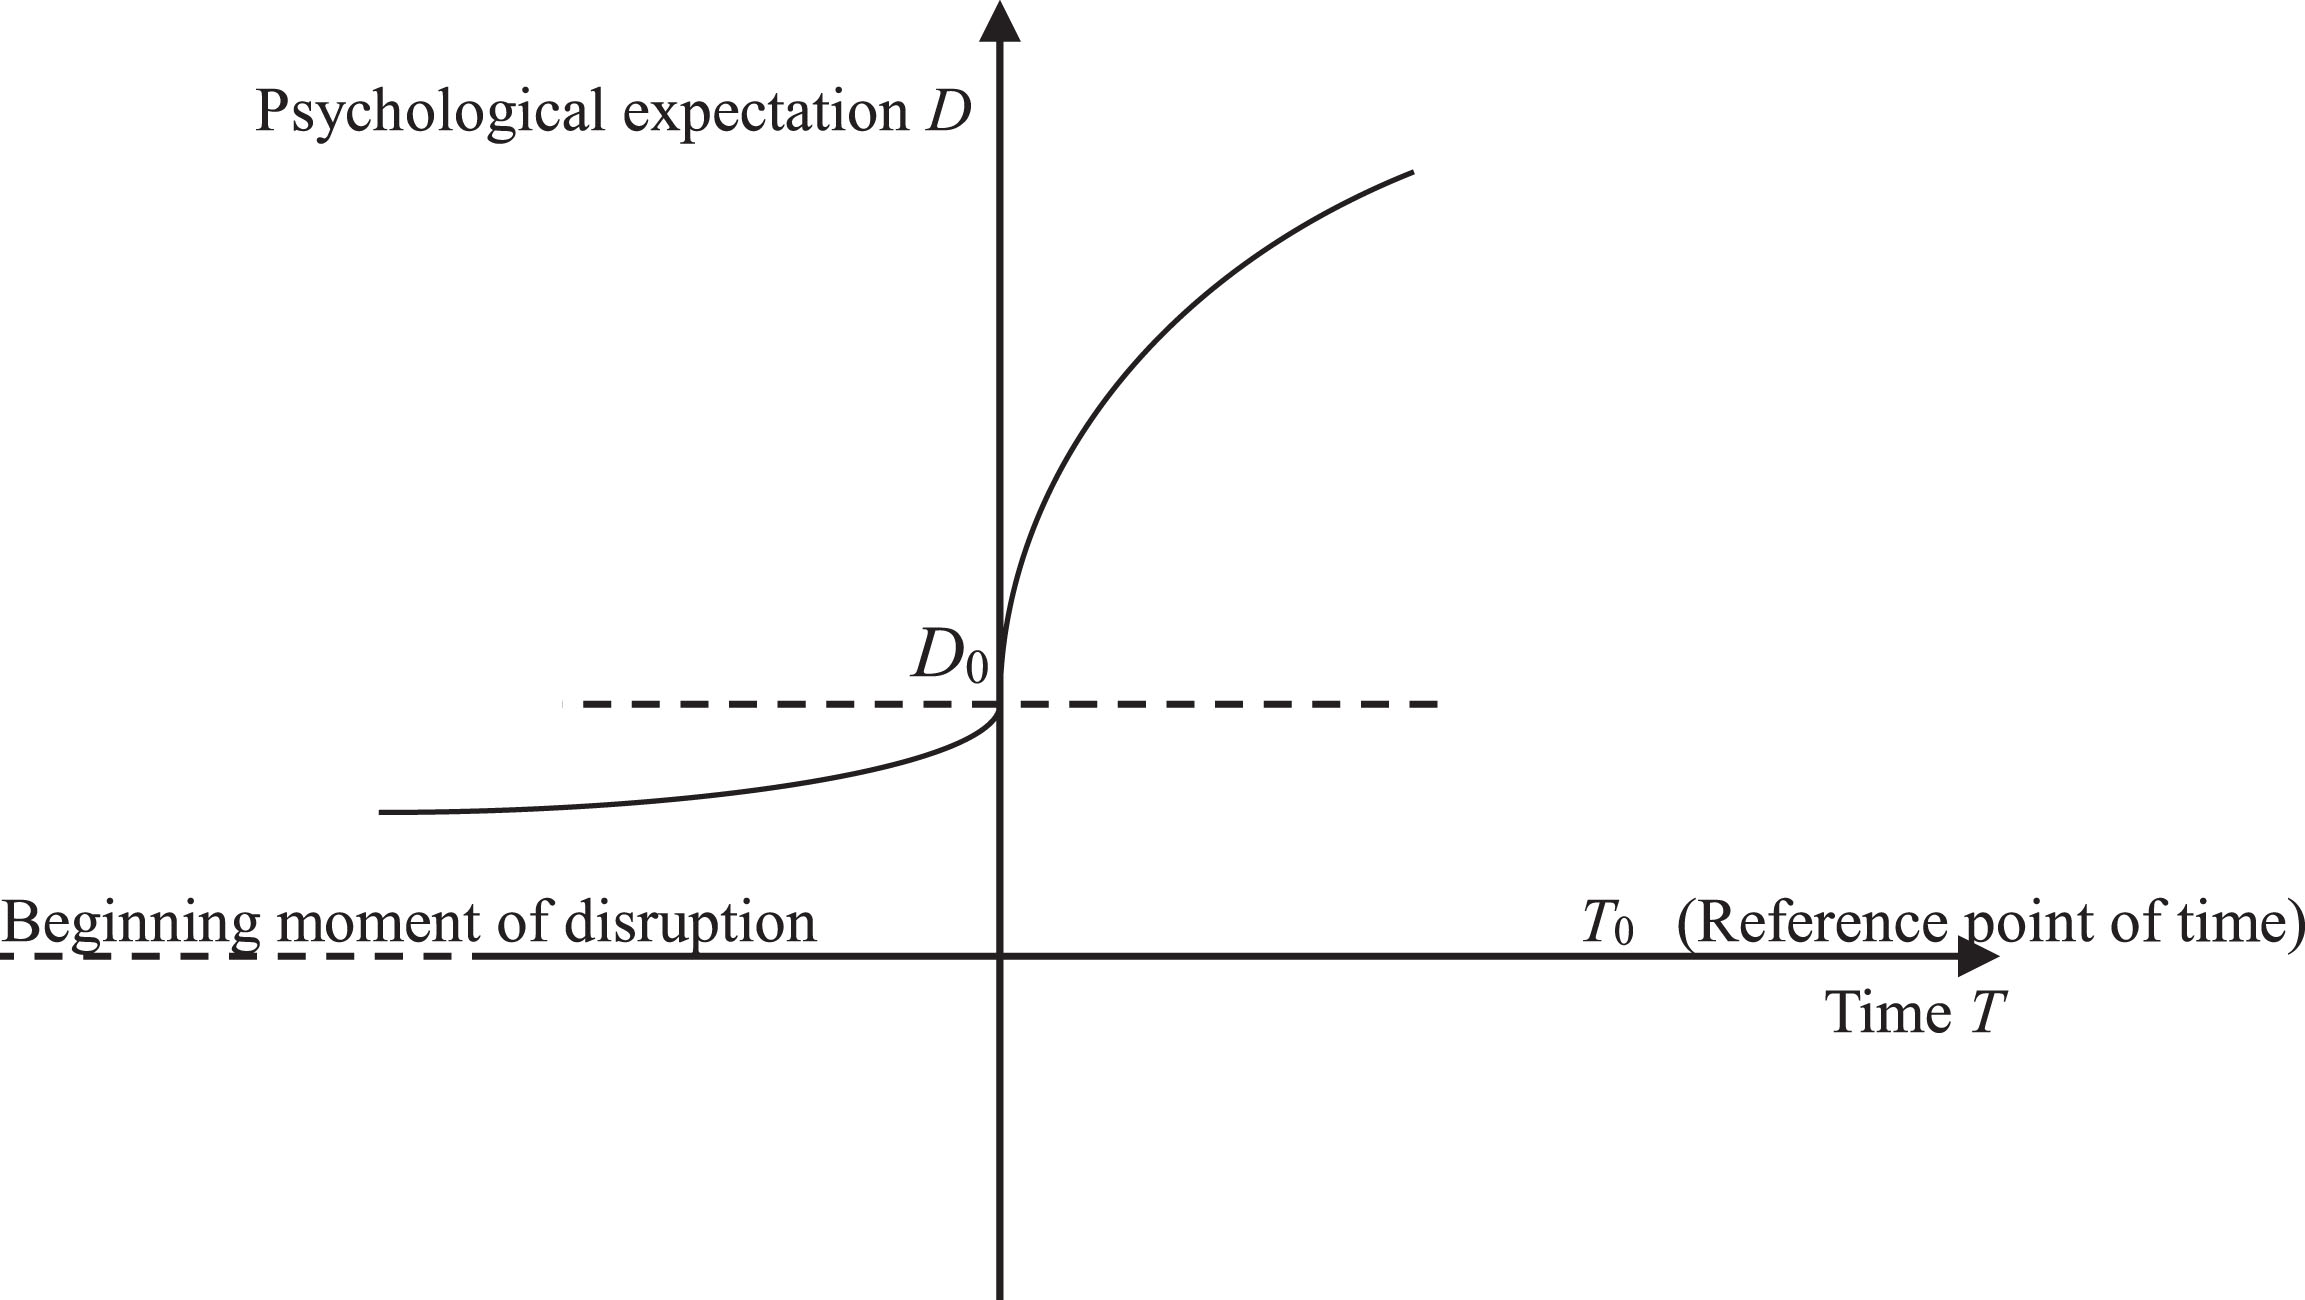
Psychological expectation curve.
Assumed that the expectation disgust is D0 when Tf =T0, and the psychological expectation perception function may be described as
Distribution optimization scheduling model
Two objective functions are constructed in this paper: one is to decrease psychological expected perception of the obtaining goods time in terminal logistics, the other is to minimize the disruption.
According to the definition and hypothesis of the problem in 2.1, the following mathematics model can be constructed:
Define the decision variable:
Objective function:
The objective function of the disruption problem is shown in Equation 4, including the distribution service cost before disruption, the travel cost of new customers and the dispatching cost of new vehicle.
The meaning of the symbols in the model can be described as following:
N: the number of the customers;
K: the number of the distribution;
i: the delivery yard;
j: the customer (i,j∈{1,2, ... ,N});
L: the vehicles in the event of disturbance;
q ik (t): the cumulative load for vehicle k from the customer i, q ik (t) is less than the maximum cargo volume here;
q i : the demand of customer i;
F k : the fixed cost of the vehicle;
t ij : the travel time for the vehicle from i to j;
c ij : the cost from i to j;
ω ijk : the traffic volume for the vehicle k from i to j.
The constraint condition is as follows:
s.t.
In the above Equations, Equation 5 is the psychological expected perception function for the customer to the goods; Equation 6 describes that each customer must be served; Equation 7 and Equation 8 describe that each customer can only be served by one vehicle; Equation 9 describes that each vehicle leaving from the yard should be full load; Equation 10 describes that the capacity for each vehicle should not be less than the demand of the next customer.
Common bacterial foraging algorithm
The common bacterial foraging optimization algorithm (BFOA) (Chatzis S P 2011) is a kind of algorithm based on global random search, and its main operations include chemotaxis, reproduction and elimination [17, 18]. The chemotaxis is the core of BFOA, including Tumbling and Swim. When the bacterial individual is to search nutrients, it will turn to search better fitness value until it reaches the maximum number of chemotaxis or meets worse solutions. Then a half of individual with weak ability of foraging will be eliminated according to fitness value of all individuals in a cycle, meanwhile, the other half ones will be replicated to keep the number of bacteria. Elimination is to create new bacteria individuals to keep the total number of bacteria, due to some individual may die in the searching process, which is conductive for chemotaxis to jump out of the local optimization. If the elimination reaches enough iteration, the algorithm will end (Xu J. J 2013) [21].
Improved quantum bacterial foraging algorithm
Considering the quantum theory can make the individual appear in any position of the whole feasible search space with strong global search performance and population randomness [19], the quantum bacterial foraging optimization (QBFO) is proposed in this paper. The probability density function of bacterial population in the quantum space is constructed by the sharing information of bacterial population in the reproductive stage.
The state and the position of the individual bacteria are uncertain in the quantum space, and they are determined by wave function of ψ (Y, t). The probability density function of the individual position is represented as |ψ|2. The attractive potential based on the Delta potential well model is established on each dimension of the attractor. The potential energy function can be expressed as follow:
Where, Y = x
id
- P
d
is the distance between the individual position of x
id
and the attractor. It is introduced into Schrodinger (Equation 11) to obtain ψ (Y, t) (Equation 12) and Q (Y) (Equation 13) in each dimension, in which A represents the feature length of δ.
The motion of the individual in the potential field follows the above |ψ|2, and its position is uncertain. But in the practical application, the individual bacteria must have a certain position in any time, so the individual motion Equation will be got through the Monte Carlo simulation in this paper. Take the random number of u in (0, 1), and u = e-2|x
id
-P
d
|/A, then the position updates Equation of the d dimension variable of individual i is shown in Equation 14:
In Equation 15, β is contraction expansion coefficient, and β <1.782 is to ensure the convergence of the algorithm (Wang W 2013) [20]. The method is to change β1 into β2 linearly following the evolutionary algebra (Equation 16), and mbest is the average value of the best position vector in the population (shown in Equation 17).
Considering the disadvantages of the fixed step, a dynamic indentation control strategy is proposed here to expand the search space under the premise of the convergence.
The implementation steps of QBFO are as follows: Initialize the parameters. Including the number of individual bacteria of s, migration times of N
ed
, reproductive times of N
re
, chemotaxis times of N
c
, swimming times of N
s
and migration probability of Ped. Initialize population. Generate s individual bacterial vector of xi randomly in the solution space. Calculate the fitness function J of each individual bacteria. Start to cycle. Transfer cycle l = 1:N
ed
; reproductive cycle k = 1:N
re
; chemotaxis cycle j = 1:N
c
. Start to chemotaxis. The following operation is performed for each bacteria i: Turning: generate a random vector of Δ ∈ R
n
to adjust the direction, and each element in vector Δ is a random number in [–1, 1]. Update the position of the individual bacteria x
id
(d = 1, 2, …, D) according to Equation 10, and the rest D-1variables remain unchanged.
In which, C (i, j) represents the step size of the forward swimming, φ (i) represents the random direction after rotation. Swimming: evaluate the fitness of x
i
(j + 1, k, l), if the fitness is superior to x
i
(j, k, l), x
i
(j, k, l) will be replaced with x
i
(j + 1, k, l) and swim in accordance with the direction of the move until the fitness value is no longer improve or reach the maximum number of steps. Make d = d + 1, if d = D, then go to step 5(d), otherwise go to step 5(a) to continue to operate the next variable. Make j = j + 1, and change the swimming step of individual bacteria according to the dynamic indentation strategy in Equation 20, where H is dynamic indentation coefficient.
Reproduction based on quantum behavior. After a complete chemotaxis cycle, the current individual best position and the global optimal position are to update. Calculate the average best position mbest of the population according to Equation 18 and update its position according to Equation 14. Migration. Sort all the bacteria according to the energy, and migrate the bacteria (s, Ped) whose fitness is low according to random initialization. Judge whether the cycle is complete.
56 static Benchmark examples of the library of Solomon are selected to verify the effectiveness and robustness of the proposed algorithm [19, 20].
Testing example
The library of Solomon [21, 22] contains 6 kinds of examples including 100 customers, one distribution center, and three problems will be selected from R1∖R2 of uniform distribution, C1∖C2 of cluster distribution and RC1∖RC2 of mixed distribution to be tested.
Verification of efficiency
The rescheduling algorithm [23] for dynamic vehicle routing problem and the QBFO proposed in this paper were run to test the Solomon examples. Firstly, disruption events were created randomly in different time zone for every example. Then the QBFO has been run 10 times for the same disruption events, and the results are shown in Figs. 3 and 4. The figures described the percentage of the distribution cost and time window deviation to average value of the three time zone. 56 examples were put in order, in which 17 examples of class C, 23 examples of class R and 16 examples of class RC were sorted by the number 1–56. It can be known from the figure that the standard deviation of the results is high in the time zone of early peak, but the target values (distribution cost and time window deviation) are at a low level. The standard deviation of the results is low in the time zone of evening peak, but the target values of the problem are at a high level. Both standard deviation and target values are centered in the time zone of mid peak.

The percentage of standard deviations of distribution costs.

The percentage of standard deviations of time windows.
It can be concluded that: (1) The earlier disturbance event occurs, the distribution route can be more flexible. Otherwise, it will become less flexible. (2) In the same time zone, the standard deviation in class R is lower than that in class C, and the standard deviation in class RC is in the middle of them. That is to say, the distribution route in class R is more flexible than that in class C. (3) No matter what kind of problem under any time zone, the distribution cost and time window deviation in non-dominated optimal solution set can be controlled within 5% when the algorithm is run for 10 times, which verifies the robustness of the proposed algorithm.
In order to verify the effectiveness of the proposed algorithm, the researcher used the above example in Section 4.1. The result of the comparison between the proposed algorithm and BFOA HBCA(Hybrid bee colony algorithm) [24]. It is solved using the BFOA, HBCA and the QBFO in this paper respectively and the number of iterations is 100 times and 200 times. It can be seen from Fig. 5 that the speed of BFOA is the slowest, and the convergence speed of HBCA and QBFO are almost the same after 100 iterations. However, the speed of HBCA is significantly slower than that of QBFO after 200 iterations, and the QBFO is better than the other two algorithms.
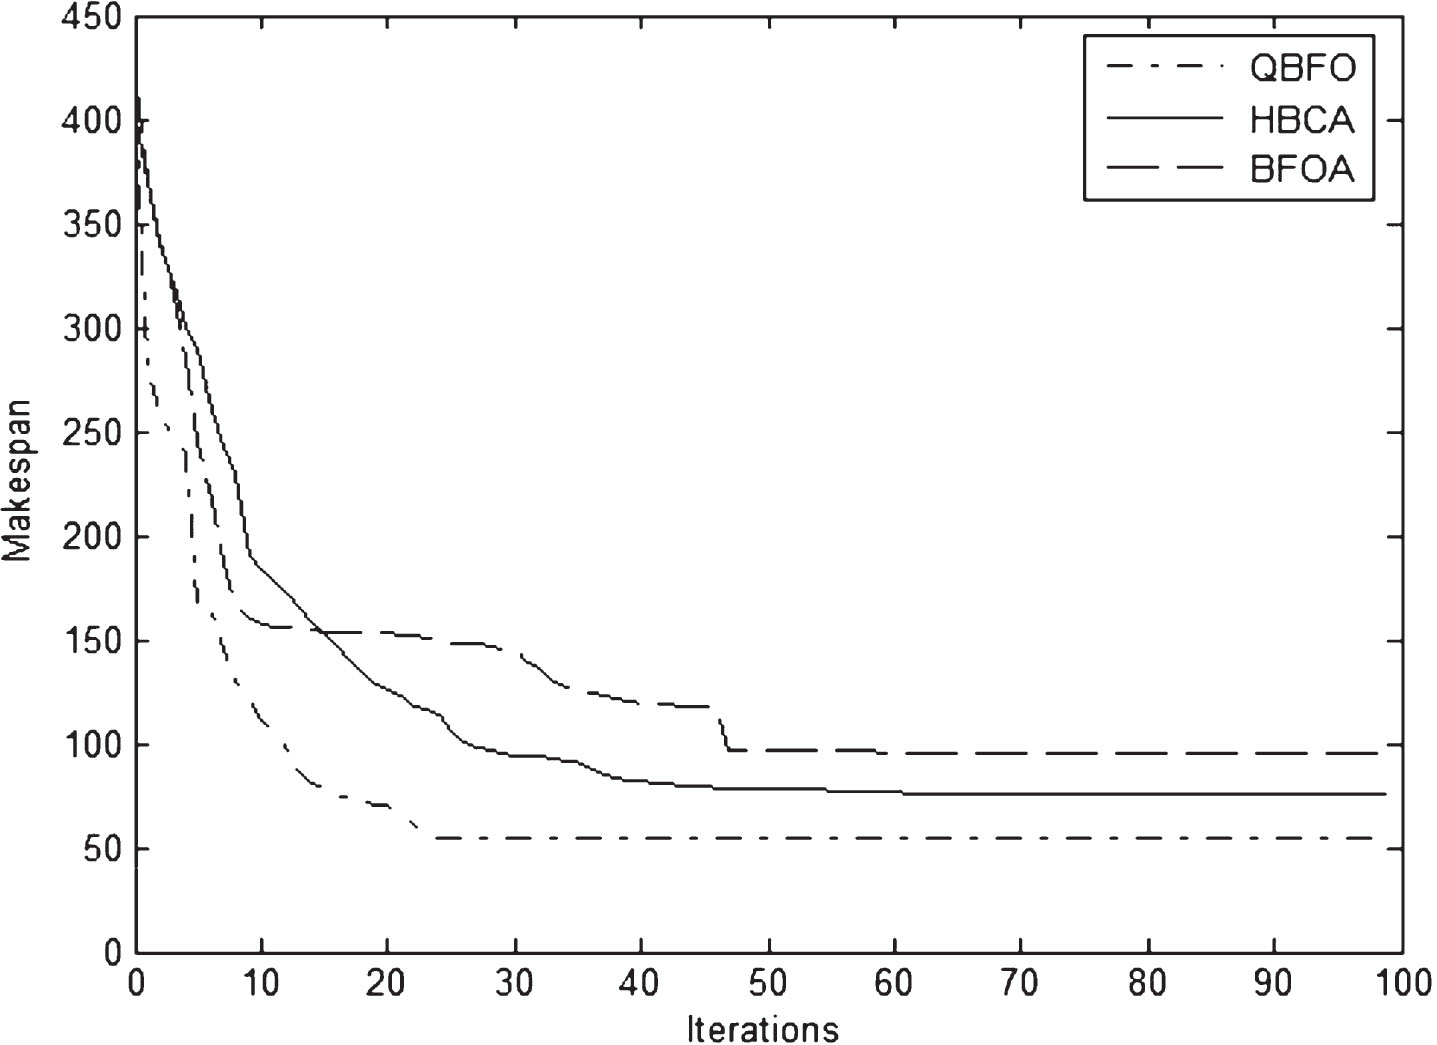
The comparison of the three algorithm.
In order to verify the efficiency of the proposed method deeply, a simulation experiment is designed in this paper, which includes one distribution yard, 4 dynamic demand information and 21 static demand information, and the distribution area is 50×50 (units: km). The numbers of the dynamic demand points and static demand points are a, b, c, d and 1, 2, ... , 21. It is assumed that the demand of each customer is not more than 2m3, the maximum delivery capacity of each vehicle is 8 m3, the maximum distance is 200 km, and the coordinate of distribution center is (25 km, 25 km). The demand information is shown in Tables 1 and 2.
Dynamic demand information
Dynamic demand information
Static demand information
When the dynamic events occur at the point of a, b, c or d, the three vehicles working according to the initial plan are at the point of 2, 7 and 20, that is, the disturbance factor set is {2, 7, 20}; at this time, the cargo capacity set of these above vehicles is {4.0, 0.5, 1.3}. After the new demand of customer c and d are added, the total load is more than the maximum load and distance, so a new vehicle numbered 4 is added. The disruption scheme using QBFO is shown in Table 3.
Disruption management scheduling scheme
Aiming at the disruption management of terminal logistics, prospect theory and operational research knowledge are combined in this paper.
Conclusions
Because the delivery time differs greatly from the customers’ psychological expectation time, the customers’ psychological disgust value will be increased, in this paper, measure of value function based on prospect theory and disruption management strategy related to customer psychological perception is proposed, which can quantify the psychological perception for the user to the terminal logistics time. Improved QBFO is proposed to optimize the above model and seek the optimal solution. Comparing to the global rescheduling method, the method of disruption management in this paper sacrifices less time window deviation to minimize the number of vehicles and distribution cost. Moreover, the results obtained by the proposed method are more practical.
Future directions
Considering the disturbance events may have an impact on the user’s psychological perception and satisfaction, therefore, how to insert the dynamic evolutionary scenario into the model to minimize the disturbance of the original scheduling strategy and improve logistics disruption management is the next research focus. Moreover, it would be important that in the future research attitudinal dimensions of the customers might impact in some way besides the expectation perspective [22].
Footnotes
Acknowledgments
This work is partially supported by Liaoning Provincial Natural Science Foundation of China (No.20180550499, 2019-ZD-0109) and Education Department Project of Liaoning Province (JDL2019022).