
Abstract
Multilevel thresholding is one of the effective image segmentation methods. However, it faces three big challenges: (1) how to adaptively determine the number of multiple thresholds; (2) how to overcome the sensitivity to image noise; (3) how to perform multilevel thresholding under several segmentation requirements. In order to solve these problems, an adaptive multilevel thresholding algorithm based on multiobjective artificial bee colony optimization (AMT-MABCO) segmentation is presented for noisy image in this paper. To improve the robustness of AMT-MABCO to image noise, a line intercept histogram which considers both the intensity and coordinate information in the neighborhood of the pixels is firstly utilized to define a novel between-class variance function as one fitness function. Then, an interval-valued fuzzy entropy function is constructed as another fitness function to deal with the blurred characteristic in images. AMT-MABCO tries to obtain a compromising multilevel thresholding result under these two segmentation requirements. To adaptively determine the number of thresholds, a grouping population initialization and evaluation strategies are proposed in AMT-MABCO. Furthermore, two novel search equations are constructed in AMT-MABCO to generate candidate solutions in the employed bees and onlookers phases, respectively. Experimental results show that AMT-MABCO outperforms state-of-the-art thresholding methods in noise robustness and segmentation performance.
Keywords
Introduction
Image segmentation is one of important and challenging steps in image processing and computer vision. It partitions an image into non-overlapping regions with homogenous characteristics [29]. Up to now, there have been various segmentation algorithms, such as thresholding techniques [11, 35], clustering algorithms [4, 13], region-based methods [26] and combination of some presented approaches [5, 34]. Due to its efficiency and simplicity, thresholding has been widely used in many real applications [14, 17]. It aims to determine a threshold for bi-level thresholding or several thresholds for multilevel thresholding for image segmentation. There are two main approaches to obtain thresholds: parametric and non-parametric. Parametric approaches estimate the statistical parameters of the classes in the image. They are always computationally expensive and time-consuming. Non-parametric approaches find the thresholds by optimizing some discriminating criterion. For example, Otsu’s method determines an optimal threshold by maximizing the between-class variance function [17, 24]. It is considered one of the most effective bi-level thresholding methods. However, Otsu’s method is very time-consuming when it is extended to multi-level thresholding. Similarly, most traditional thresholding methods also have this kind of problem. It is obvious that using traditional exhaustive methods to determine multiple thresholds is computational inefficient.
How to effectively determine multiple thresholds is very essential for thresholding segmentation methods. Swarm intelligence optimization approaches have gained a lot of attention in solving multilevel thresholding segmentation [1–3, 32]. Abido adopted artificial bee colony and entropy criterion to find the multilevel thresholds [23]. Akay employed artificial bee colony and particle swarm optimization to find the optimal multilevel thresholds under Kapur’s entropy and between-class variance functions [3]. Bhandari et al. presented a Tsallis entropy based multilevel thresholding for colored satellite image segmentation by using cuckoo search [1]. Suresh and Lal proposed a multilevel thresholding segmentation algorithm which incorporates Mantegna’s and McCulloch’s method for modeling levy flight [32]. Sarkar et al. employed differential evolution to perform multilevel thresholding segmentation by optimizing the fuzzy entropy function [31]. Bhandari et al. [2] applied cuckoo search, differential evolution, particle swarm optimization and wind driven optimization to solve the color image segmentation problem via multilevel thresholding, in which the between-class variance or Kapur’s entropy is used to evaluate solutions.
Existed multilevel thresholding methods based on swarm intelligence optimization have three big problems given as follows: 1) These approaches always need users to assign the number of multilevel thresholds. How to adaptively determine the number of multilevel thresholds is a big challenge for thresholding approaches. 2) These algorithms always perform image segmentation by optimizing a criterion function, which lead to the thresholding result only satisfying one segmentation requirement. How to perform thresholding segmentation under several segmentation requirements deserves further research. 3) These approaches are very sensitive to image noise due to not considering any spatial information in the image. Fewer improved algorithms have been developed to solve the above problems in the literature. Djerou et al. presented a multi-objective particle swarm optimization based automatic multilevel image thresholding algorithm [18]. It searches the optimal thresholds and the number of thresholds under three criteria: the between-class variance, minimum error criterion and entropy criterion. Unfortunately, the uniformity measure U [27] used in this method cannot effectively evaluate the quality of thresholding solution and eventually cannot determine the best number of thresholds. Yin and Wu proposed a multi-level thresholding method based on hybrid multi-objective particle swarm optimization by incorporating several intelligent search strategies [28]. It performs thresholding segmentation under the between-class variance or Kapur’s entropy. Similarly to the work of Ref. [18], this method also adopts the uniformity measure to select the optimal thresholds. Sarkar et al. proposed a multilevel thresholding method with decomposition-based multi-objective evolutionary optimization [30]. It adopts the cross entropy and Rényi entropy to determine the set of Pareto optimal solutions. The fuzzy index [22] is employed in this method to find the best thresholding solution from the Pareto optimal solution set. Especially, these approaches are still sensitive to image noise due to not utilizing any image spatial information in the multi-level thresholding process with multi-objective optimization.
In order to automatically determine the thresholding number, consider many segmentation requirements, and overcome the influence of image noise at the same time, an adaptive multilevel thresholding algorithm based on multiobjective artificial bee colony optimization (AMT-MABCO) is proposed for noisy image segmentation in this paper. To overcome the sensitivity of image noise, a novel between-class variance function based on a line intercept histogram, which is considering both the intensity and coordinate information in the neighborhood of the pixel, is defined as one fitness function. Further, an interval-valued fuzzy entropy function is constructed as another fitness function to deal with the blurred characteristic in images. The proposed method tries to perform a compromising multilevel thresholding result under these two segmentation requirements. A grouping population initialization strategy based on Kent-mapping is proposed to obtain an initialized population with a good diversity. The population of AMT-MABCO consists of several grouping populations according to the number of thresholds. Two different search equations are used in AMT-MABCO to generate candidate solutions in the employed bee phase and the onlookers phase, respectively. In the final generation of AMT-MABCO, each grouping population evolves a non-dominated solution set. Solutions from different grouping populations have different number of thresholds. In order to adaptively determine the optimal multilevel thresholds for the image, a grouping population evaluation strategy is proposed in AMT-MABCO to evaluate the non-dominated solutions from all the grouping populations. Experimental results show that the proposed method not only can adaptively obtain the proper number of thresholds, but also can achieve satisfactory thresholding segmentation results on images corrupted by noise. A flowchart of AMT-MABCO is given in Fig. 1.
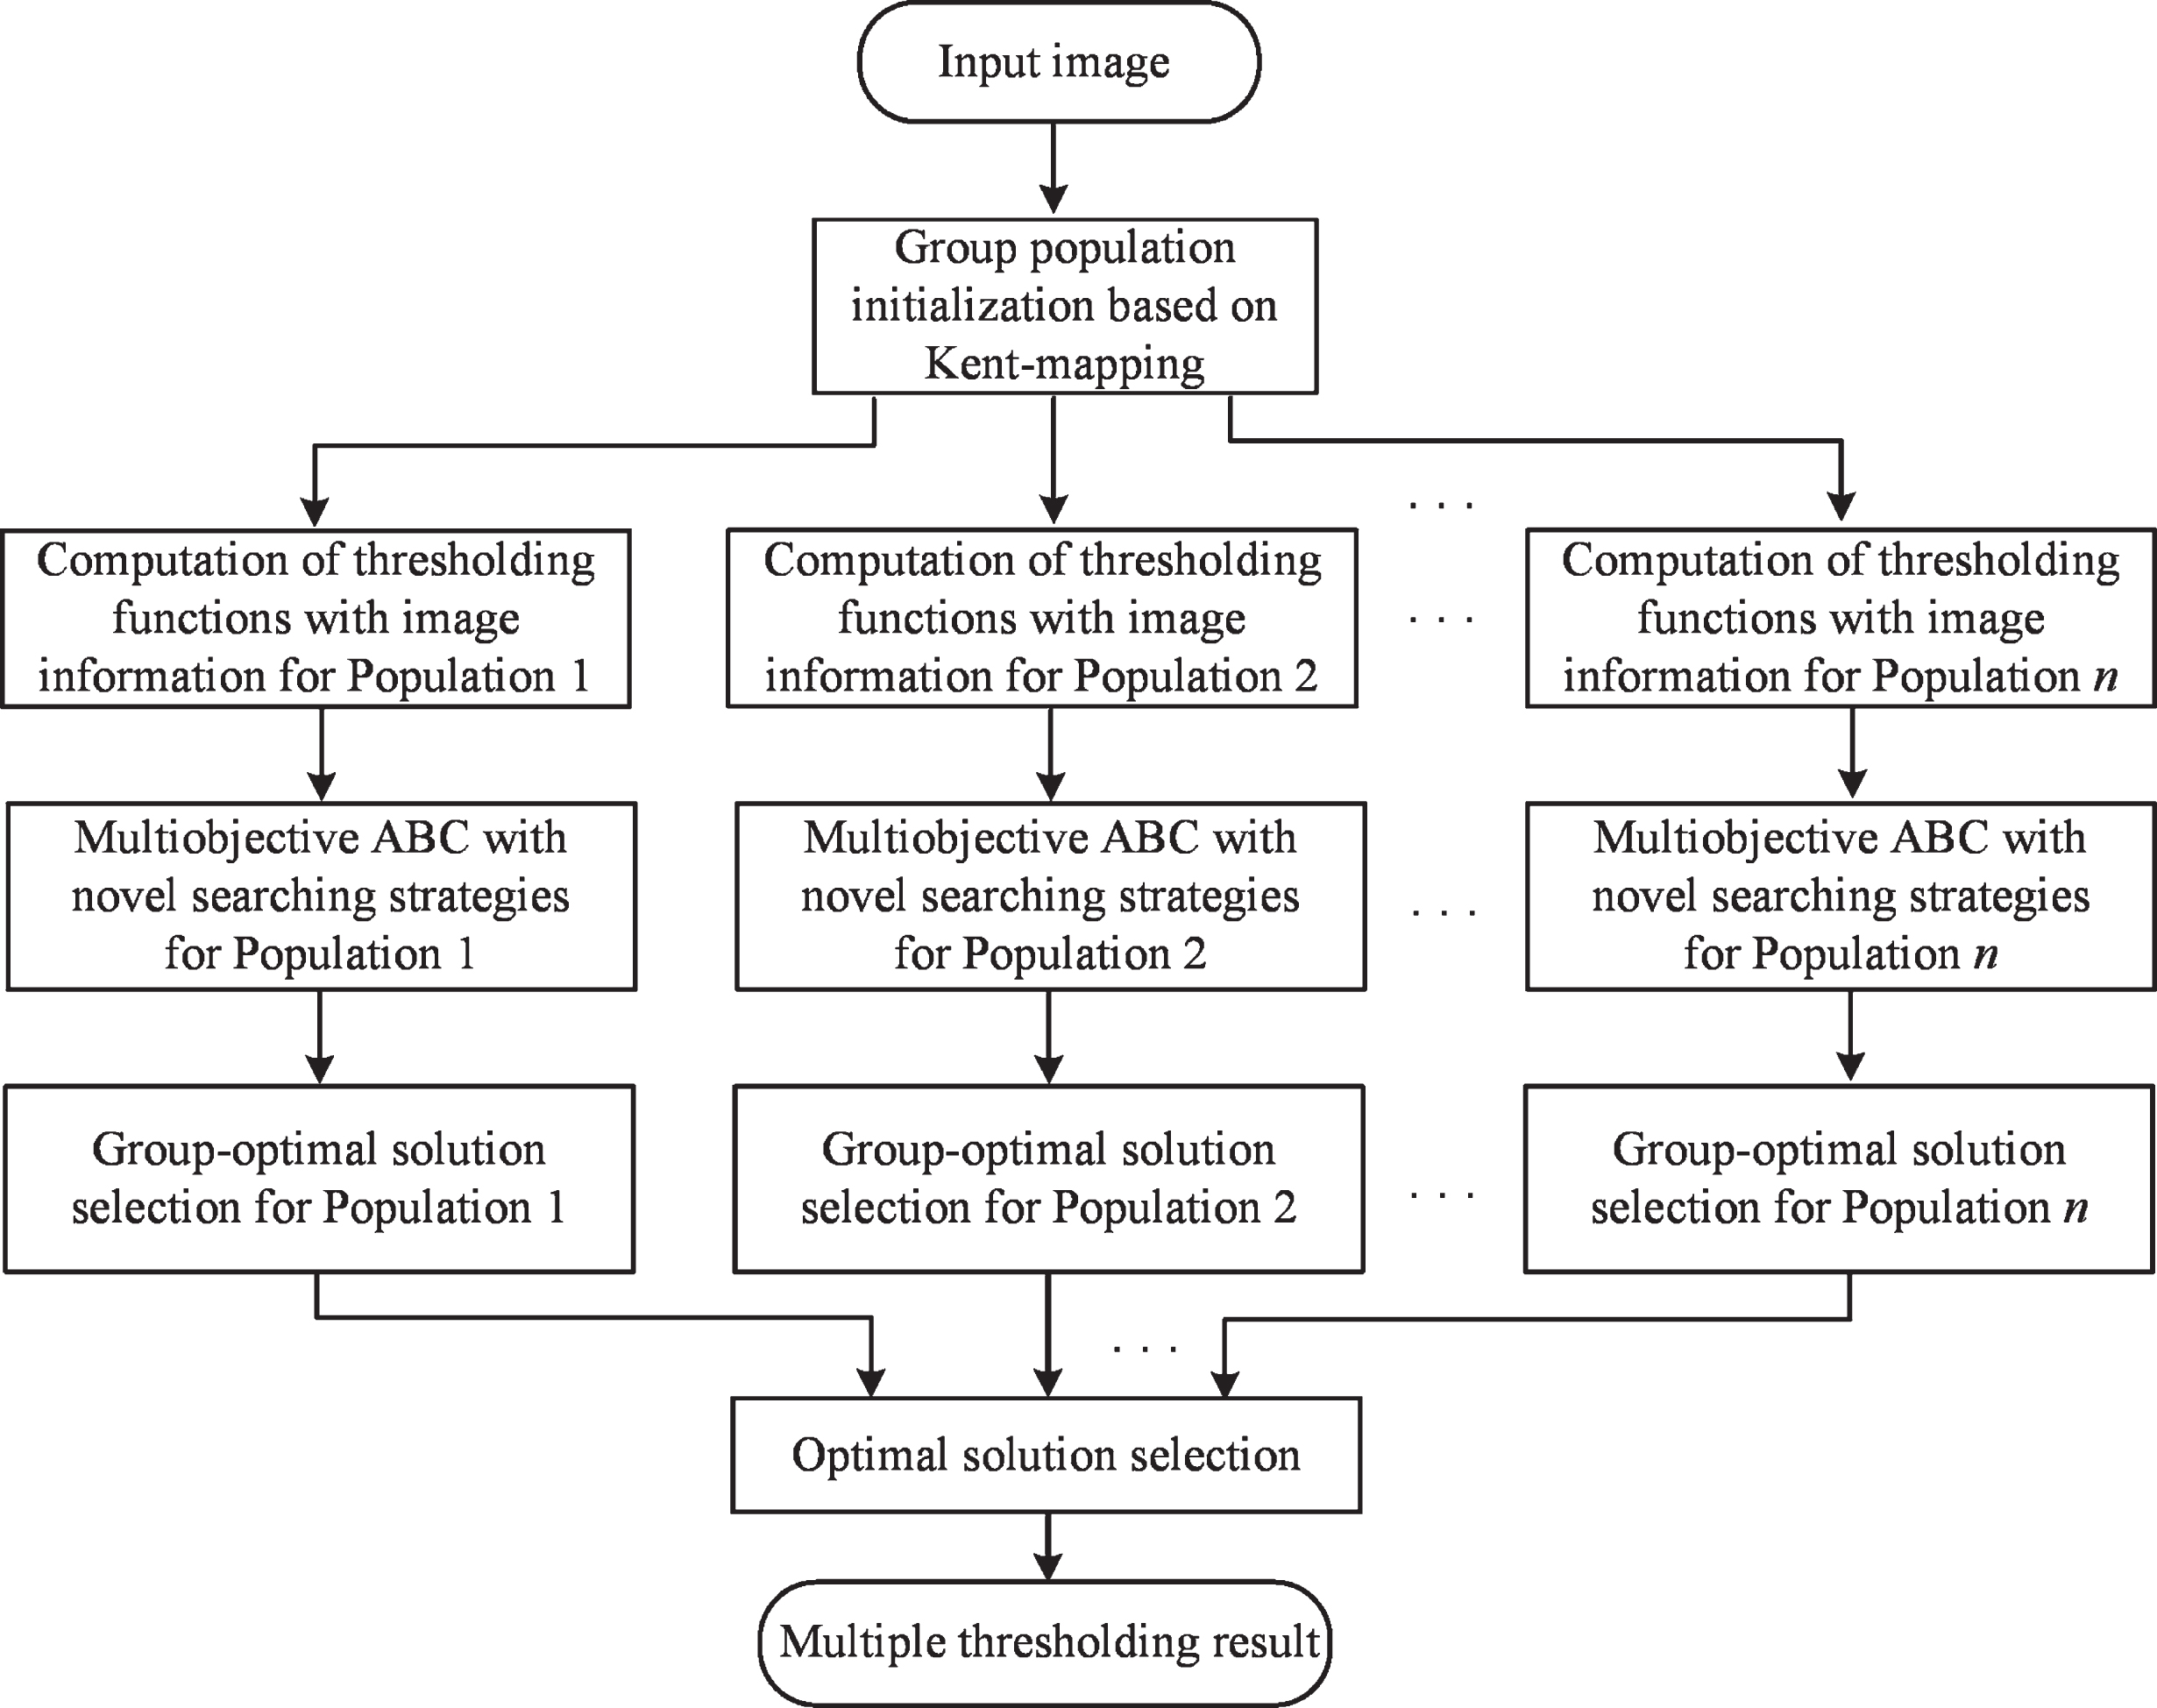
Flowchart of AMT-MABCO.
The rest of this paper is organized as follows. Section 2 reviews the classic artificial bee colony optimization algorithm. Section 3 introduces the proposed AMT-MABCO method in detail. Then AMT-MABCO is verified by experiments on synthetic and real images in Section 4. Finally, Section 5 gives some concluding remarks and discussions.
Artificial bee colony (ABC) proposed by Karaboga is a numerical function optimization algorithm which simulates the foraging behavior of honey bee swarm [7]. The position of a food source represents an available solution to the optimization problem, and the nectar amount of the food source denotes the fitness value of the solution. In ABC, there are three types of honey bees used to search food: employed bees, onlookers and scouts. The employed bees search available food sources and meanwhile pass their food information to the onlooker bees. The onlookers select good food sources from those found by the employed bees and then further search the foods around the selected food source. The scouts are translated from a few employed bees. When the quality of a food source is not improved through a predetermined number of cycles, its responsible employed bee abandons the food source and becomes a scout to search a new food source.
For an initialized population with s
n
solutions, each solution
After the initialization, ABC goes into the updated process. It is repeated with the search stages of employed bees, onlooker bees and scout bees. For a solution
If a solution does not change over a predetermined number of iterations, its responsible employed bee abandons this solution and becomes a scout. Then the scout produces a new solution according to Equation (1).
Thresholding criterion functions with multiple image information
AMT-MABCO adopts the following multi-objective optimization model [16]:
It is known that two dimensional (2-D) histogram based thresholding methods outperform one dimensional (1-D) histogram based methods on segmenting images corrupted by noise due to considering more image information. However, 2-D histogram brings a huge computational cost for thresholding methods. The line intercept histogram [37] can reserve the advantage of 2-D histogram while decrease the computational cost by converting the computation from 2-D histogram into 1-D histogram. In AMT-MABCO, a novel line intercept histogram which considers the intensity and coordinate information in the neighborhood of the pixel is constructed and used to define the between-class variance function f
LIV
. The line intercept histogram is calculated by utilizing the median filtered image and the linear weighted sum image of the original image. The linear weighted sum image is obtained by using the method in Ref. [33]. (i,j) denotes two-tuple consisting of the gray level of the pixel in the median filtered image and the gray level of the corresponding pixel in the linear weighted sum image, respectively. i + j = l denotes a line which is vertical to the principal diagonal of 2-D histogram and with the line intercept equal to l. Then the line intercept histogram is constructed as: N
l
denotes the frequency of i + j = l and its probability p
l
= N
l
/N where N is the number of pixels in the image. The between-class variance function f
LIV
based on this constructed linear intercept histogram not only can overcome the effect of image noise, but also can decrease the computational cost compared to the thresholding methods using 2-D histogram. f
LIV
is calculated as follows:
The interval-valued fuzzy entropy function f
IFE
is defined as:
Solutions in AMT-MABCO denote the multilevel thresholds for segmenting an image. Each bit in the solution represents a threshold value which is an integer in [0, 255]. For example, a solution with n thresholds is encoded as follows:
A grouping population initialization strategy based on Kent-mapping is proposed in AMT-MABCO to obtain an initialized population. The population consists of several grouping populations with the same size according to the number of thresholds. The grouping population with n thresholds can be termed as
After the initialization, AMT-MABCO goes into the updated process. For each grouping population, the updated process is repeated with the search stages of employed bees, onlooker bees and scout bees.
Employed bee phase
It is known that exploration and exploitation are two necessary and contradictory aspects for the population-based evolutionary algorithms. The exploration refers to the ability to investigate the unknown regions in the solution space to discover the global optimum, and the exploitation reflects the ability to utilize the knowledge of previous good solutions to search better solutions, respectively [9, 12]. In order to utilize the previous good solutions and meanwhile get rid of trapping in a local optimal area, a non-uniform search equation is designed for the employed bee stage as follows:
In AMT-MABCO, each onlooker bee chooses a food source to be updated depending on the probability P
u
given as follows:
For a solution does not change over a predetermined number of cycles in AMT-MABCO, its responsible employed bee abandons this solution and then becomes a scout. The scout will search a new solution according to Equation (11).
Grouping population evaluation for determining the multilevel thresholds
In AMT-MABCO, each grouping population evolves a non-dominated solution set. A grouping population evaluation strategy is proposed to determine the multilevel thresholds. A weighted ratio R of between-class variation and intra-class variation proposed in Ref. [36] is first applied to determine the group-optimal solution for each grouping population. Then an optimal solution for AMT-MABCO is determined by comparing all group-optimal solutions. These solutions are evaluated by computing a differential function R Δ of R. The group-optimal solution with the biggest R Δ value is optimal for AMT-MABCO and the corresponding number of thresholds is also considered to be optimal. In this way, AMT-MABCO can adaptively determine the number of multilevel thresholds.
The weighted ratio R of a solution x
i
is computed as follows:
A differential function of R
n
of a group-optimal solution with n thresholds is calculated as follows:
In order to verify the efficiency of AMT-MABCO, Otsu thresholding algorithm [24], Entropy thresholding approach [15], Differential Evolution based thresholding algorithm (DE) [31], artificial bee colony-based thresholding technique (ABC) [3] and multi-objective particle swarm optimization-based thresholding algorithm (MPSO) [18] are performed as comparative methods. Otsu and entropy algorithms determine the multilevel thresholds by optimizing the between-class variance and entropy functions in an exhaustive search manner, respectively. DE method performs multilevel thresholding segmentation by optimizing the fuzzy entropy function. ABC algorithm optimizes the between-class variance function to perform multi-level thresholding segmentation. MPSO method considers to search the optimal thresholds under three criteria: the entropy, between-class variance and minimum error functions. AMT-MABCO and MPSO can automatically evolve the number of thresholds under a predetermined maximum threshold number nmax, but the other four methods need users to assign the threshold number in advance. For experimental images with benchmark, the true threshold numbers of images are given to these four methods. For experimental images without benchmark, the appropriate threshold numbers of images are given to these four methods. The respective parameters for all the methods are presented in Table 1. The probability P e and the maximum threshold mutation number t m are two unique parameters for AMT-MABCO. A detail analysis of P e , and t m is given in Section 4.1.
Methods and their parameters setting
Methods and their parameters setting
In this section, we focus on the discussion about the effects of the probability P
e
and the maximum threshold mutation number t
m
on the performance of AMT-MABCO. P
e
is tested from 0 to 1 with the increment 0.1, and t
m
is tested from 5 to 50 with the increment 5. White Gaussian noise with normalized variance 0.01 and Salt & Pepper noise with noise density 0.03 are added to two synthetic images, respectively. Figure 2 presents the curved surfaces of segmentation accuracy (SA) [25] of AMT-MABCO with the variations of P
e
, and t
m
on these noisy images. SA is defined as follows:
These SA curved surfaces reveal that the performance of AMT-MABCO cannot be influenced by the values of P e and t m . In the following experiments, the probability P e and the maximum threshold mutation number t m of AMT-MABCO are assigned to 0.5 and 30, respectively.
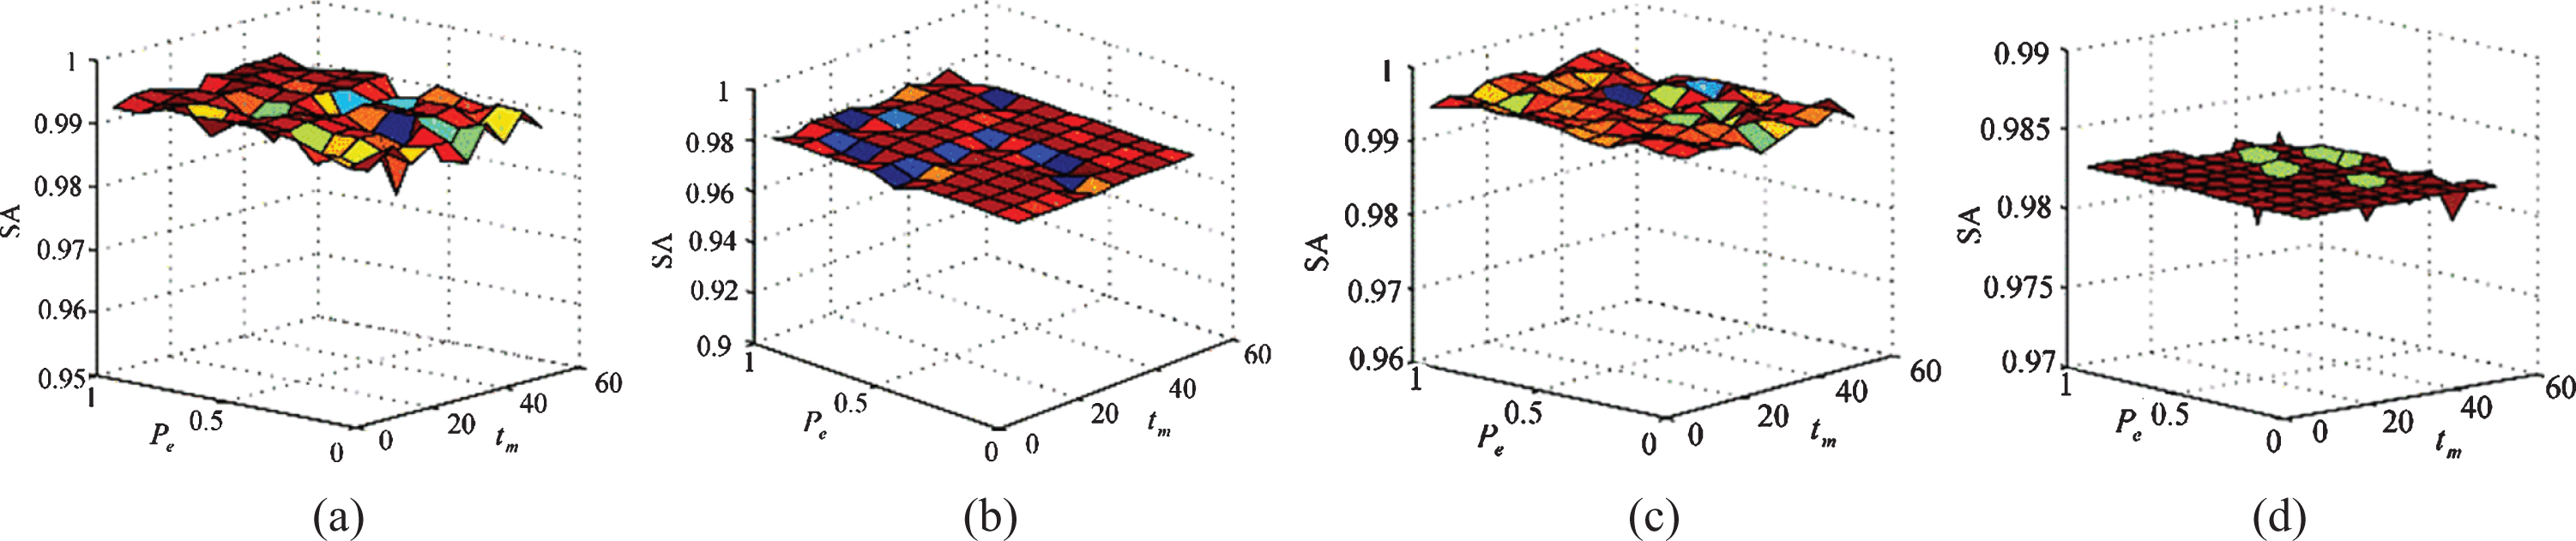
Clustering accuracy values against the probability P e and the maximum threshold mutation number t m on synthetic images: (a) Syn1 with Gaussian noise; (b) Syn1 with Salt & Pepper noise; (c) Syn2 with Gaussian noise; (d) Syn2 with Salt & Pepper noise.
Two synthetic images used in Section 4.1 are adopted to testify the performance of AMT-MABCO and comparative methods in this section. The SA values of these methods are shown in Table 2. It reveals that AMT-MABCO outperforms the other methods on these two synthetic images. Figures 3–6 show the visual segmentation results of all the methods on these two images. These visual segmentation results indicate that AMT-MABCO can not only determine the correct threshold numbers, but also obtain better segmentation results than the other methods on these images corrupted by noise.
Comparison of AMT-MABCO with state-of-the-art methods on synthetic images
Comparison of AMT-MABCO with state-of-the-art methods on synthetic images
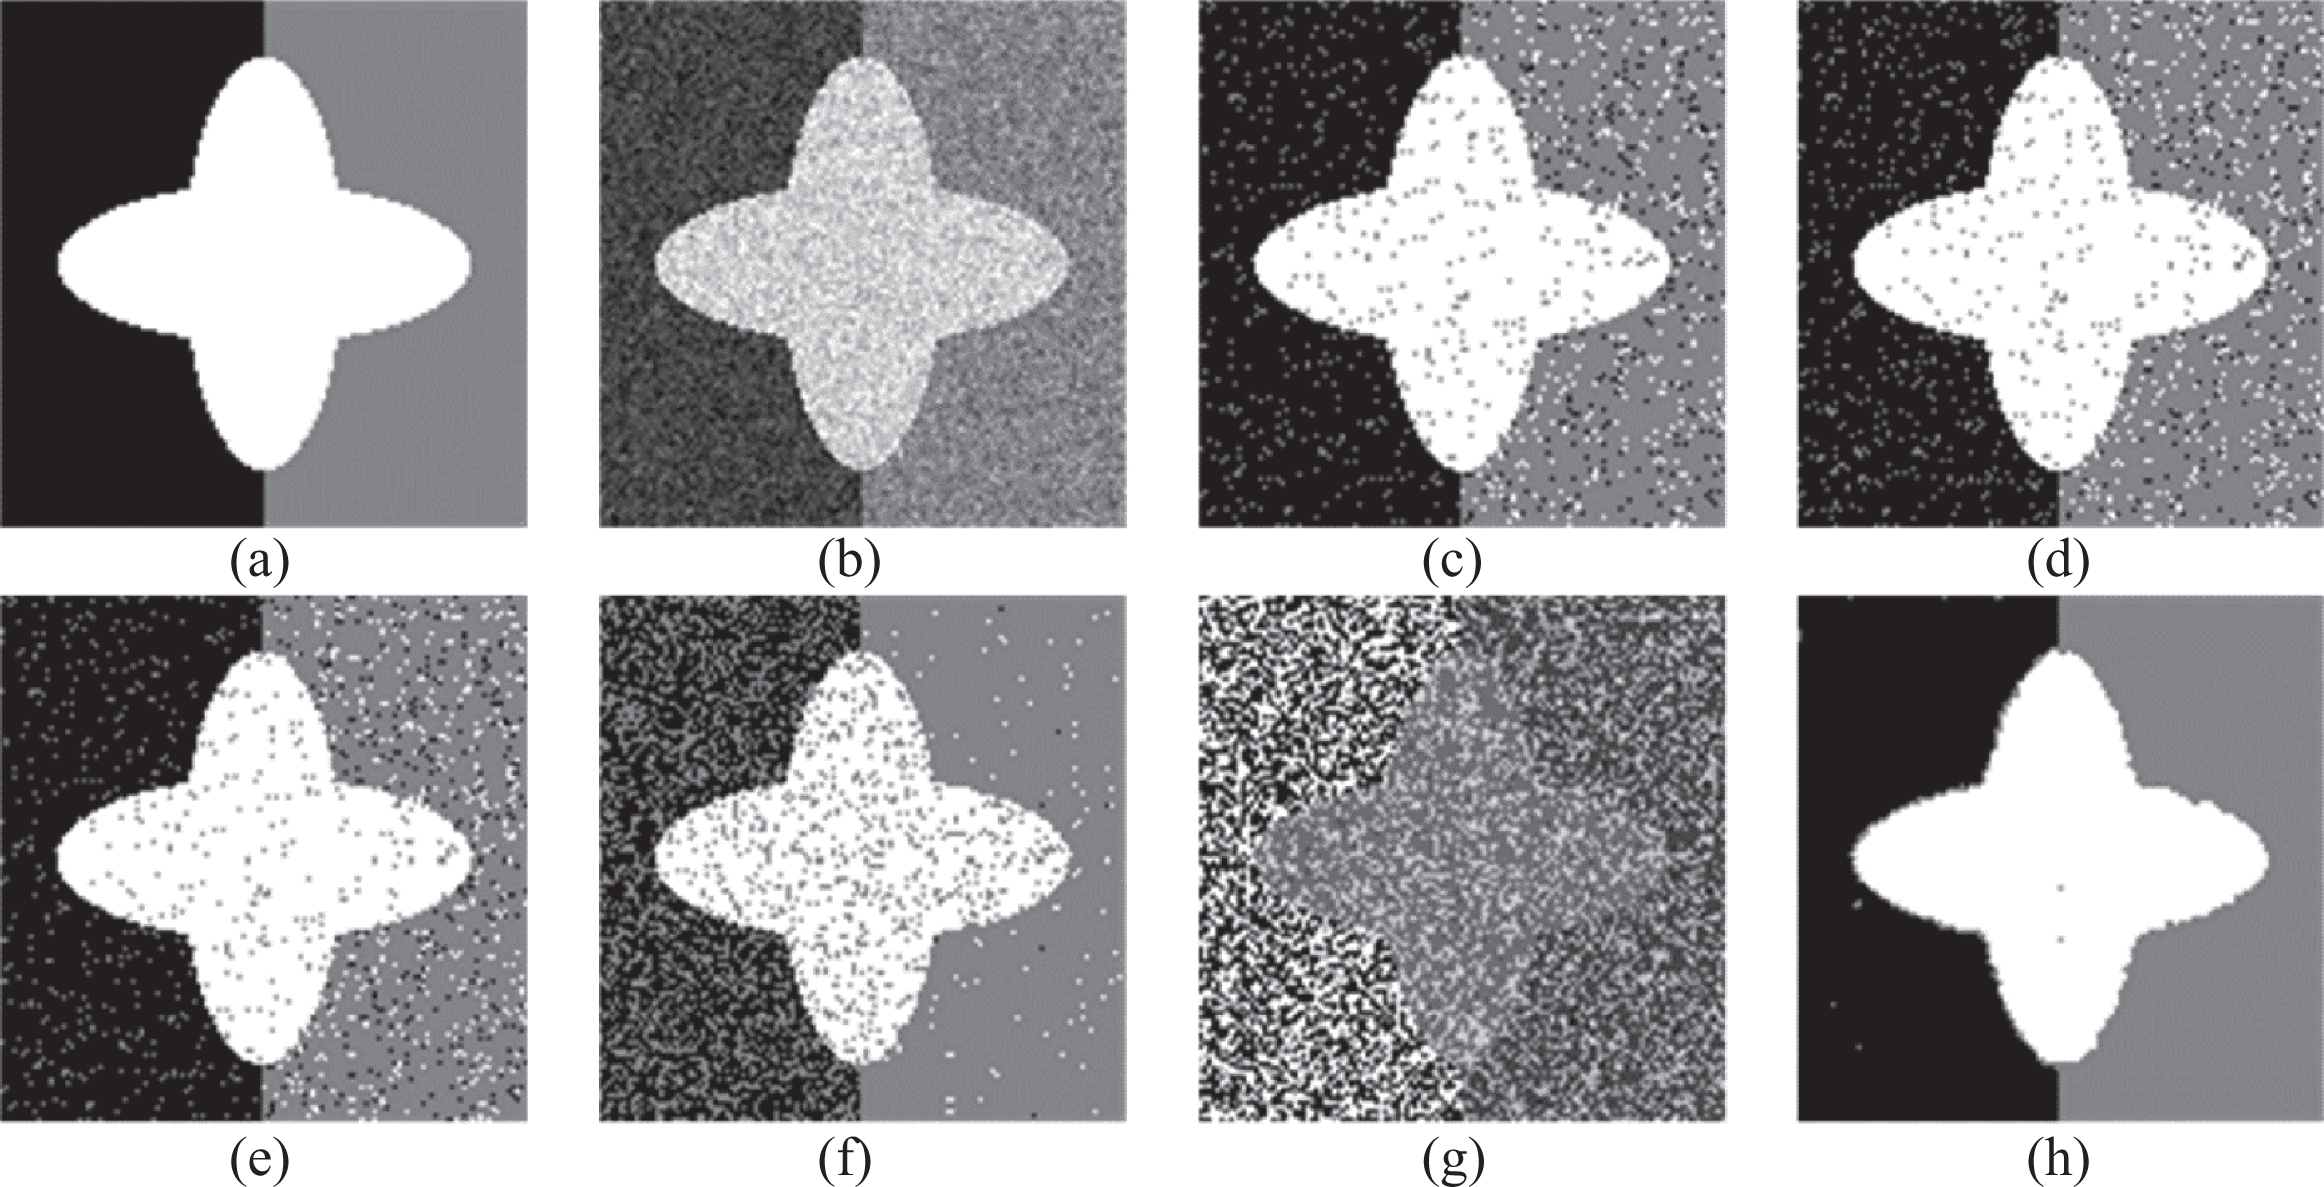
Segmentation results on Syn1 corrupted by Gaussian noise: (a) original image; (b) noisy image; (c) Otsu; (d) Entropy; (e) ABC; (f) DE; (g) MPSO; (h) AMT-MABCO.
Segmentation results on Syn1 corrupted by Salt & Pepper noise: (a) noisy image (b) Otsu; (c) Entropy; (d) ABC; (e) DE; (f) MPSO; (g) AMT-MABCO.
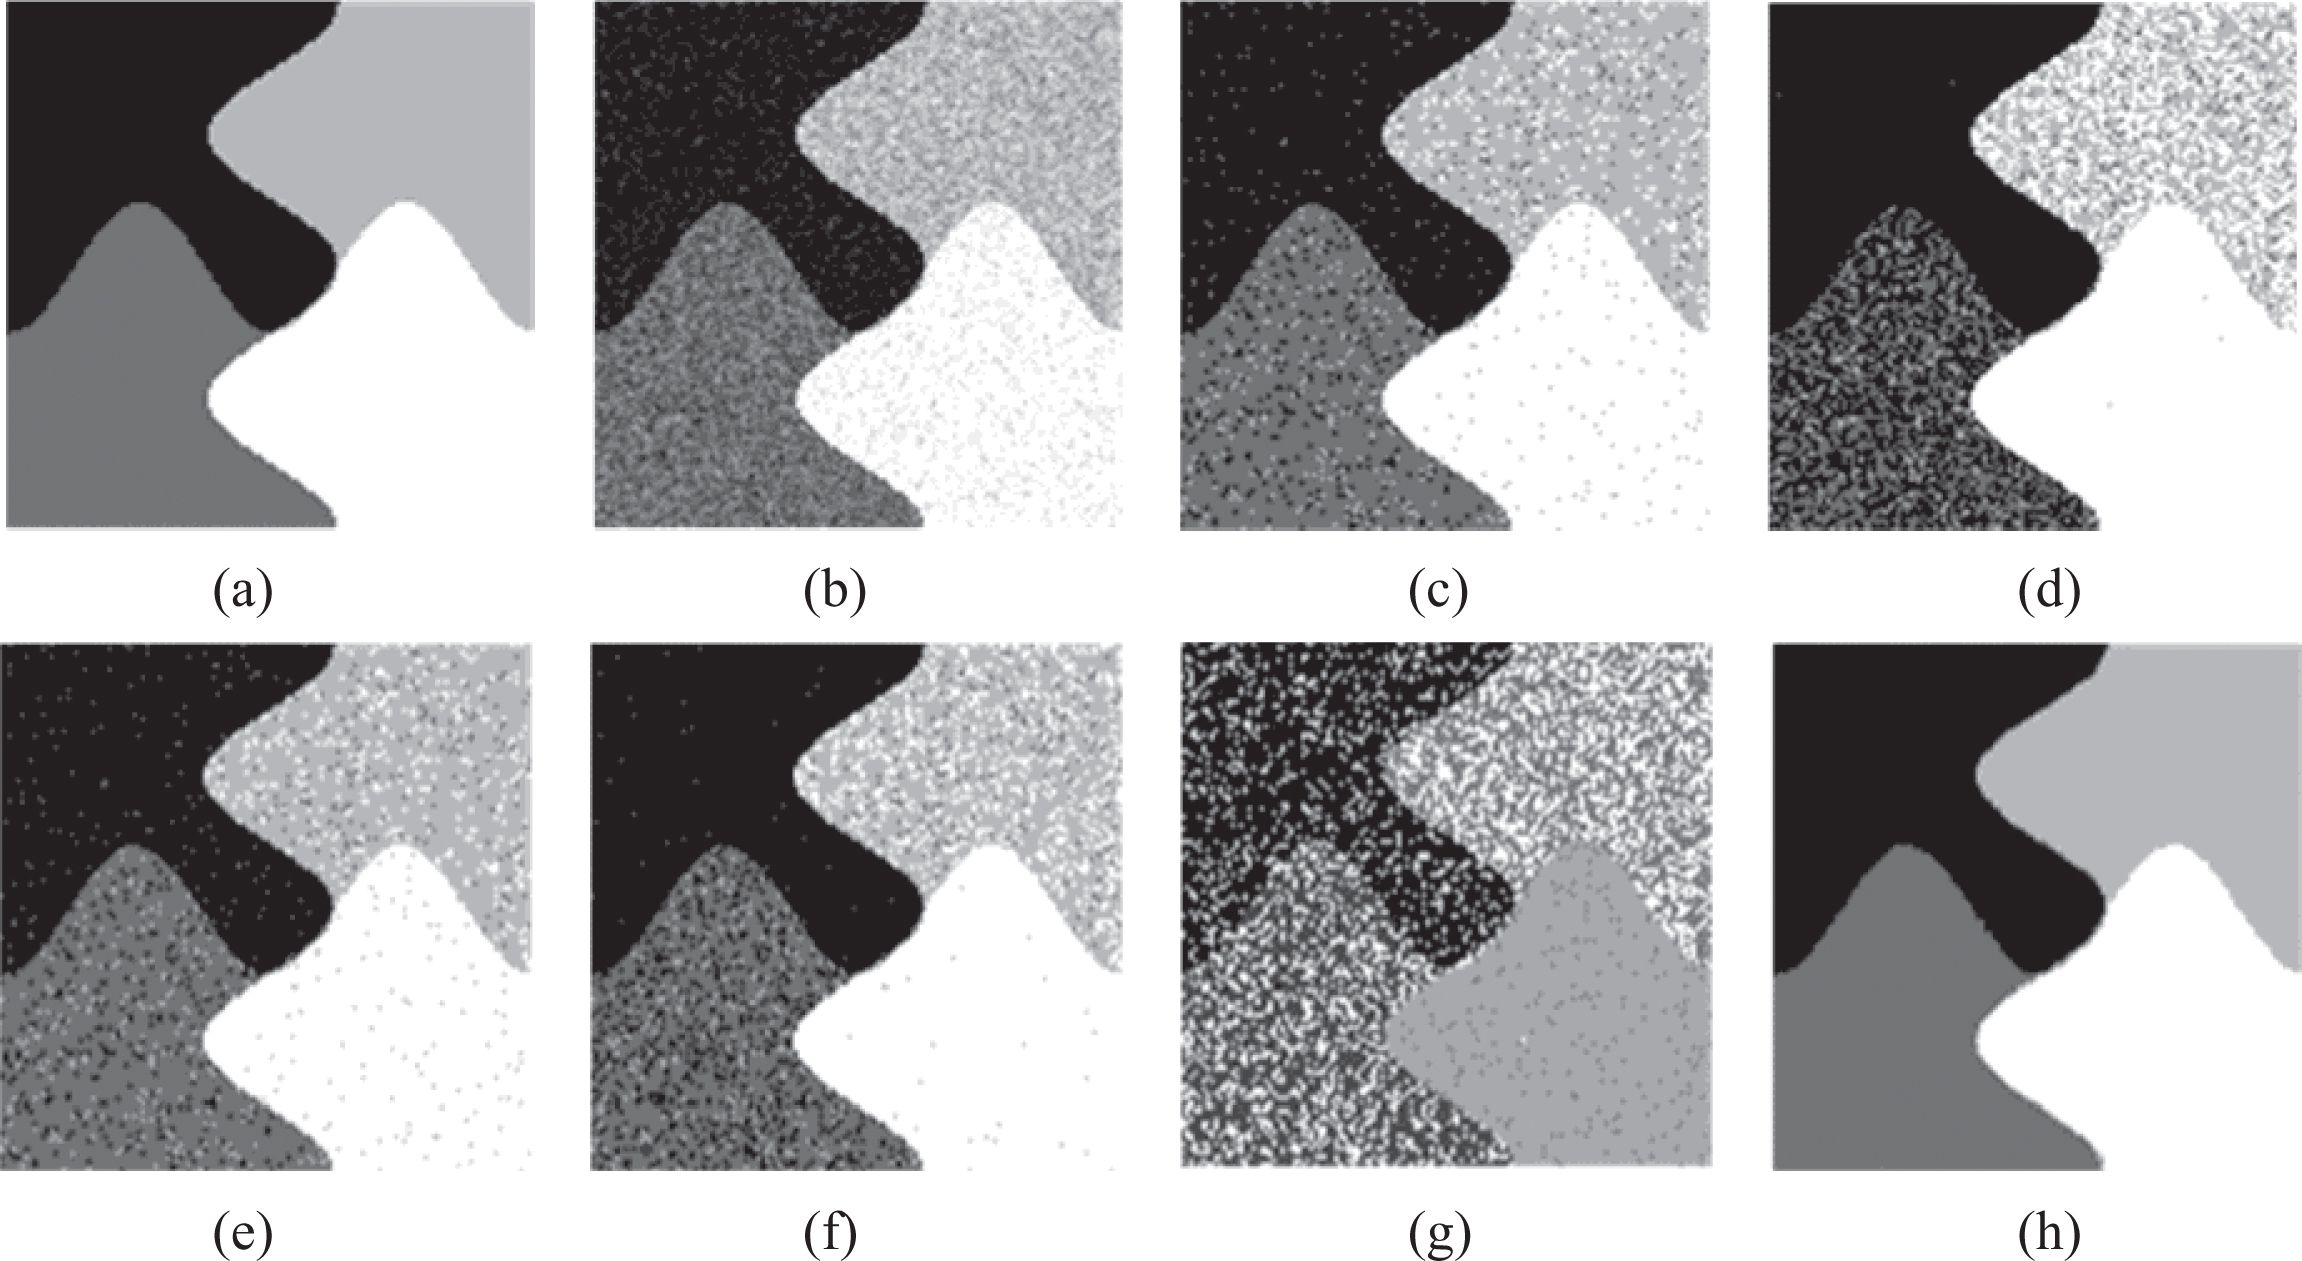
Segmentation results on Syn2 corrupted by Gaussian noise: (a) original image; (b) noisy image; (c) Otsu; (d) Entropy;(e) ABC; (f) DE; (g) MPSO; (h) AMT-MABCO.
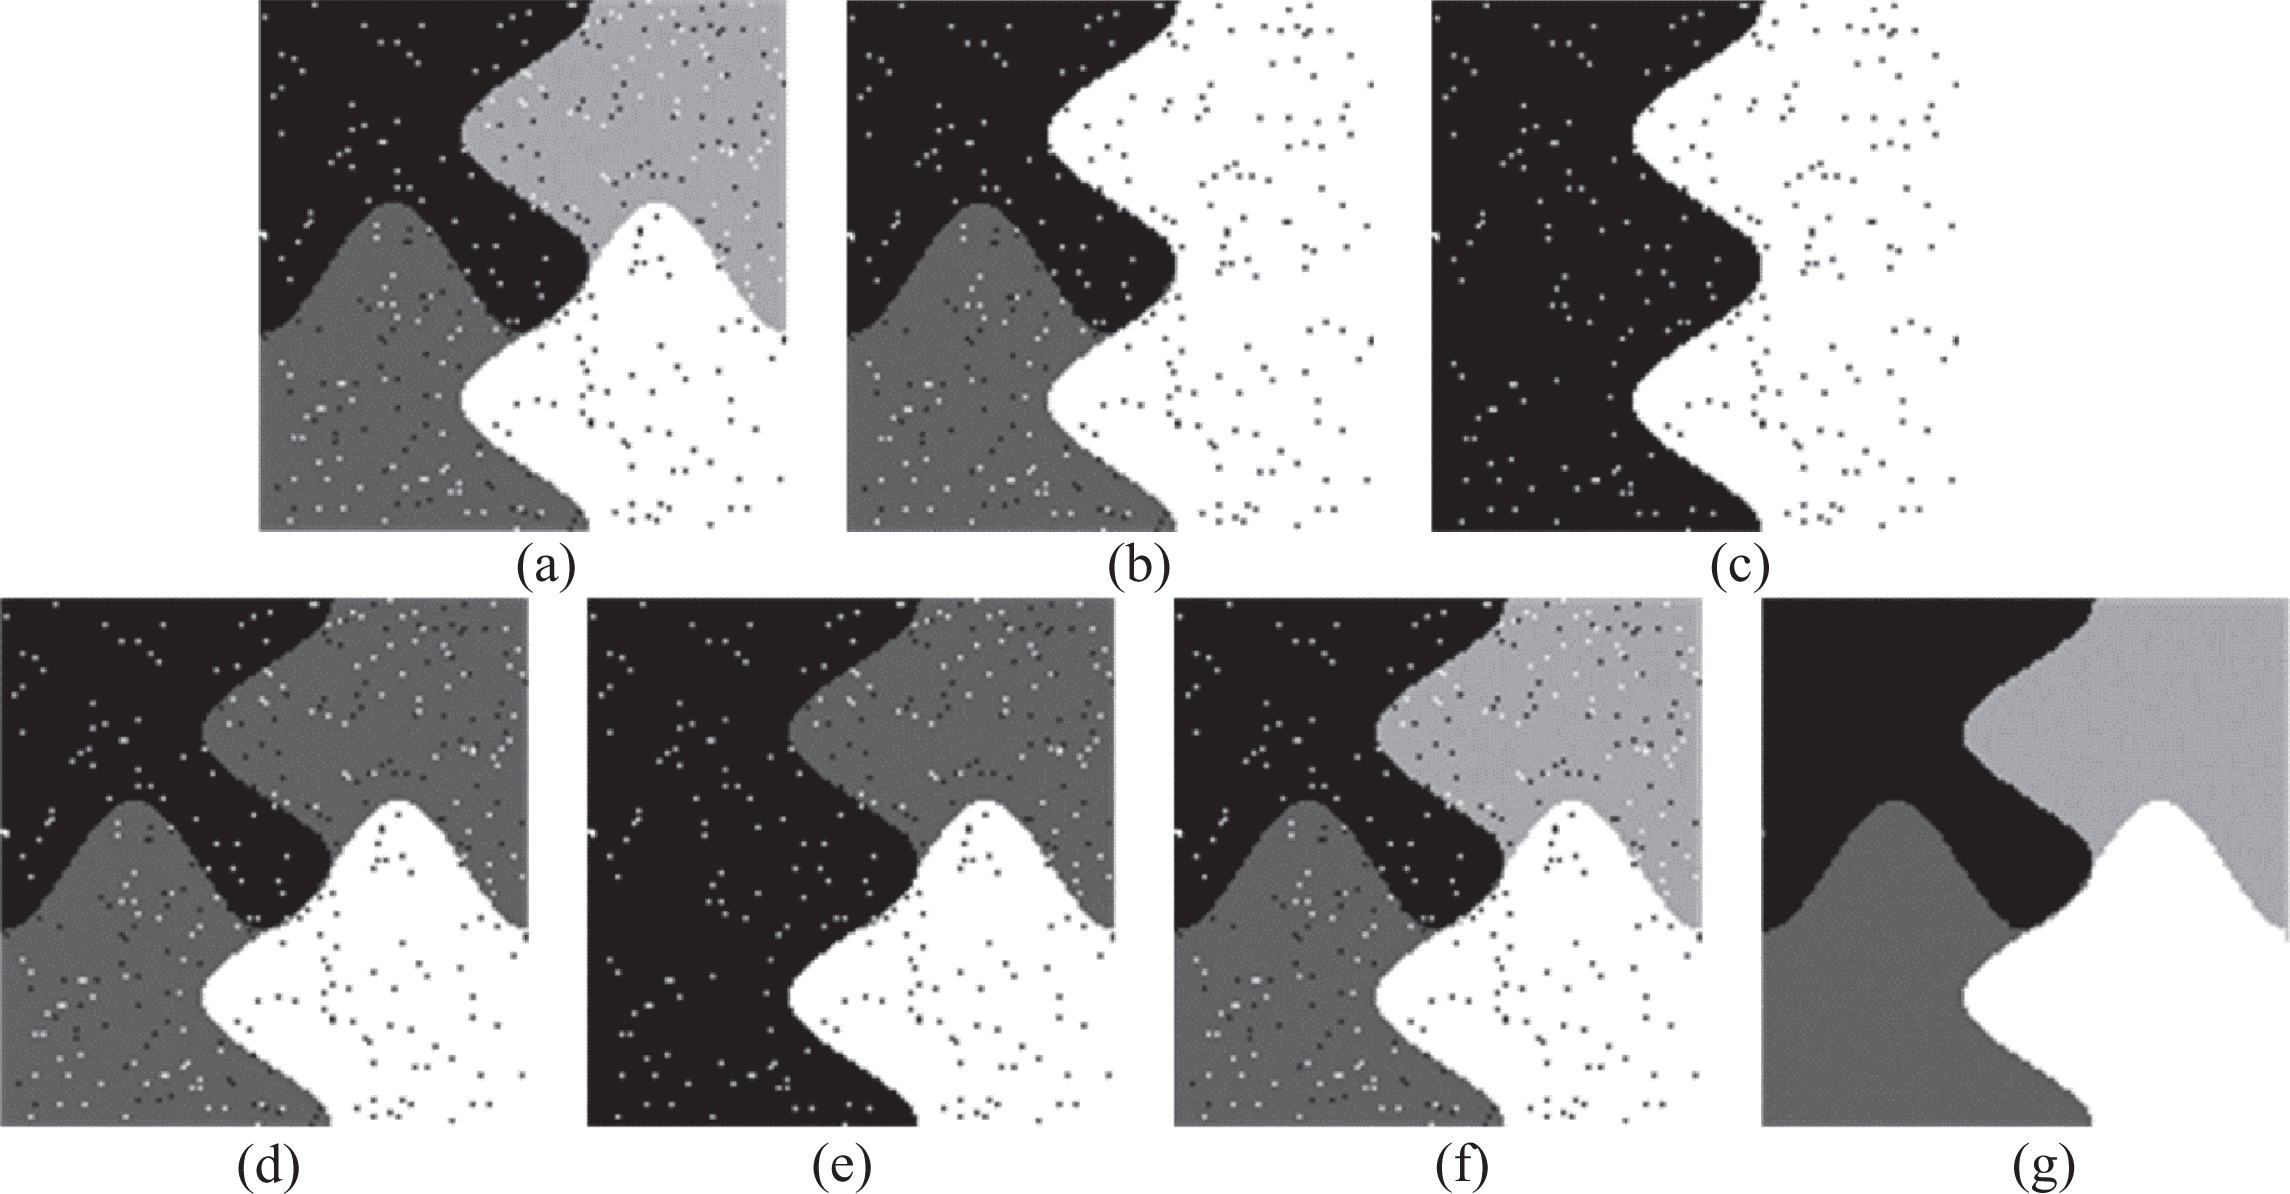
Segmentation results on Syn2 corrupted by Salt & Pepper noise: (a) noisy image (b) Otsu; (c) Entropy; (d) ABC; (e) DE; (f) MPSO; (g) AMT-MABCO.
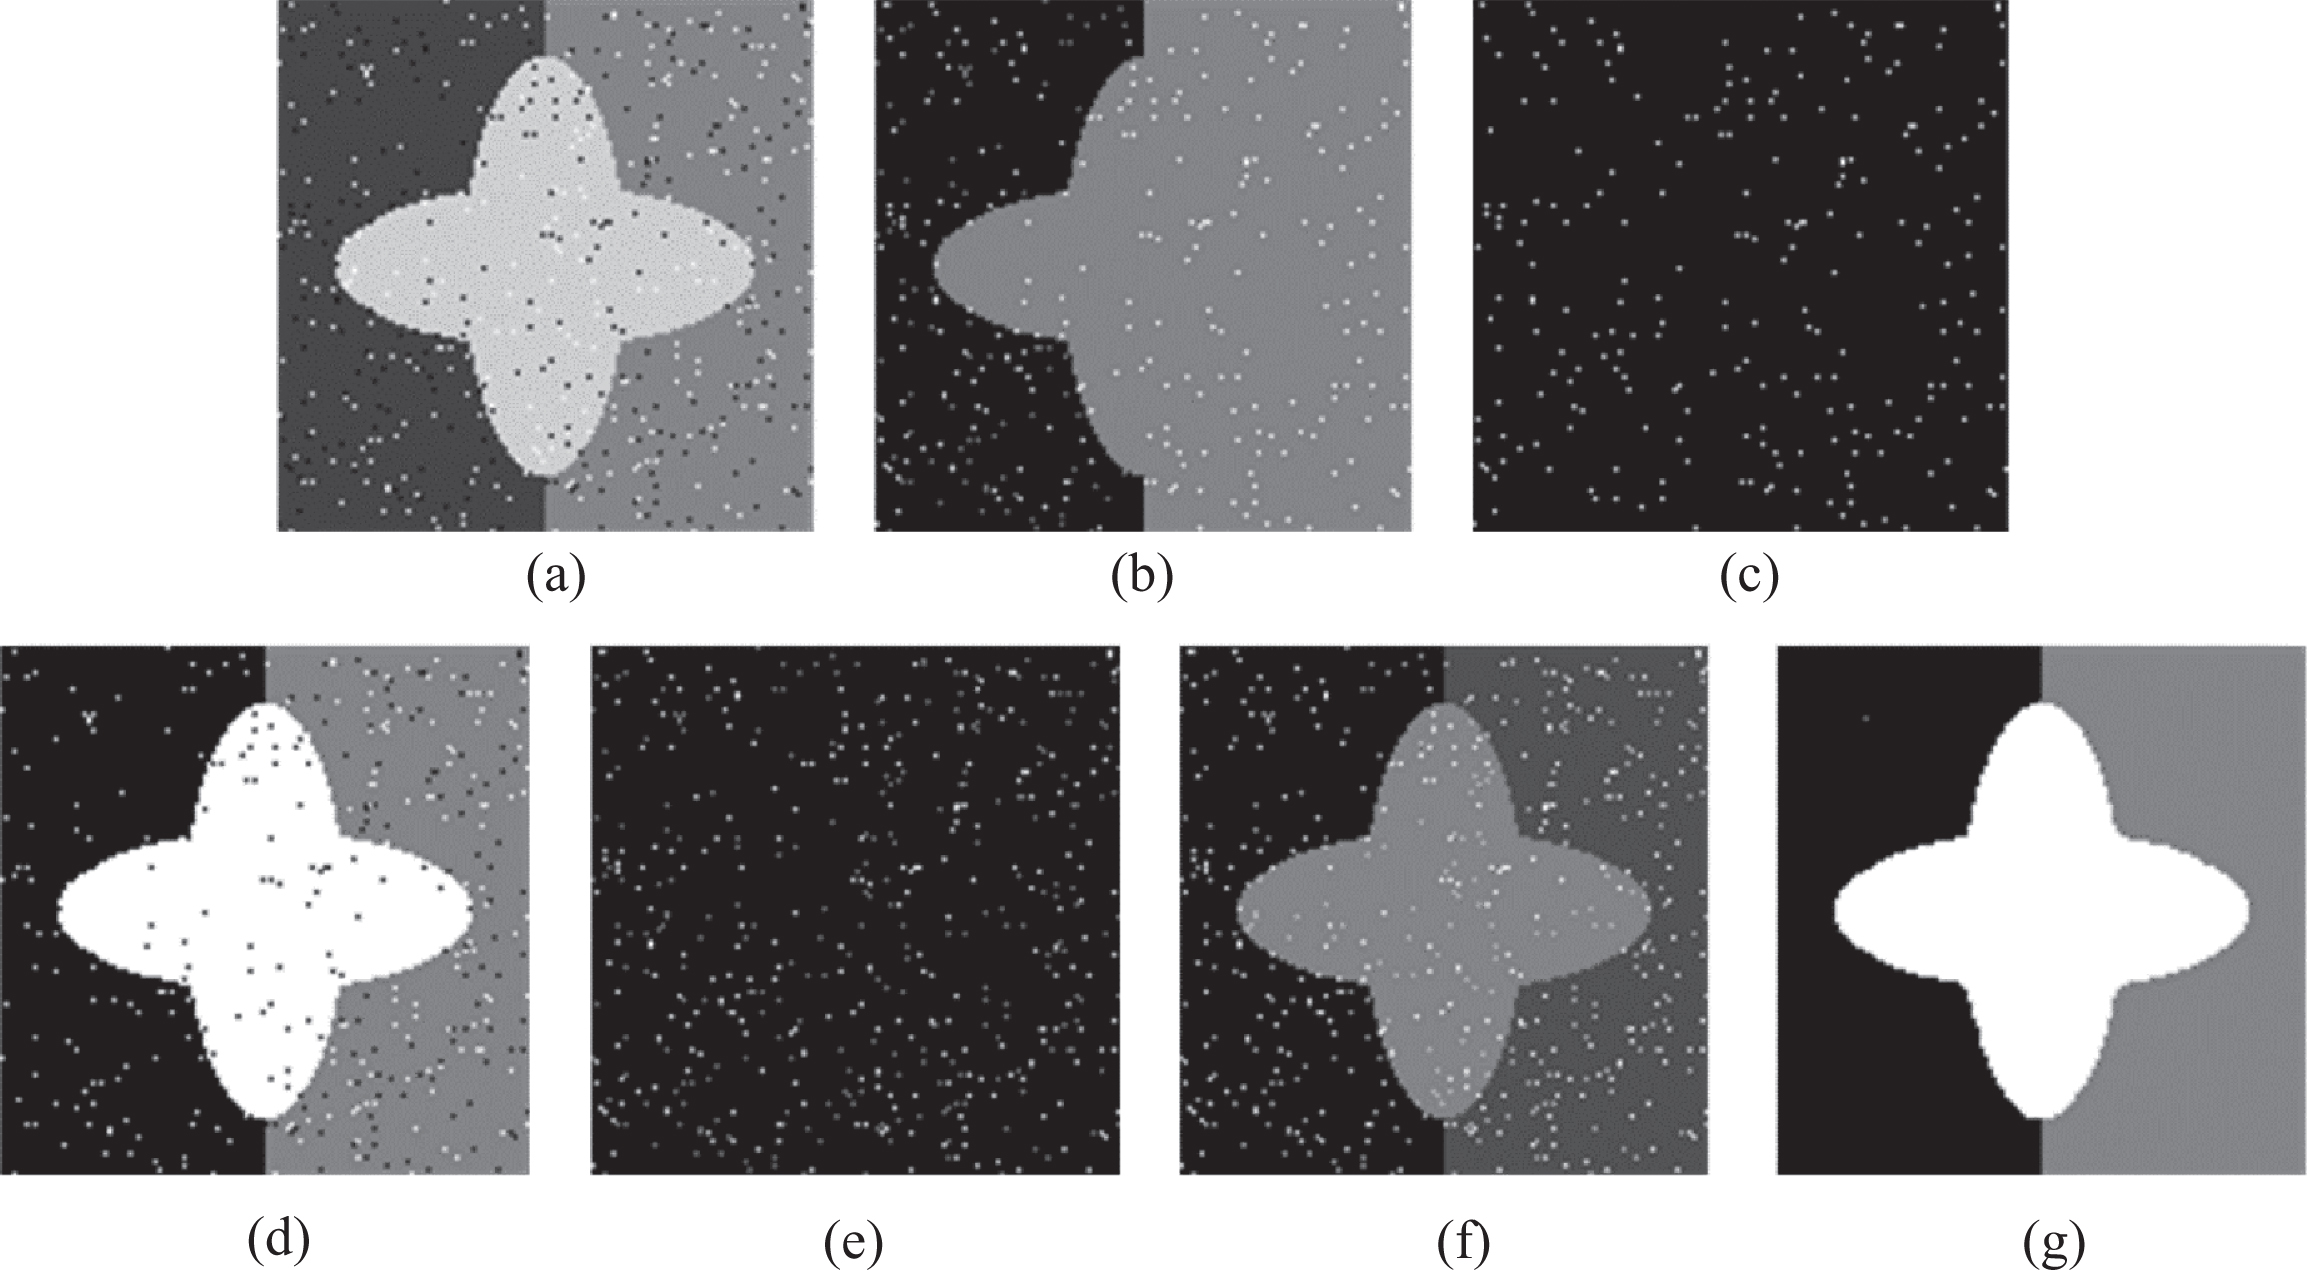
In this section, AMT-MABCO and the comparative methods are applied to segment real images which are selected from Berkeley Segmentation Dataset [21]. Firstly, White Gaussian noise, Salt & Pepper noise, and Speckle noise are added to these Berkeley images, respectively. The noise intensity and SA results of these methods on these noisy images are presented in Tables 3–5. For #3096, DE method can only obtain the highest SA value when the strength of noise is lowest. Tables 3–5 show that AMT-MABCO outperforms the other methods on most images, even though the correct threshold numbers of Otsu, Entropy, DE and ABC are given by users. It should be pointed out that SA values of MPSO are always not satisfying because of the obtained wrong thresholds numbers. #15088 and #241004 shown in Fig. 7 are utilized to show the visual segmentation results of all the methods. The corresponding results are presented in Figs. 8–13. These visual segmentation results reveal that AMT-MABCO behaves well in the threshold numbers determination and segmentation performance on these images corrupted by noise.
Comparison of AMT-MABCO with state-of-the-art methods on Berkeley images corrupted by Gaussian white noise with different noise intensity
Comparison of AMT-MABCO with state-of-the-art methods on Berkeley images corrupted by Gaussian white noise with different noise intensity
Comparison of AMT-MABCO with state-of-the-art methods on Berkeley images corrupted by Salt & Pepper noise with different noise intensity
Comparison of AMT-MABCO with state-of-the-art methods on Berkeley images corrupted by Speckle noise with different noise intensity
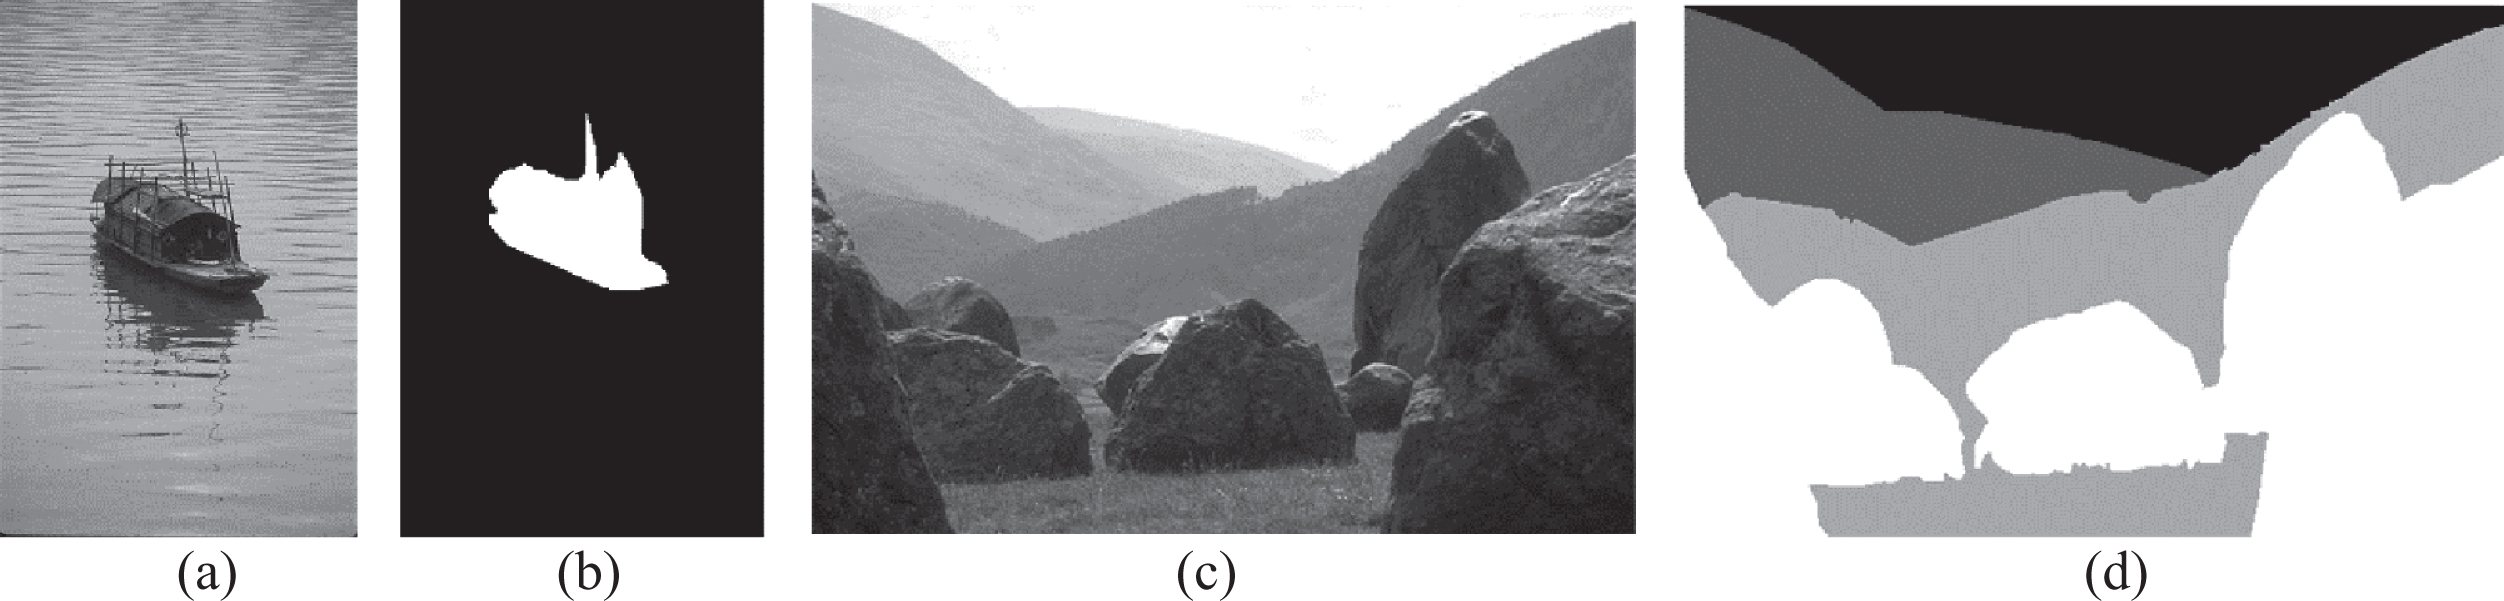
Berkeley images: (a) #15088, (b) #241004, (c) ground truth of #15088, (d) ground truth of #241004.
Segmentation results on #15088 corrupted by Gaussian noise (0, 0.005): (a) noisy image (b) Otsu; (c) Entropy; (d) ABC; (e) DE; (f) MPSO; (g) AMT-MABCO.
Segmentation results on #15088 corrupted by Salt & Pepper noise (0.03): (a) noisy image (b) Otsu; (c) Entropy; (d) ABC; (e) DE; (f) MPSO; (g) AMT-MABCO.

Segmentation results on #15088 corrupted by Speckle noise (0.01): (a) noisy image (b) Otsu; (c) Entropy; (d) ABC; (e) DE; (f) MPSO; (g) AMT-MABCO.

Segmentation results on #241004 corrupted by Gaussian noise (0, 0.005): (a) noisy image (b) Otsu; (c) Entropy; (d) ABC; (e) DE; (f) MPSO; (g) AMT-MABCO.

Segmentation results on #241004 corrupted by Salt & Pepper noise (0.03): (a) noisy image (b) Otsu; (c) Entropy; (d) ABC; (e) DE; (f) MPSO; (g) AMT-MABCO.

Segmentation results on #241004 corrupted by Speckle noise (0.01): (a) noisy image (b) Otsu; (c) Entropy; (d) ABC; (e) DE; (f) MPSO; (g) AMT-MABCO.
In addition, the performances of AMT-MABCO under mixed noise environments are assessed in this section. Three cases of Mixed noise include case 1 (Gaussian (0.01) and salt&pepper (0.01)), case 2 (Gaussian (0.01) and speckle (0.01)), and case 3 (Speckle (0.01) and salt&pepper (0.01)). SA values of all methods are presented in Table 6. From this table, our proposed method obtain the highest SA values except for the image #3096 corrupted by Gaussian (0.01) and salt&pepper (0.01) mixed noise. Therefore, the segmentation results show that our proposed method (AMT-MABCO) can outperform the others in most cases. Moreover, 25 images are selected from Berkeley Segmentation Dataset and corrupted by above mixed noise to further verify the proposed method. The average segmentation accuracy of all comparison methods on these 25 noisy images are shown in Fig. 14. It can found from this figure that AMT-MABCO performs the best segmentation on mixed noisy images among all the methods.
Comparison of AMT-MABCO with state-of-the-art methods on Berkeley images corrupted by Mixed noise with different noise intensity

The average segmentation accuracy of all comparison methods on 25 noisy images. (a) Gaussian (0.01) and Salt&Pepper (0.01); (b) Gaussian (0.01) and Speckle (0.01); (c) Speckle (0.01) and Salt&Pepper (0.01).
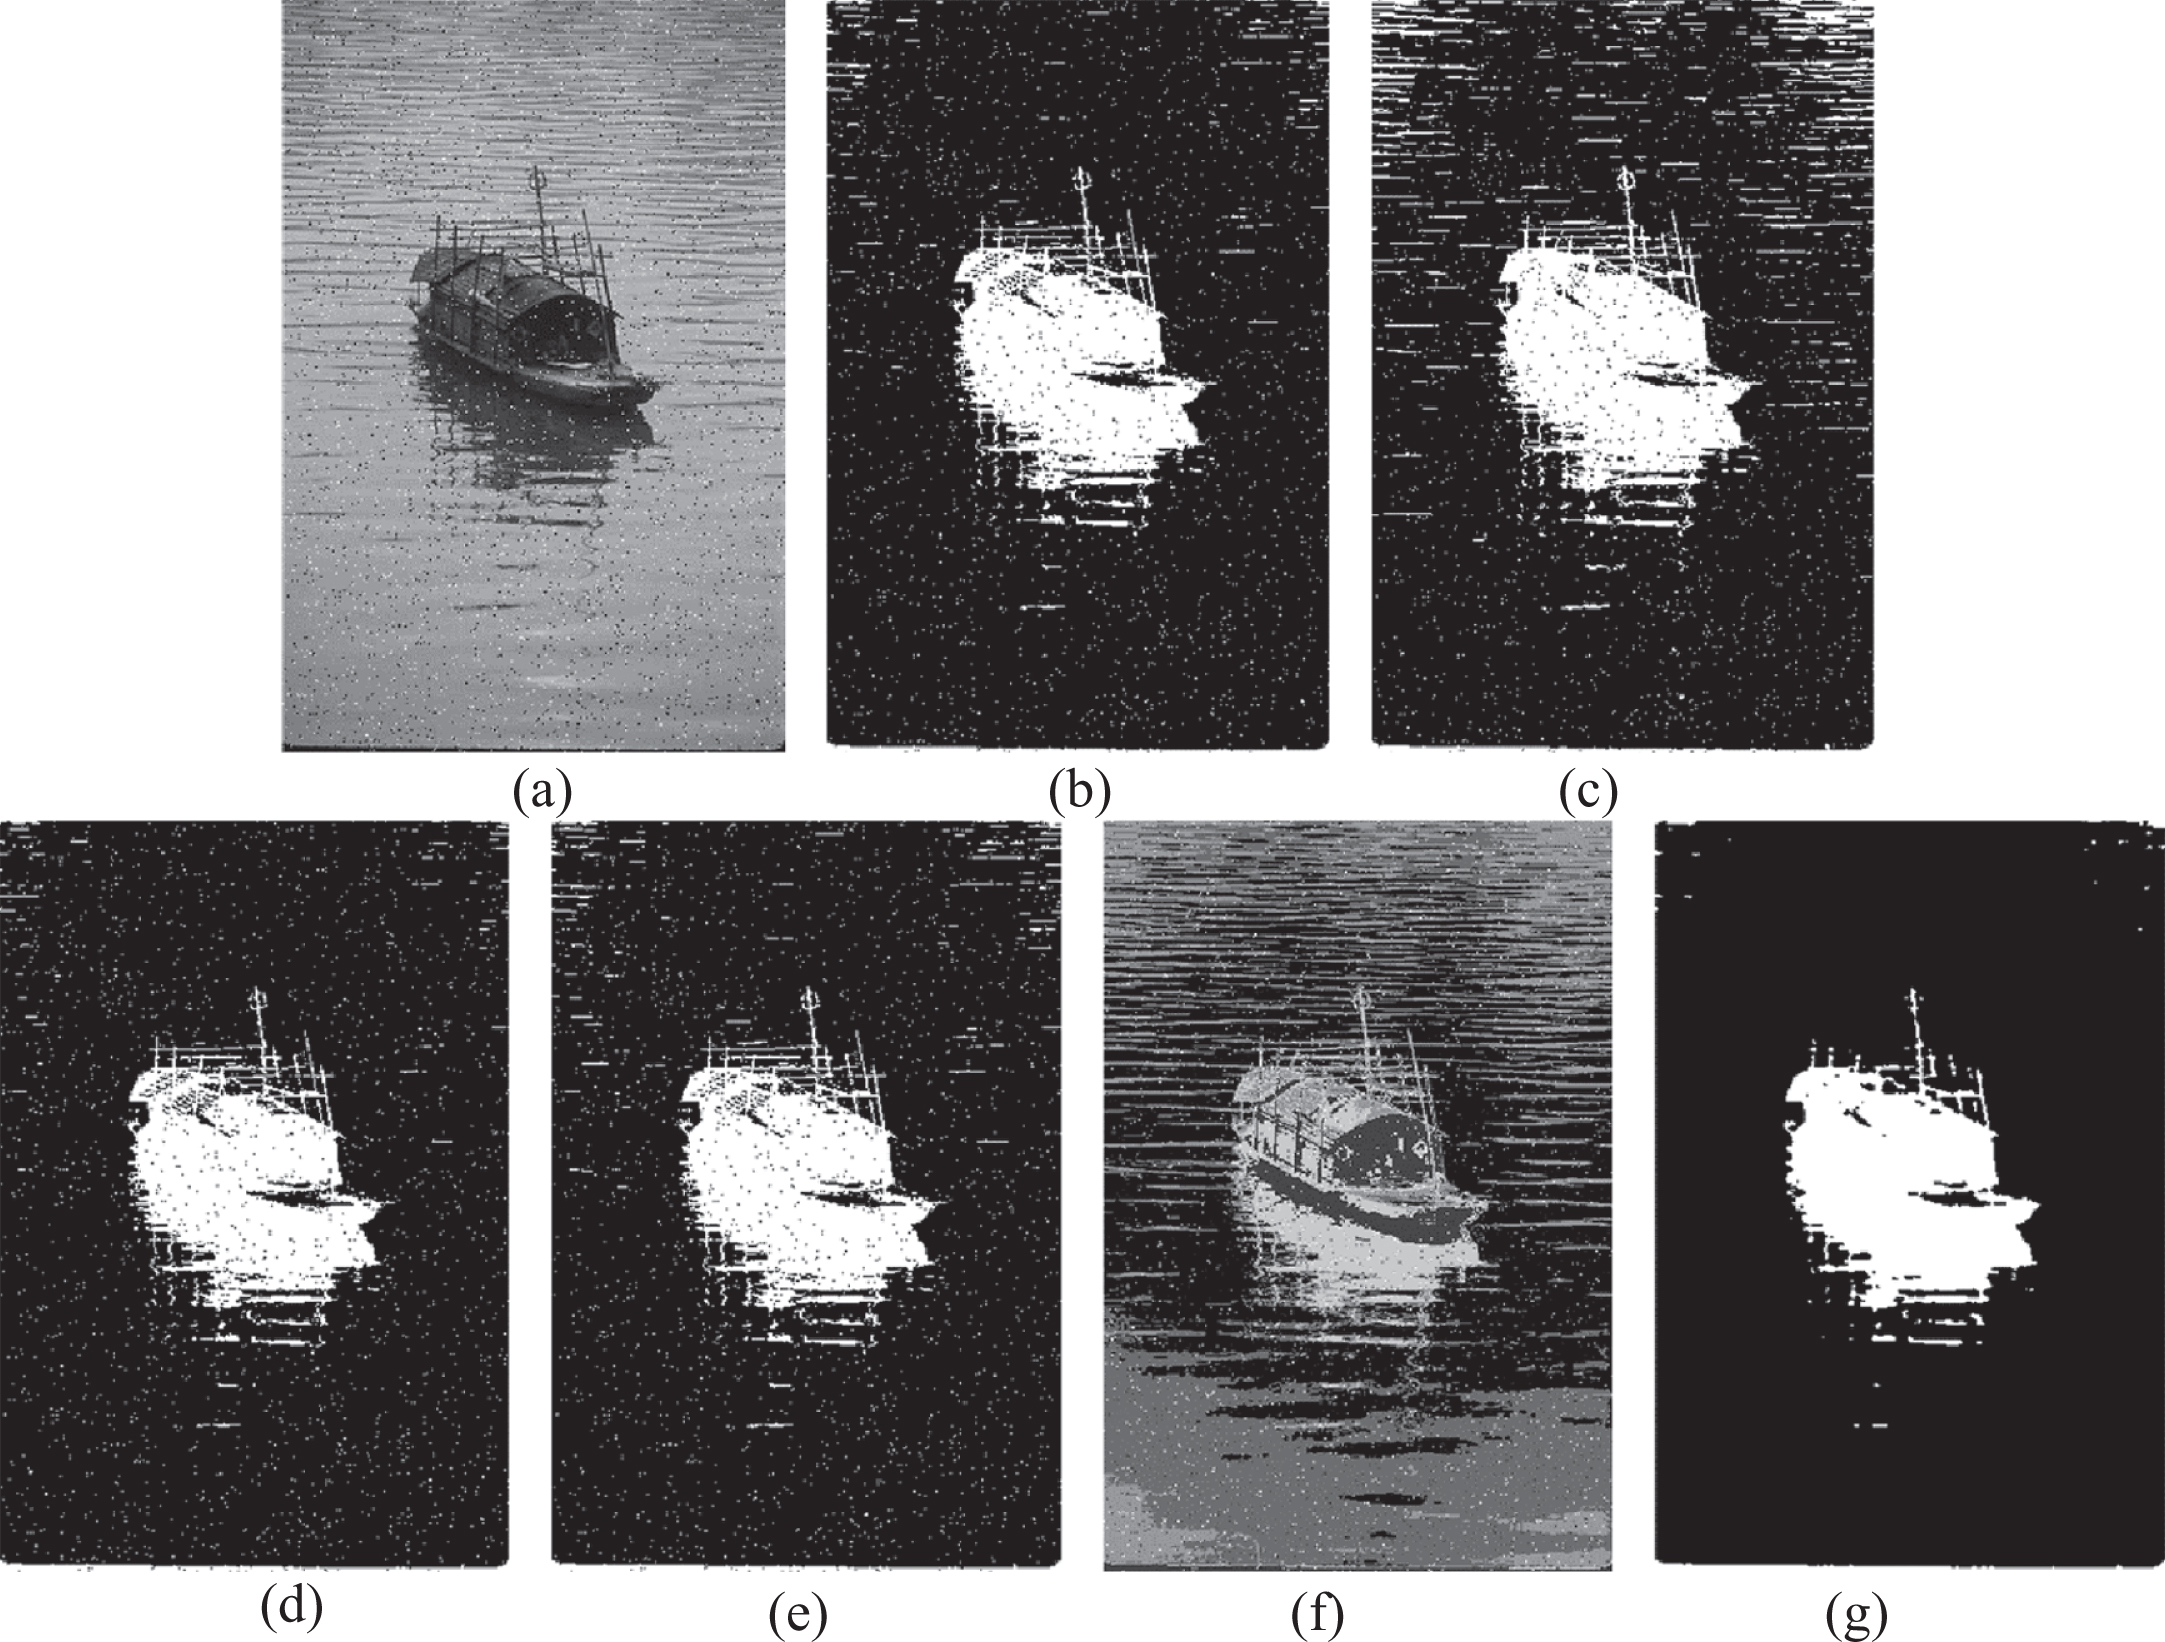
In this section, AMT-MABCO and the comparative methods are verified on real images without ground truth. White Gaussian noise with normalized variance 0.005 and Salt & Pepper noise with normalized density 0.03 are added to these images, respectively. An entropy-based evaluation function (E) [10] is used to assess the performance of these methods on the natural images without benchmark images. Lower value of E implies better image segmentation quality. As pointed out above, MPSO always evolves more thresholds, which leads to meaningless lower E values. Therefore, the E index values of MPSO are not included in this section. The corresponding E values of AMT-MABCO and the other comparative methods are shown in Table 7. It can be found from this table that AMT-MABCO obtains lower E values than the other methods on most images. In order to make a fair visual comparison, the segmentation results of all the methods on Cell, Shot and Circuit images are presented in Figs. 15–20.
Comparison of AMT-MABCO with state-of-the-art methods on natural images without ground truth
Comparison of AMT-MABCO with state-of-the-art methods on natural images without ground truth

Segmentation results on Cell corrupted by Gaussian noise: (a) original image; (b) noisy image; (c) Otsu; (d) Entropy; (e) ABC; (f) DE; (g) MPSO; (h) AMT-MABCO.

Segmentation results on Cell corrupted by Salt & Pepper noise: (a) noisy image (b) Otsu; (c) Entropy; (d) ABC; (e) DE; (f) MPSO; (g) AMT-MABCO.

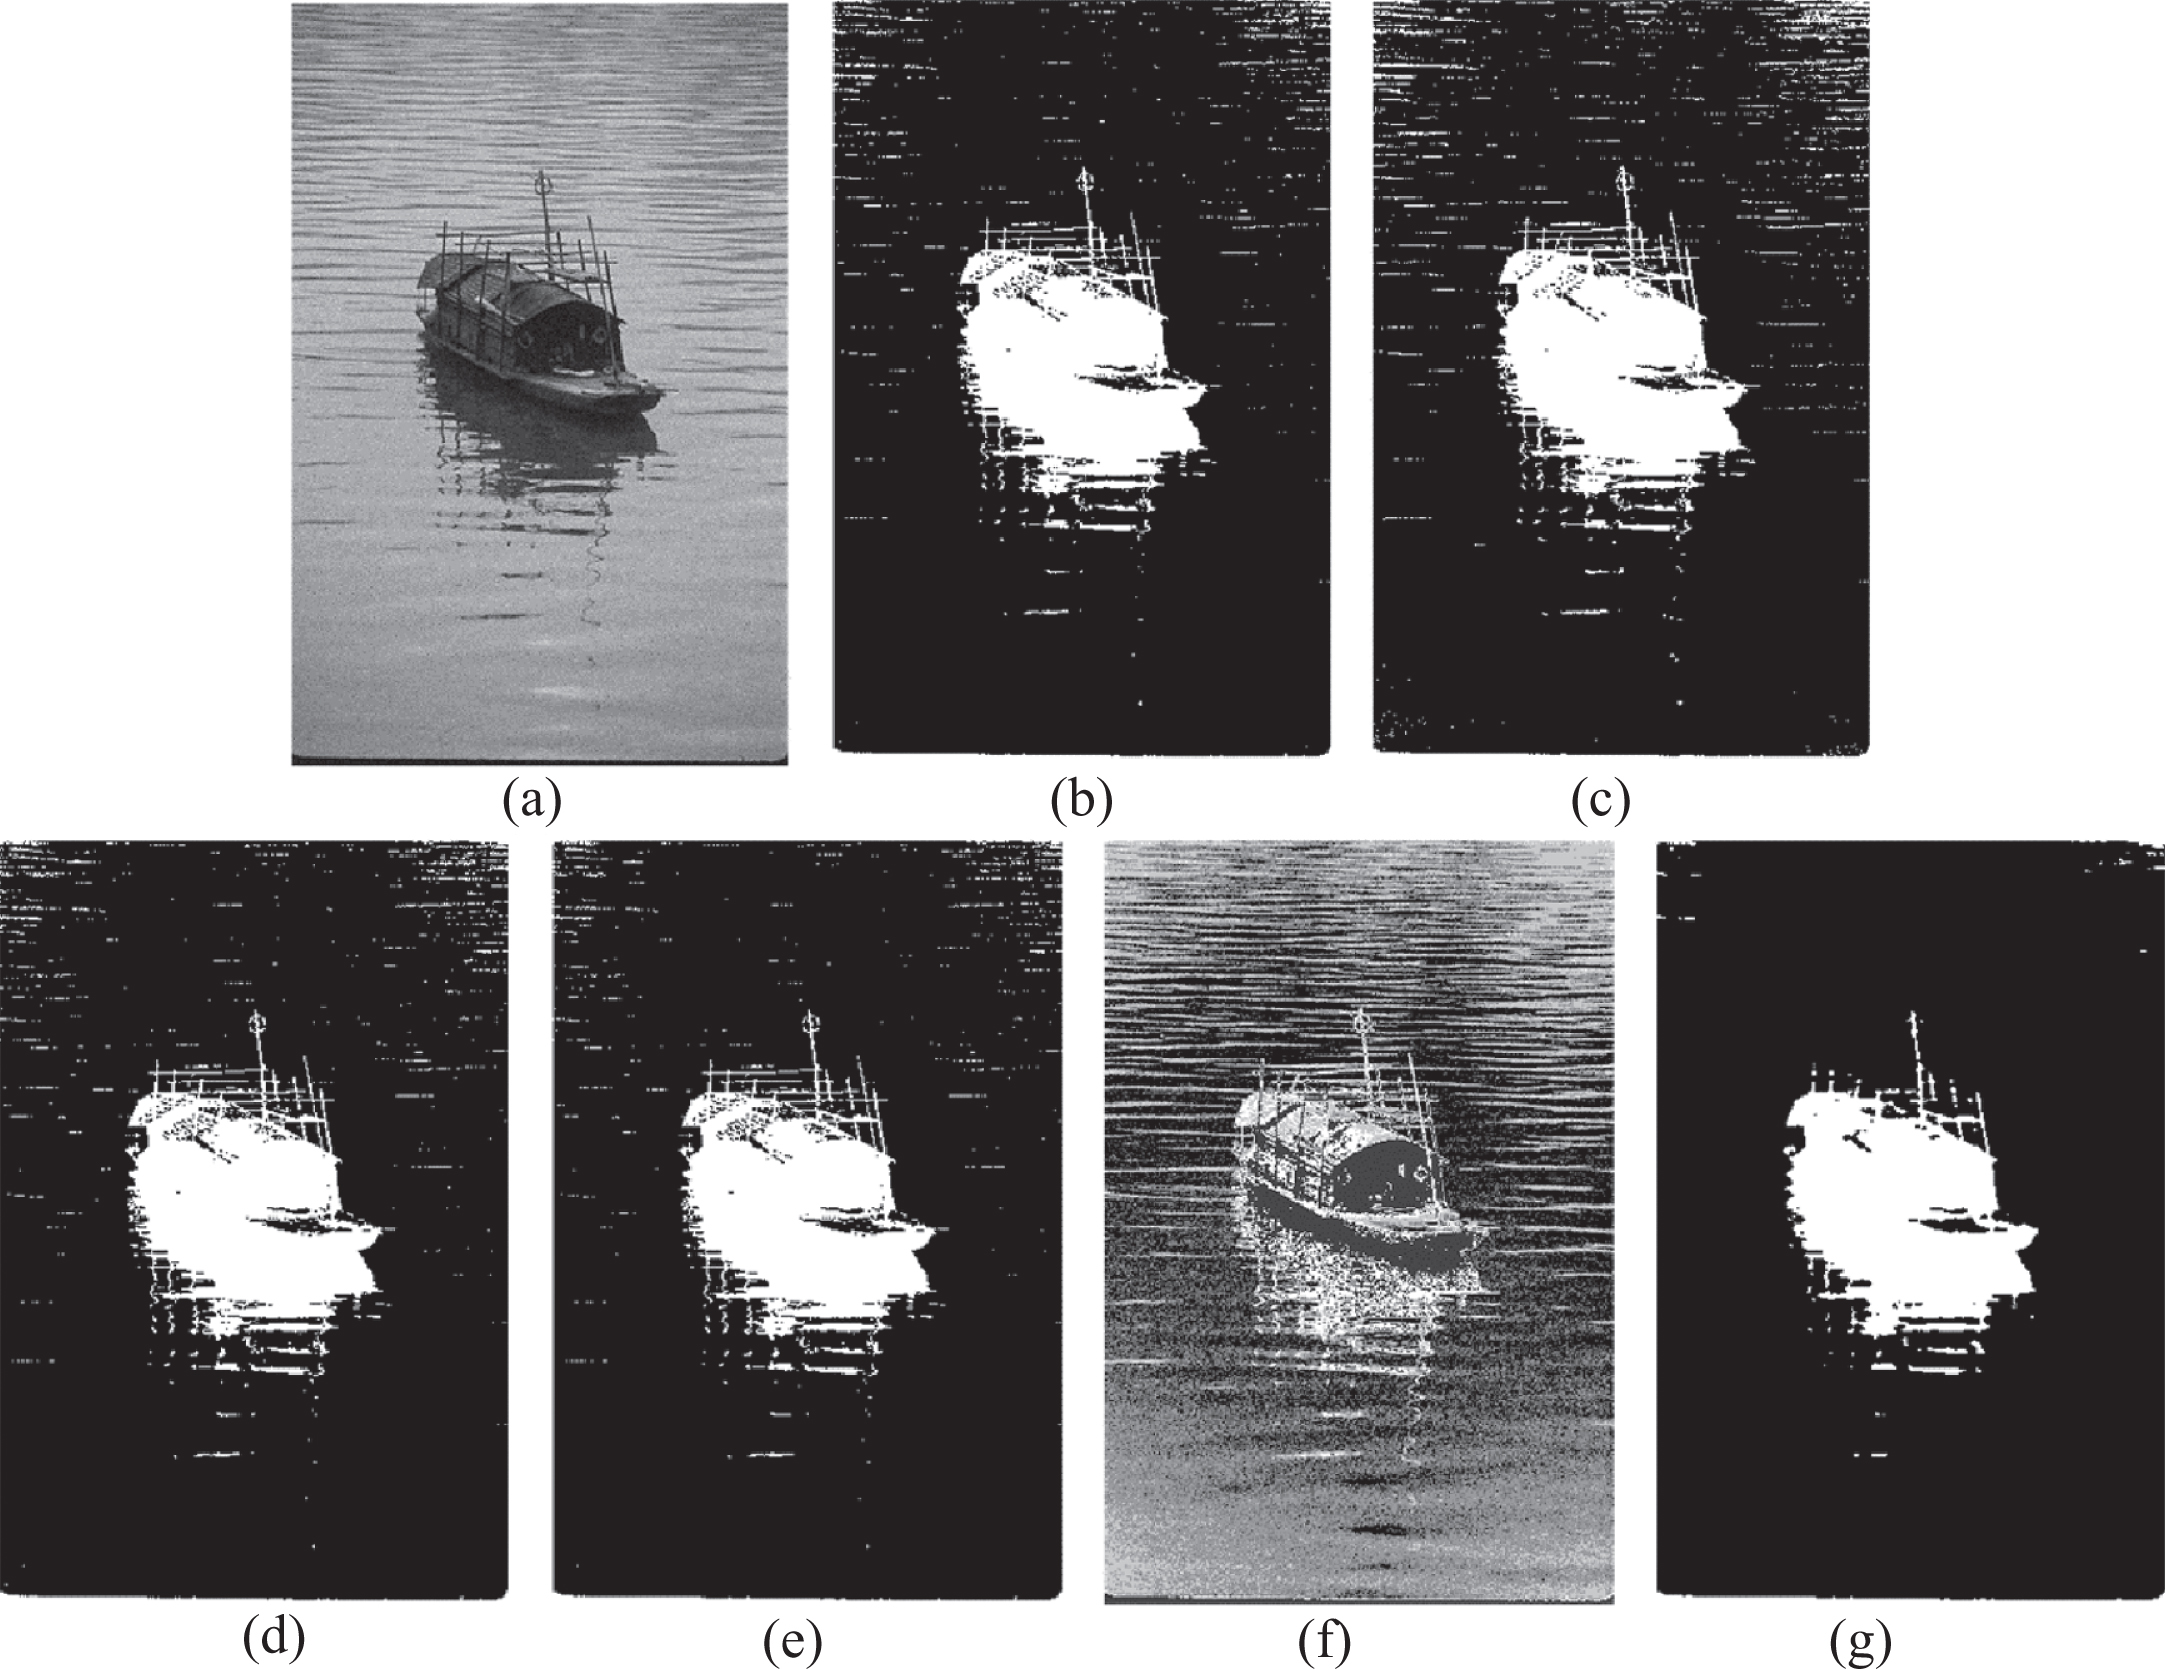
Segmentation results on Shot corrupted by Gaussian noise: (a) original image; (b) noisy image; (c) Otsu; (d) Entropy; (e) ABC; (f) DE; (g) MPSO; (h) AMT-MABCO.

Segmentation results on Shot corrupted by Salt & Pepper noise: (a) noisy image (b) Otsu; (c) Entropy; (d) ABC; (e) DE; (f) MPSO; (g) AMT-MABCO.

Segmentation results on Circuit corrupted by Gaussian noise: (a) original image; (b) noisy image; (c) Otsu; (d) Entropy; (e) ABC; (f) DE; (g) MPSO; (h) AMT-MABCO.
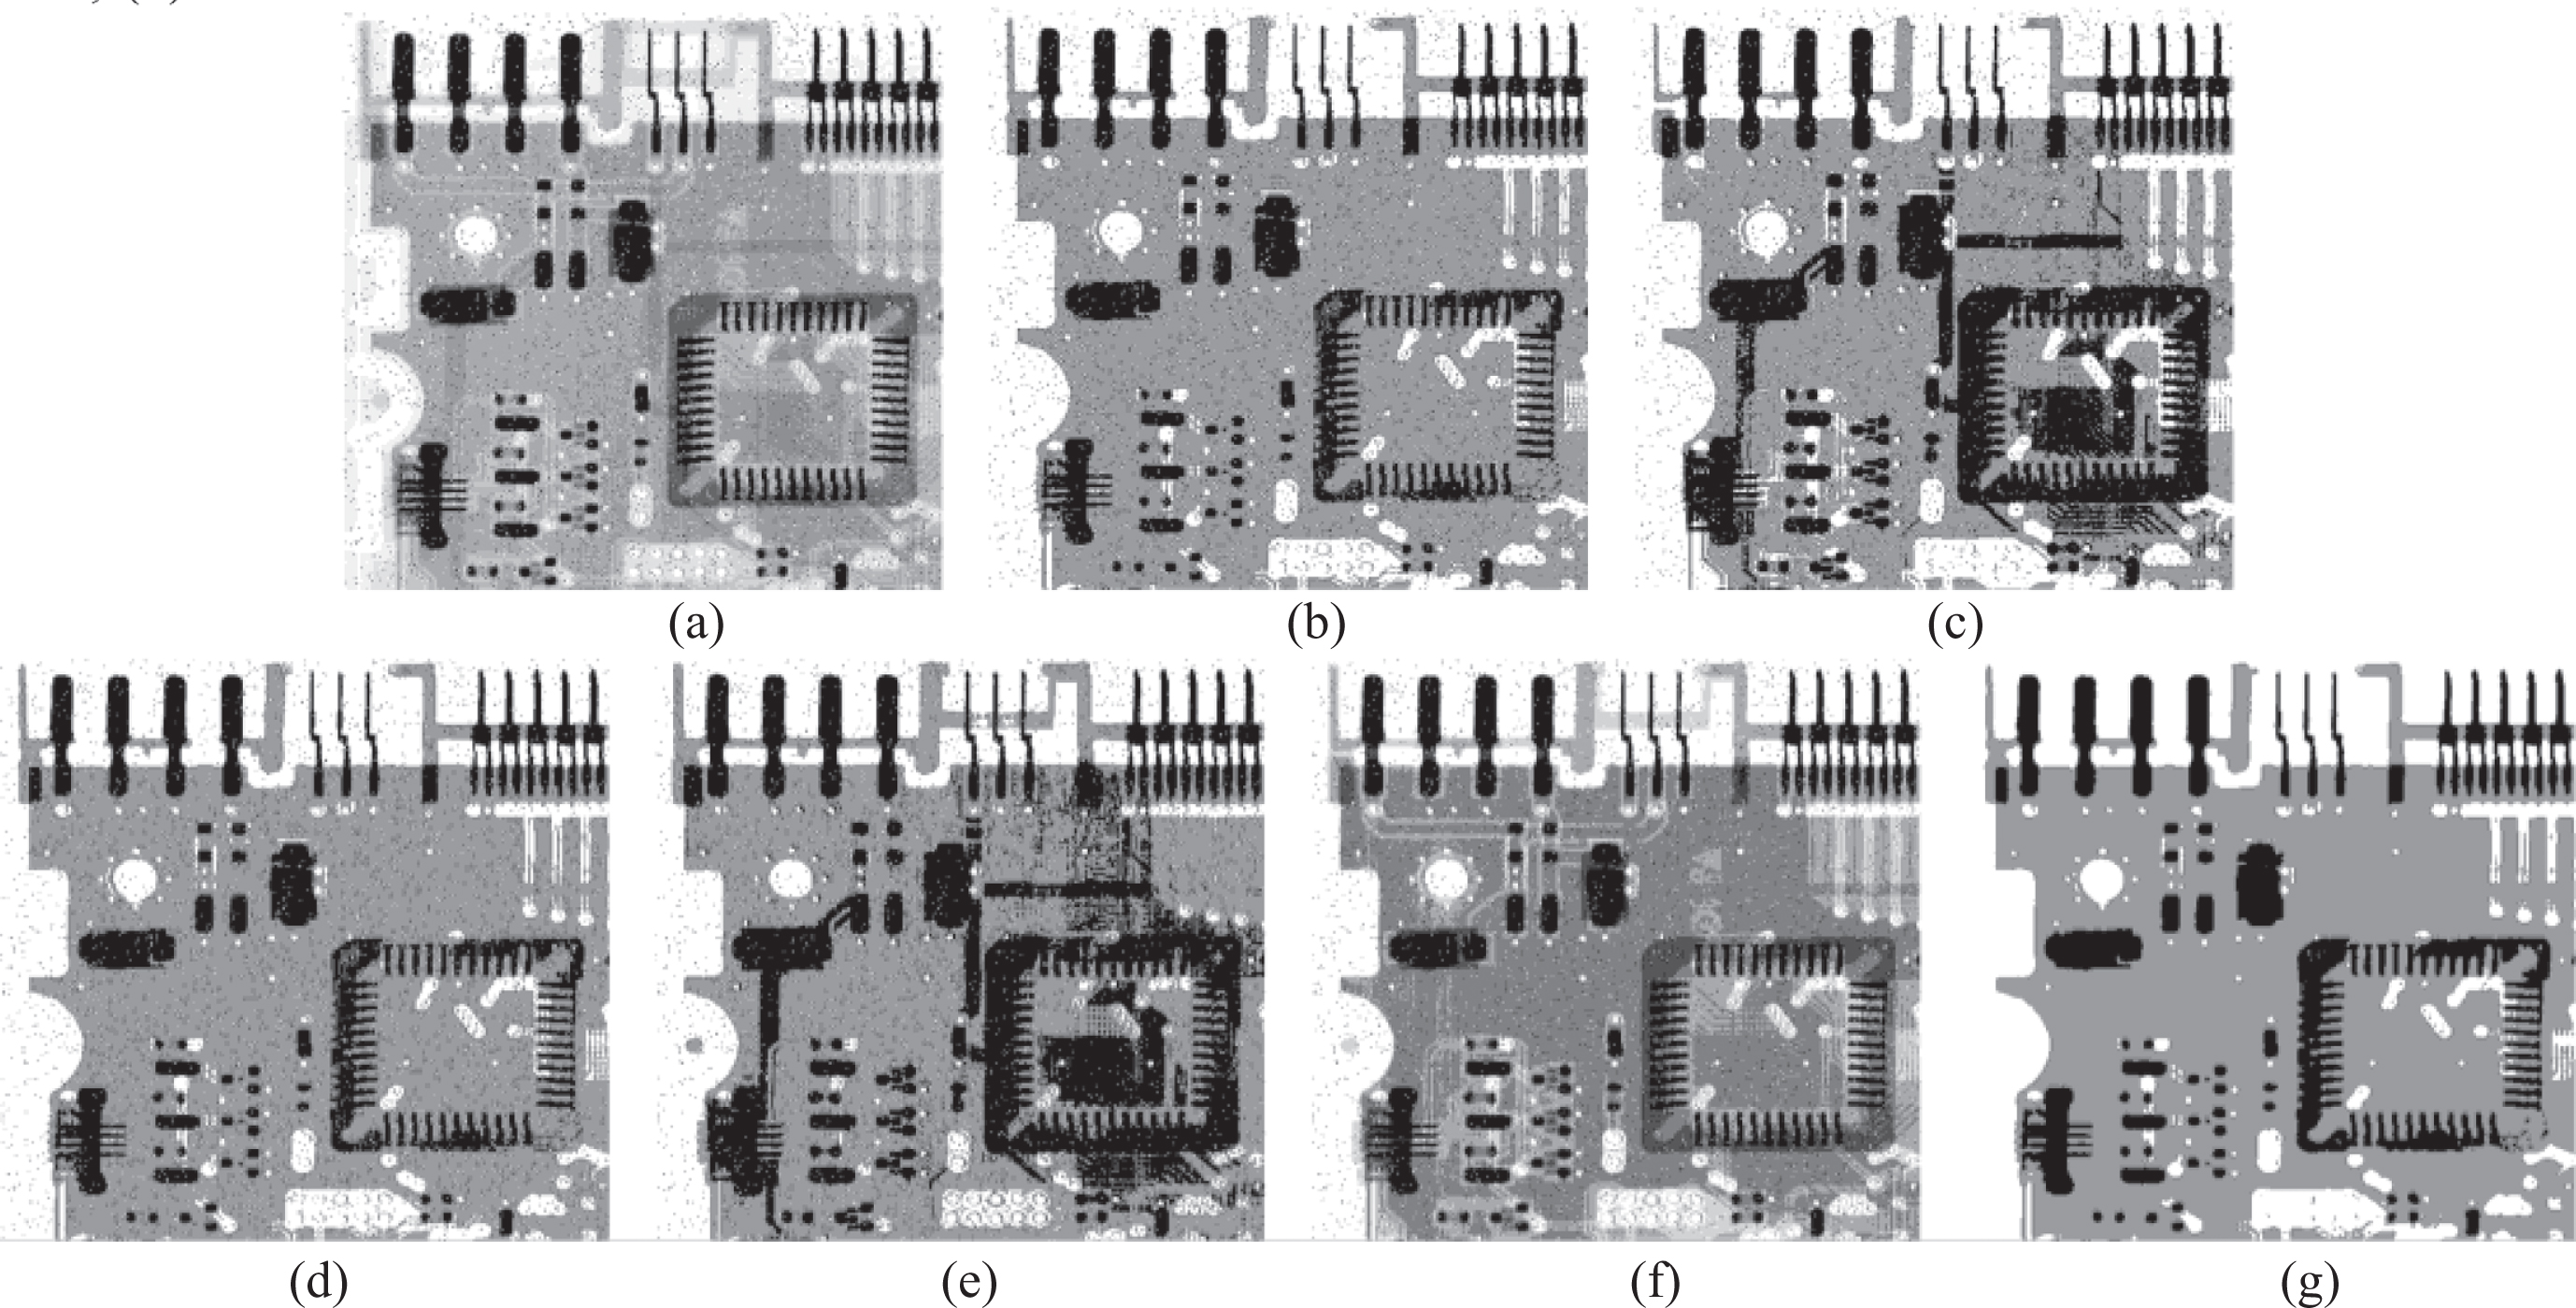
Segmentation results on Shot corrupted by Salt & Pepper noise: (a) noisy image (b) Otsu; (c) Entropy; (d) ABC; (e) DE; (f) MPSO; (g) AMT-MABCO.
These figures reveal that AMT-MABCO can determine approximate threshold numbers, which are the same as those given in Otsu, Entropy, ABC and DE methods in advance. Furthermore, the visual segmentation results of AMT-MABCO are much better than those results of the other methods. These figures also show that MPSO evolves more thresholds and cannot obtain the satisfying segmentation result.
This paper presents an adaptive multilevel thresholding algorithm based on multi-objective artificial bee colony optimization (AMT-MABCO) for noisy image segmentation. This method can obtain a compromising multilevel thresholding result under two segmentation criteria: the line intercept histogram based between-class variance function to overcome the effect of image noise and the interval-valued fuzzy entropy function to deal with the uncertainty in the image. AMT-MABCO can adaptively determine the number of multilevel thresholds by using the grouping population initialization and evaluation strategy. Furthermore, it adopts two different search equations to generate candidate solutions in the employed bee phase and the onlooker bee phase, respectively. Experimental results on synthetic and real images reveal that AMT-MABCO behaves well in noise robustness and segmentation performance.
Due to utilizing the spatial information derived from the pixel’s neighborhood, the line intercept histogram based between-class variance function of AMT-MABCO may not well deal with images with complicated information. How to propose the more robust fitness functions deserves further research. Furthermore, we will also study more effective search equations for the employed, onlooker and scout bee phases of multi-objective artificial bee colony optimization.
Footnotes
Acknowledgments
This work is supported by the National Natural Science Foundation of China (Grant Nos. 61571361, 61202153, 41471280 and 61671377), the Natural Science Basic Research Plan in Shaanxi Province of China (Grant No. 2020JM-299), the Fundamental Research Funds for the Central Universities (Grant No. GK201903092), and New Star Team of Xi’an University of Posts & Telecommunications (xyt2016-01).