
Abstract
An information system as a database that stands for relationships between objects and attributes is an important mathematical model. An image information system is an information system where each of its information values is an image and its information structures embody internal features of this type of information system. Uncertainty measurement is an effective tool for evaluation. This paper explores measures of uncertainty for an information system by using the proposed information structures. The distance between two objects in an image information system is first given. After that, the fuzzy T cos -equivalence relation, induced by this system by using Gaussian kernel method, is obtained, where Gaussian kernel is based on this distance. Next, information structures of this system are described by set vectors, dependence between information structures is studied and properties of information structures are given by using inclusion degree, and application for information structures and uncertainty measures of an image information system are investigated by the information structures. Moreover, effectiveness analysis is done to show the feasibility of the proposed measures from the angle of statistics. Finally, an application of the proposed measurement for attribute reduction is given. These results will be helpful for understanding the essence of uncertainty in an image information system.
Keywords
Introduction
Granular computing, presented by Zadeh [43, 44], is a basic issue in knowledge representation and data mining. Its purpose is to find an approximation scheme, which allows us to view a phenomenon with different levels of granularity and then can effectively solve complex problems. Information granulation, organization and causation are basic concepts of granular computing. Information granule, is a family of objects and described by some constraints, such as indistinguishability, similarity or functionality. The process of constructing information granules is called information granulation. It granulates a universe into a family of disjoint or overlapping information granules. Granular structure is the family of information granules where the internal structure of each information granule is visible as a sub-structure. Naturally, granular structure can be depicted as a vector consisting of information granules. Lin [14, 15] and Yao [38, 39] explained the importance of granular computing, this aroused people’s attention on it. Until now, the search on granular computing mainly has four methods, i.e., rough set theory [23], fuzzy set theory [42], concept lattice [21] and quotient space theory [48].
Rough set theory is an important tool to deal with uncertainty. Rough set theory proposed by Pawlak [23, 24] as an important approach for the joint management of uncertainty is developed around the concept of an information system. Most applications of rough sets, such as uncertainty modeling [5, 31], reasoning with uncertainty [38], rule extraction [4, 33], classification and feature selection [13, 32] are related to information systems.
In an information system, the study of information structure is an important research topic. An equivalence relation is a special kind of similarity between two objects from a data set. Given an information system, each attribute subset determines an equivalence relation on the object set of this system. This equivalence relation partitions the object set into some disjoint classes, these classes are said to be equivalence classes. If two objects belong to the same equivalence class, then we may say that they cannot be distinguished under this equivalence relation. Thus, each equivalence class is seen as an information granule consisting of indistinguishable objects [4]. The family of all these information granules constitutes a vector, this vector is said to be an information structure in the given information system induced by this attribute subset. Actually, information structures in an information system are granular structures in the meaning of granular computing.
Uncertainty, including randomness, fuzziness, vagueness, incompleteness and inconsistency, nearly exists in everywhere of the actual world. Uncertainty measurement is a basic problem in the research of many fields, such as machine learning [35], pattern recognition [6], image processing [22], medical diagnosis [10], information retrieval [34] and data mining [8]. A number of scholars have done some exploration in this aspect and many excellent research contributions have been made. For example, Yao et al. [39] gave a granularity measure from the angle of granulation; Wierman [33] presented measures of uncertainty and granularity in rough set theory; Bianucci et al. [1] explored entropy and co-entropy approaches for uncertainty measurements of coverings; Beaubouef et al. [3] proposed a method for measuring the uncertainty of rough sets. Liang et al. [18] investigated information granulation in complete and incomplete information systems; Dai et al. [9] researched entropy measures and granularity measures for set-valued information systems; Qian et al. [26, 27] presented the axiomatic definition of information granulation in a knowledge base and studied information granularity of a fuzzy relation by using its fuzzy granular structure; Yao [37] studied several types of information-theoretical measures for attribute importance in rough set theory; Xu et al. [36] considered knowledge granulation in ordered information systems.
With the arrival of the information age, information acquisition, analysis and processing have become a hot research topic in the field of information technology. Information uncertainty analysis, information fusion, attribute reduction and classification are becoming more and more important. Multi-source information includes the following types: different sources of the same type of information, different sources of the different types of information and multilingual information. Through multi-source information fusion, it is helpful to further excavate the value of data and enhance the function of information analysis; through the cross validation of multi-source information, information errors and omissions can be reduced, and decision-making errors can be prevented. Multi-source information or data mean that they comes from many kinds of attributes. If an information system has kinds of attributes or data, such as boolean attributes, categorical attributes, real-valued attributes, set-valued attributes, interval-valued attributes, missing value, text, image, video, audio, sensor signal data and so on, then this information system can be called a hybrid information system. Zeng et al. [45, 46] studied a hybrid information system in which it has boolean attributes, categorical attributes, real-valued attributes, set-valued attributes, interval-valued attributes, image attributes and missing values, and gave a fuzzy rough set approach for incremental feature selection on this system.
The purpose of this paper is to study information structures and uncertainty in an image information system where each of its information values is an image. It is worth mentioning that this paper only measure uncertainty and does not carry out image processing. Thus, obtained the results can not apply in image processing. To date, no scholar has studied an image information system. Thus, it is also not convenient for us to compare methods.
The remaining part of this paper is organized as follows. In Section 2, we recall some basic concepts about fuzzy sets, fuzzy relations and image information systems. In Section 3, we introduce the distances in an image information system, In Section 4, we give the fuzzy T cos -equivalence relation induced by an image information system with images by using Gaussian kernel method. In Section 5, we investigate information structures in an image information system. In Section 6, we give some tools for measuring uncertainty of an image information system. In Section 7, to evaluate the performance of the proposed measures in an image information system, we conduct numerical experiments and do effectiveness analysis from the angle of statistics. In Section 8, we give an application of the proposed measurement for attribute reduction. In Section 9, we make comparison and discussion. Section 10 summarizes this paper.
Preliminaries
We first review some basic concepts about fuzzy sets and fuzzy relations, and then propose the concept of image information systems.
Throughout this paper, U denotes a finite set called the universe, 2 U denotes the family of all subsets of U. I denotes the unit interval [0, 1].
Put
Fuzzy sets and fuzzy relations
Fuzzy sets are extensions of ordinary sets [42]. A fuzzy set P in U is defined as a function assigning to each element x of U a value P (x) ∈ I and P (x) is called the membership degree of x to the fuzzy set P.
In this paper, I
U
denotes the set of all fuzzy sets in U. The cardinality of P ∈ I
U
can be calculated with
If R is a fuzzy set in U × U, then R is called a fuzzy relation on U. In this paper, IU×U denotes the set of all fuzzy relations on U.
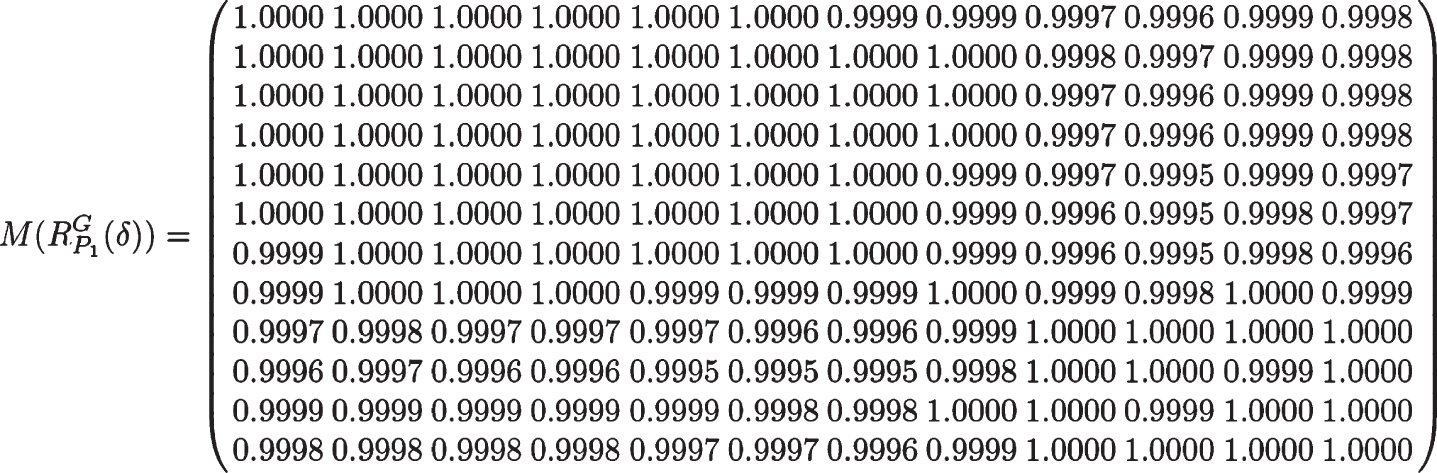
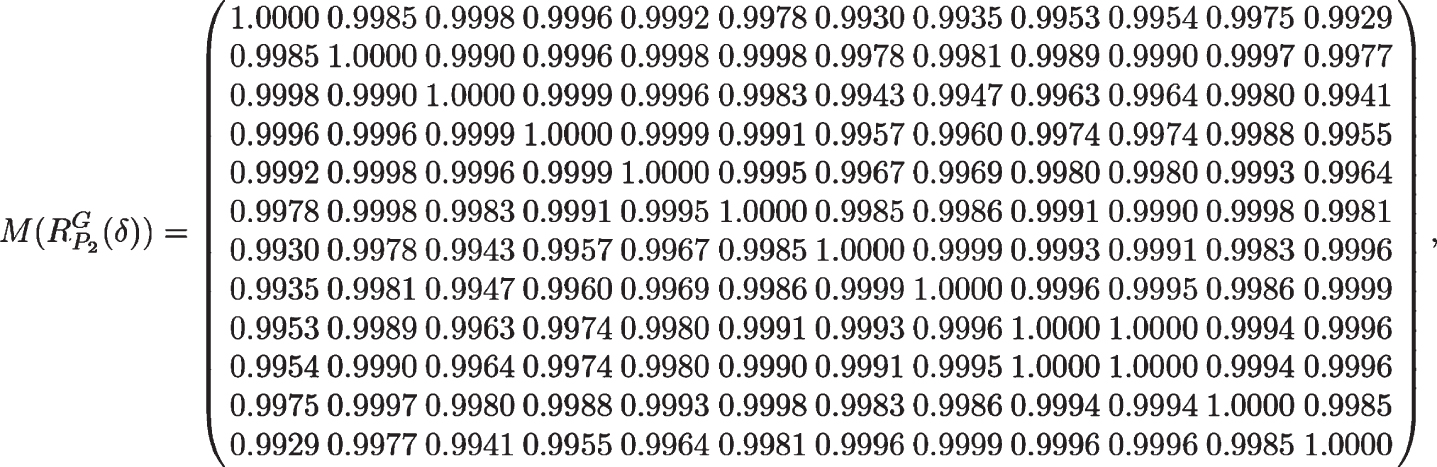
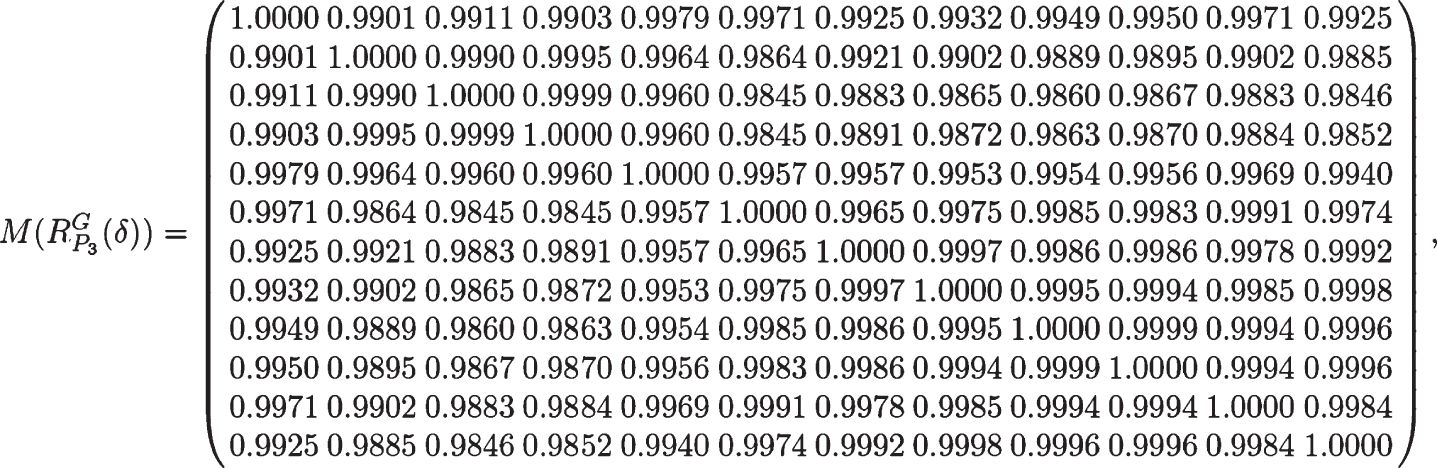
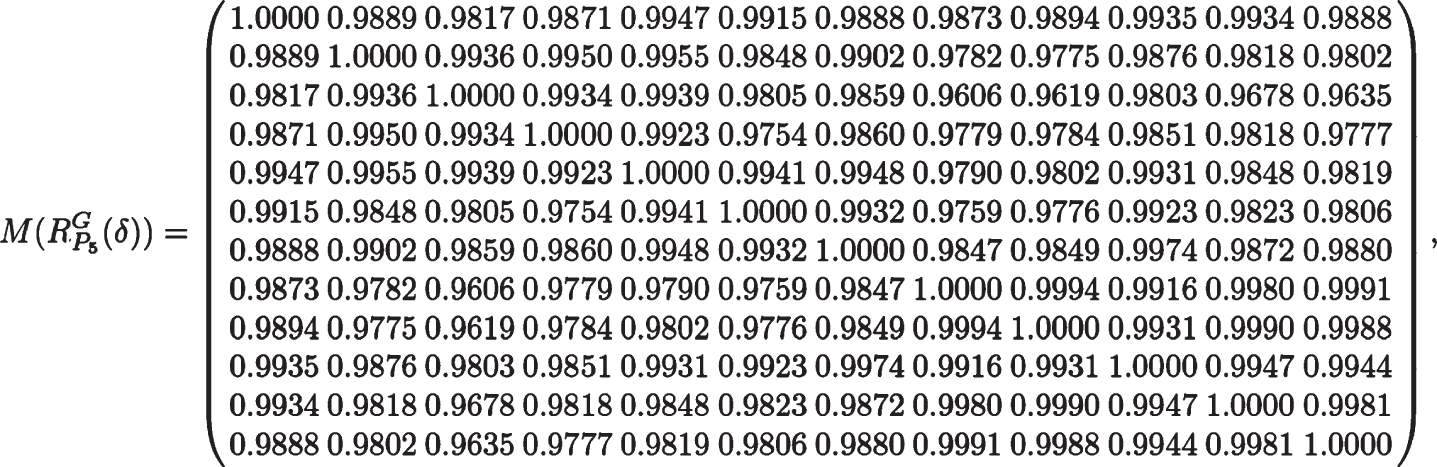
Let R ∈ IU×U. Then R may be represented by
If M (R) = E (E is an identity matrix), then R is said to be a fuzzy identity relation, and we write as R =▵; if r ij = 1, i, j ≤ n, then R is said to be a fuzzy universal relation, and we write as R = ω.
Let R ∈ IU×U. For each x ∈ U, we define a fuzzy set S
R
(x):
(1) Commutativity: T (a, b) = T (b, a) ,
(2) Associativity: T (T (a, b) , c) = T (a, T (b, c)) ,
(3) Monotonicity: a ≤ c, b ⩽ d = T (a, b) ⩽ T (c, d) ,
(4) Boundary condition: T (a, 1) = a .
(1) Reflexivity: R (x, x) =1,
(2) Symmetry: R (x, y) = R (y, x) ,
(3) T-transitivity: T (R (x, y) , R (y, z)) ⩽ R (x, z) .
Image information systems
If P ⊆ A, then (U, P) is called a subsystem of (U, A).
If P ⊆ A, then (U, P) is called a subsystem of (U, A).
An image information system
An image information system

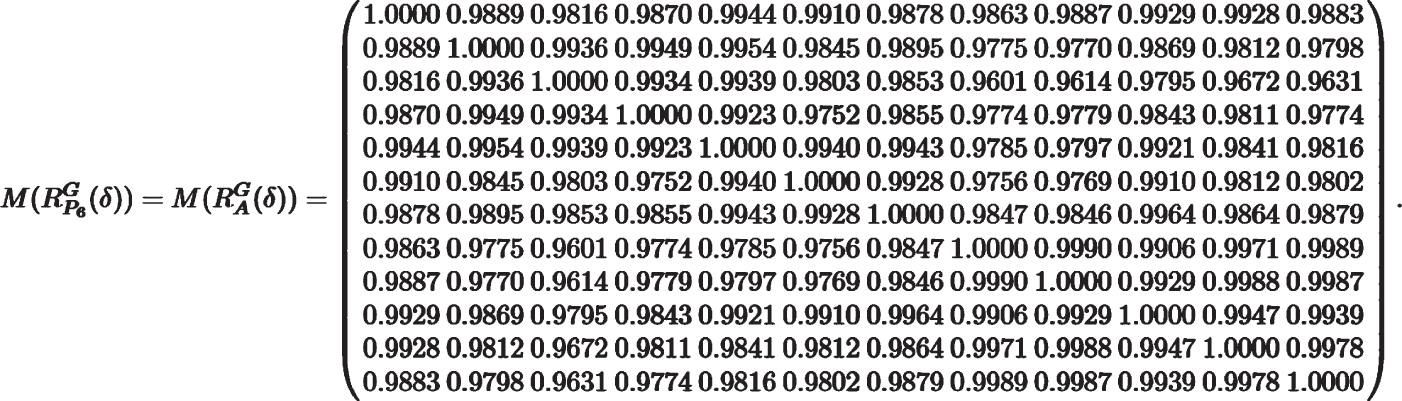
In this paper, the getGaborKernel function of OpenCV is used to construct convolution kernel, and the filter 2D function is applied to obtain the feature vector of an image. In this way, the image as an information value is transformed into feature vector as an information value. The relationship between two feature vectors can be easily described by distance.
X=<4.508, 14.245, 2.137, 7.206, 1.972, 6.77, 1.91, 6.512, 1.911, 6.517, 4.508, 14.245, 10.387, 32.338, 7.615, 24.713, 7.585, 24.622, 7.59, 24.642, 4.508, 14.245, 18.994, 50.446, 49.511, 80.783, 60.907, 91.703, 60.689, 91.513, 4.508, 14.245, 39.229, 65.569, 29.673, 58.588, 29.274, 58.319, 29.346, 58.371, 4.508, 14.245, 17.978, 47.001, 20.683, 50.435, 19.272, 48.557, 19.325, 48.614, 4.508, 14.245, 39.229, 65.569, 29.673, 58.588, 29.274, 58.319, 29.346, 58.371, 4.508, 14.245, 18.994, 50.446, 49.511, 80.783, 60.91, 91.705, 60.69, 91.515, 4.508, 14.245, 10.387, 32.338, 7.615, 24.713, 7.585, 24.622, 7.59, 24.642 >,
Y=<4.619, 14.747, 2.18, 7.262, 1.973, 6.752, 1.928, 6.529, 1.928, 6.532, 4.619, 14.747, 9.889, 30.914, 7.474, 24.214, 7.455, 24.141, 7.458, 24.158, 4.619, 14.747, 19.321, 53.147, 46.507, 78.065, 57.515, 88.639, 57.306, 88.453, 4.619, 14.747, 36.654, 65.957, 28.673, 61.002, 28.356, 60.812, 28.409, 60.847, 4.619, 14.747, 18.528, 51.164, 20.817, 53.632, 19.625, 52.264, 19.671, 52.305, 4.619, 14.747, 36.654, 65.957, 28.673, 61.002, 28.356, 60.812, 28.409, 60.847, 4.619, 14.747, 19.321, 53.147, 46.507, 78.065, 57.517, 88.642, 57.309, 88.456, 4.619, 14.747, 9.889, 30.914, 7.474, 24.214, 7.455, 24.142, 7.458, 24.158>
For images, let a max =<255, ⋯ , 255 > and a min = <0, ⋯ , 0 > .
By Definition 3.1,
Based on the above definition and OpenCV, an algorithm for obtain feature vector of images can be designed as below.
Initialize:
ksizes ← {(1 × 1) , (3 × 3) , (5 × 5) , (7 × 7) , (9 × 9)}
sigma ← 1.0
lambd ← π/2
gamma ← 1
phi ← 0
ktype ← cv2 . CV _ 32F
kernel ← cv2 . getGaborKernel ()
fimg ← cv2 . filter2D (a (x i ) , -1, kernel)
matrix ← fimg
Extract the means and standard
deviations of matrix
Connect all of the means and standard
deviations to an 80-dimensional feature vector
Put 80-dimensional feature vector to a collection
theta ← theta + π/8
A collection of 80-dimensional feature vectors
In Algorithm 1, the complexity of convolution depends directly on the size of the Gabor filter. The complexity of calculating the filter response for one point is O (M2), where M is the width and height of Gabor filter. If the filtering is done on the entire image of size N × N, the complexity becomes O (M2N2). To an image information system, the time complexity is O (|U||A|M2N2)
Then
Thus
□
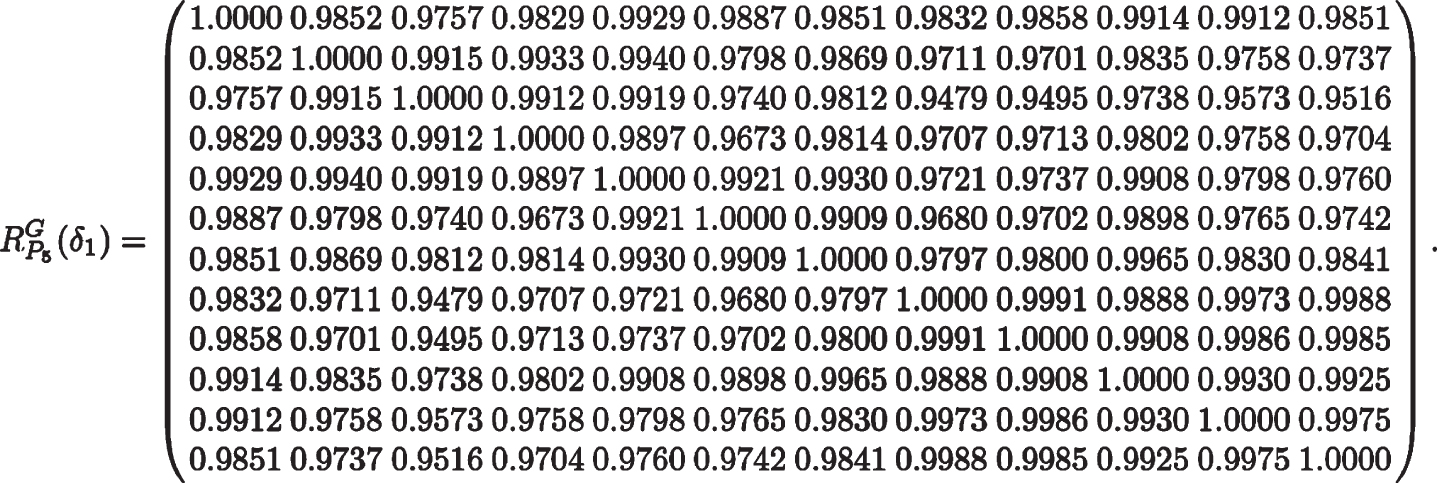
Put P i = {a1, ⋯ , a i } (i = 1, 2, 3, 4, 5, 6).
Then P6 = A, P1 ⊆ P2 ⊆ P3 ⊆ P4 ⊆ P5 ⊆ P6.
Thus (U, P1), (U, P2), (U, P3), (U, P4), (U, P5) and (U, P6) are six subsystems of (U, A).
By Definition 3.1 and Example 3.5,
Based on the above definitions, an algorithm for computing the distance between two images in an image information system can be designed as below.
matrix [i] [j] ← d (a (x i ) , a (x j )) a (x) is the feature vector of each image is (U, P)
Algorithm 2 describes the calculation of distance matrix for subsystem (U, P). For a subsystem of size |U| × |P|, the computational complexity of this approach is O (|U||P|). When P = A, the complexity is O (|U||A|).

The fuzzy T cos -equivalence relation induced by an image information system
In this section, we give the fuzzy T cos -equivalence relation induced by a image information system by means of Gaussian kernel method.
Gaussian kernel method is an important methodology in machine learning and pattern recognition. For making data linear and simplifying classification tasks, it maps data into a higher dimensional feature space [29, 41]. Hu et al. [11, 12] found that there are some relationships between rough sets and Gaussian kernel method, so Gaussian kernel is used to obtain fuzzy relations.
In a typical kernel learning algorithm, the nonlinear mapping realized by Gaussian kernel function transforms the original data matrix into a Gaussian kernel matrix, which represents the structure and describes relationships between samples. Kernel matrix plays an important role in a kernel learning algorithm because it contains all available information for further learning. The learning algorithm depends on the training data information obtained by kernel matrix.
A Gaussian kernel matrix can be regarded as a relation matrix, and a relation matrix can be regarded as a Gaussian kernel matrix. It can be found that there is a high similarity between Gaussian kernel method and rough sets. Most relation matrices used in existing rough set models satisfy the conditions of Gaussian kernel function, which are positive-semidefinite and symmetric. Simultaneously, Gaussian kernel matrices are symmetric and reflective. This means that Gaussian kernel matrices can be used as fuzzy relation matrices of fuzzy rough sets.
In the last section, the image as an information value is transformed into feature vector as an information value, and the distance between two images is transformed into the distance between feature vectors. Gaussian kernel is based on the distance. Thus, the images are processed by means of Gaussian kernel.
Below, we use Gaussian kernel to extract a fuzzy T cos -equivalence relation on the object set of a given image information system.
Gaussian kernel
Obviously, G (x, y) satisfies:
(1) G (x, y) ∈ [0, 1];
(2) G (x, y) = G (y, x);
(3) G (x, x) =1.
The shortcoming of Gaussian kernel method is that it heavily depends on the threshold δ. Sometimes, differences of δ lead to large differences of the extracted fuzzy relations.

Information structures in an image information system
In this section, we investigate information structures in an image information system.
Some concepts of information structures in an image information system
Given R ∈ IU×U. Then for each i, S
R
(x
i
) can be viewed as the fuzzy neighborhood or the information granule of the point x
i
[27]. According to this view, Qian et al. [27] defined the fuzzy granular structure of R as follows:
Let (U, A) be an image information system. Given
Below, we propose dependence between information structures.
(1) S
δ
2
(Q) is called to depend on S
δ
1
(P), if for each i,
(2) S
δ
2
(Q) is called to depend partially on S
δ
1
(P), if there exists i,
(3) S
δ
2
(Q) is called to be independent on S
δ
1
(P), if for each i,
Obviously, S δ 1 (P) = S δ 2 (Q) ⇔ S δ 1 (P) ⪯ S δ 2 (Q) and S δ 2 (Q) ⪯ S δ 1 (P) , S δ 1 (P) ⪯ S δ 2 (Q) ⇒ S δ 1 (P) ⊑ S δ 2 (Q) , S δ 1 (P) ≺ S δ 2 (Q) ⇒ S δ 1 (P) ⊏ S δ 2 (Q) .
Properties of information structures in an image information system
In this subsection, we give properties of information structures in an image information system.
(1) If 0 < δ1 ≤ δ2 ≤ 1, then for any P ⊆ A, S δ 1 (P) ⪯ S δ 2 (P).
(2) If P ⊆ Q ⊆ A, then for any δ ∈ (0, 1], S
δ
(Q) ⪯ S
δ
(P).
Then
So
By Theorem 5.7,
(2) By Definition 4.1,
Then
So
Thus, by Theorem 5.7,
□
(1) 0 ≤ D (S δ (Q)/S δ (P)) ≤1;
(2) S δ (P) ⪯ S δ (Q) implies
D (S δ (Q)/S δ (P)) =1;
(3)
where
Thus
The following theorem shows the fact that relationships between information structures in an image information system can be quantitatively described by the inclusion degree.
(1) S δ (P) ⪯ S δ (Q) ⇔ D (S δ (Q)/S δ (P)) =1 .
(2) S δ (P) ⋈ S δ (Q) ⇔ D (S δ (Q)/S δ (P)) =0 .
(3) S δ (P) ⊑ S δ (Q) ⇔0 < D (S δ (Q)/S δ (P)) ≤1 .
It follows that ∀ l,
Hence S δ (P) ⪯ S δ (Q).
(2) “⇒”. Since S
δ
(P) ⋈ S
δ
(Q), we have
Thus D (S δ (Q)/S δ (P)) =0.
“⇐”. Since D (S
δ
(Q)/S
δ
(P)) =0, we obtain that ∀ l,
Then ∀ l,
(3) This follows from (1) and (2).□
Measuring uncertainty of an image information system
Uncertainty measurement for an information system was investigated and relationships between these measures were discussed [18]. These measures include granulation measure, information entropy, rough entropy, and knowledge granulation. They have become an effective mechanism for evaluating the uncertainty of an information system. In this section, we propose some tools for measuring uncertainty of an image information system.
Granulation measurement for an image information system
We first give the axiom definition of information granulation in an image information system.
(1) Non-negativity: ∀ P ⊆ A, G δ (P) ≥0;
(2) Invariability: ∀ P, Q ⊆ A, if S δ (P) = S δ (Q), then G δ (P) = G δ (Q);
(3) Monotonicity: ∀ P, Q ⊆ A, if S δ (P) ≺ S δ (Q), then G δ (P) < G δ (Q).
Here, G δ (P) is called δ-information granulation of the subsystem (U, P).
Similar to Definition 5 in [27], δ-information granulation of an image information system is given in the following definition.
Since ∀ i,
If
If
(1) If S δ 1 (P) ⪯ S δ 2 (Q), then G δ 1 (P) ≤ G δ 2 (Q);
(2) If S δ 1 (P) ≺ S δ 2 (Q), then G δ 1 (P) < G δ 2 (Q).
Then, ∀ i,
So, ∀ i,
Hence G δ 1 (P) < G δ 2 (Q).□
This proposition illustrates the fact that δ-information granulation increases when the available information becomes coarser, and it decreases when the available information becomes finer. In other words, the more uncertain the available information is, the bigger δ-information granulation value becomes. Thus, we can conclude that δ-information granulation introduced in Definition 6.2 can be used to evaluate the uncertainty of an image information system.
(1) If 0 < δ1 ≤ δ2 ≤ 1, then for any P ⊆ A, G δ 1 (P) ≤ G δ 2 (P).
(2) If P ⊆ Q ⊆ A, then for any δ ∈ (0, 1], G δ (Q) ≤ G δ (P).


We have
Since P1 ⊆ P5 ⊆ A, we have
Thus
(1) Obviously, “Non-negativity” holds.
(2) Given δ ∈ (0, 1] and P, Q ⊆ A. If S
δ
(P) = S
δ
(Q), then ∀ i,
By Definition 6.2, G δ (P) = G δ (Q).
(3) “Monotonicity” follows from Theorem 6.5.□
Entropy measurement for an image information system
In physics, entropy is often used to measure out-of-order degree of a system. The bigger the entropy value is, the higher out-of-order of a system will be. Shannon [28] applied the concept of entropy in physics to information theory for measurement uncertainty of a system.
Similar to Definition 8 in [17], δ-information entropy of a given image information system is defined as follows.
(1) If S δ 1 (P) ⪯ S δ 2 (Q), then H δ 2 (Q) ≤ H δ 1 (P);
(2) If S δ 1 (P) ≺ S δ 2 (Q), then H δ 2 (Q) < H δ 1 (P).
(2) Since S
δ
1
(P) ≺ S
δ
2
(Q), similar to the proof of Proposition 6.5, we obtain that ∀ i,
Then ∀ i,
and ∃ j,
Hence H δ 2 (Q) < H δ 1 (P).□
This theorem shows that δ-information entropy increases when δ-information structure becomes finer, and it decreases when δ-information structure becomes coarser.
(1) If 0 < δ1 ≤ δ2 ≤ 1, then for any P ⊆ A, H δ 2 (P) ≤ H δ 1 (P).
(2) If P ⊆ Q ⊆ A, then for any δ ∈ (0, 1], H δ (P) ≤ H δ (Q).
Thus
Since P1 ⊆ P5 ⊆ A, we have
Thus
Rough entropy, introduced by Yao [37], is used to measure granularity of a given partition. It is also called co-entropy by some scholars [2]. Similar to Definition 10 in [17], δ-rough entropy of a given image information system is proposed in the following definition.
So ∀ i,
This implies that
Then
By Definition 6.16,
If
If
(1) If S δ 1 (P) ⪯ S δ 2 (Q), then (E r ) δ 1 (P) ≤ (E r ) δ 2 (Q).
(2) If S δ 1 (P) ≺ S δ 2 (Q), then (E r ) δ 1 (P) < (E r ) δ 2 (Q).
(2) Since S δ 1 (P) ≺ S δ 2 (Q), similar to the proof of Theorem 6.5 (2), we obtain that
∀ i,
∃ j,
Then ∀ i,
and ∃ j,
Hence (E r ) δ 1 (P) < (E r ) δ 2 (Q).□
This proposition illustrates the fact that the more uncertain the available information is, the bigger δ-rough entropy value becomes. Thus, we can conclude that δ-rough entropy proposed in Definition 6.16 can be used to evaluate the uncertainty of an image information system.
(1) If 0 < δ1 ≤ δ2 ≤ 1, then for any P ⊆ A, (E r ) δ 1 (P) ≤ (E r ) δ 2 (P).
(2) If P ⊆ Q ⊆ A, then for any δ ∈ (0, 1], (E r ) δ (Q) ≤ (E r ) δ (P).
This proposition shows that δ-rough entropy increases when the δ becomes bigger, and it decreases when δ becomes smaller; δ-rough entropy increases when δ-information structure becomes smaller, and it decreases when δ-information structure becomes bigger.
Since P1 ⊆ P5 ⊆ A, we have
Thus
From Theorem 6.19 and Proposition 6.20, we come to the conclusion that δ-rough entropy introduced in Definition 6.16 can be used to evaluate the uncertainty of an image information system. That is to say, the more certain δ-information structure is, the smaller δ-rough entropy value becomes.
(1) Obviously, “Non-negativity” holds.
(2) Given δ ∈ (0, 1] and P, Q ⊆ A. If S
δ
(P) = S
δ
(Q), then ∀ i,
By Definition 6.16, (E r ) δ (P) = (E r ) δ (Q).
(3) “Monotonicity” follows from Theorem 6.19 (2).
□
□
By Theorem 6.24, H δ (P) = log2 n - (E r ) δ (P).
Thus 0 ≤ H δ (P) ≤ log2 n.□
Information amounts in an image information system
Similar to Definition 10 in [17], information amount in a given image information system is presented in the following definition.
(1) If S δ 1 (P) ⪯ S δ 2 (Q), then E δ 2 (Q) ≤ E δ 1 (P).
(2) If S δ 1 (P) ≺ S δ 2 (Q), then E δ 2 (Q) < E δ 1 (P).
(2) Since S
δ
1
(P) ≺ S
δ
2
(Q), similar to the proof of Proposition 6.5 (2), we obtain that ∀ i,
Hence E δ 2 (Q) < E δ 1 (P).□
This theorem illustrates that δ-information amount increases when δ-information structure becomes finer, and it decreases when δ-information structure becomes coarser.
(1) If 0 < δ1 ≤ δ2 ≤ 1, then for any P ⊆ A, E δ 2 (P) ≤ E δ 1 (P).
(2) If P ⊆ Q ⊆ A, then for any δ ∈ (0, 1], E δ (P) ≤ E δ (Q).
This proposition shows that δ-information amount increases when the δ becomes smaller, and it decreases when δ becomes bigger; δ-information amount increases when δ-information structure becomes bigger, and it decreases when δ-information structure becomes smaller.
Thus
Since P1 ⊆ P5 ⊆ A, we have E δ 2 (P1) ≈0.0001, E δ 2 (P5) ≈0.0124, E δ 2 (A) ≈0.0128,
Thus
From Theorem 6.28 and Proposition 6.29, we come to the conclusion that δ-information amount introduced in Definition 6.26 can be used to evaluate the uncertainty of an image information system. In other words, the more certain δ-information structure is, the bigger δ-information amount value becomes.
□
Pick δ2 = 0.1, ⋯ , 0.9 . We obtain the following results:
(1) If we only consider monotonicity, then δ-information granulation and δ-rough entropy are both monotonically increasing with the δ value growth, that means the uncertainty of four subsystems increase as the δ value increases. Meanwhile, δ-information amount and δ-information entropy are both monotonically decreasing with δ value growth, That means the uncertainty of four subsystem decreases as the δ value increases (see Figure 1–6).

Uncertainty measures of (U, P1) with different δ.
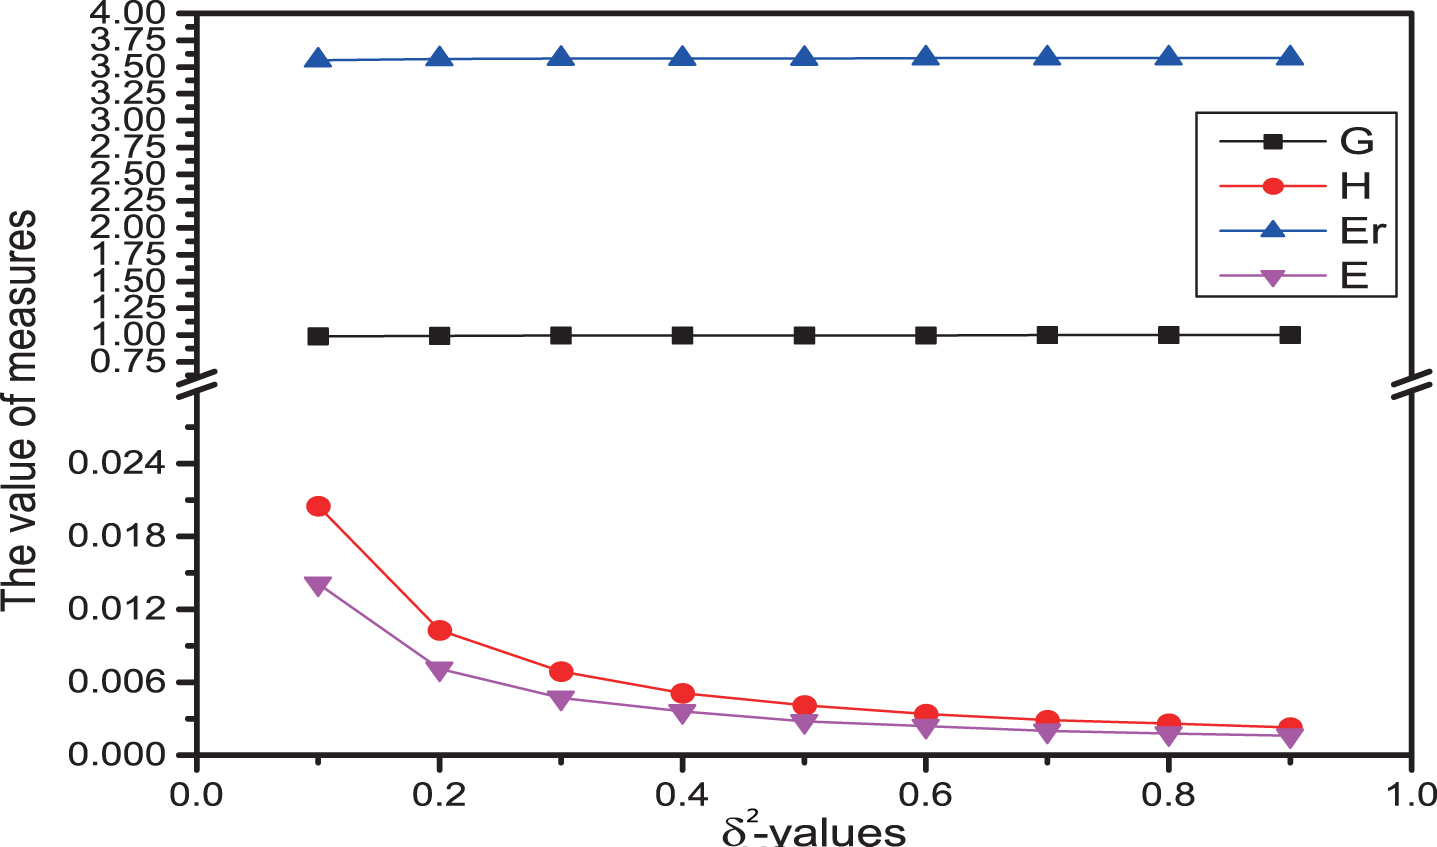
Uncertainty measures of (U, P2) with different δ.
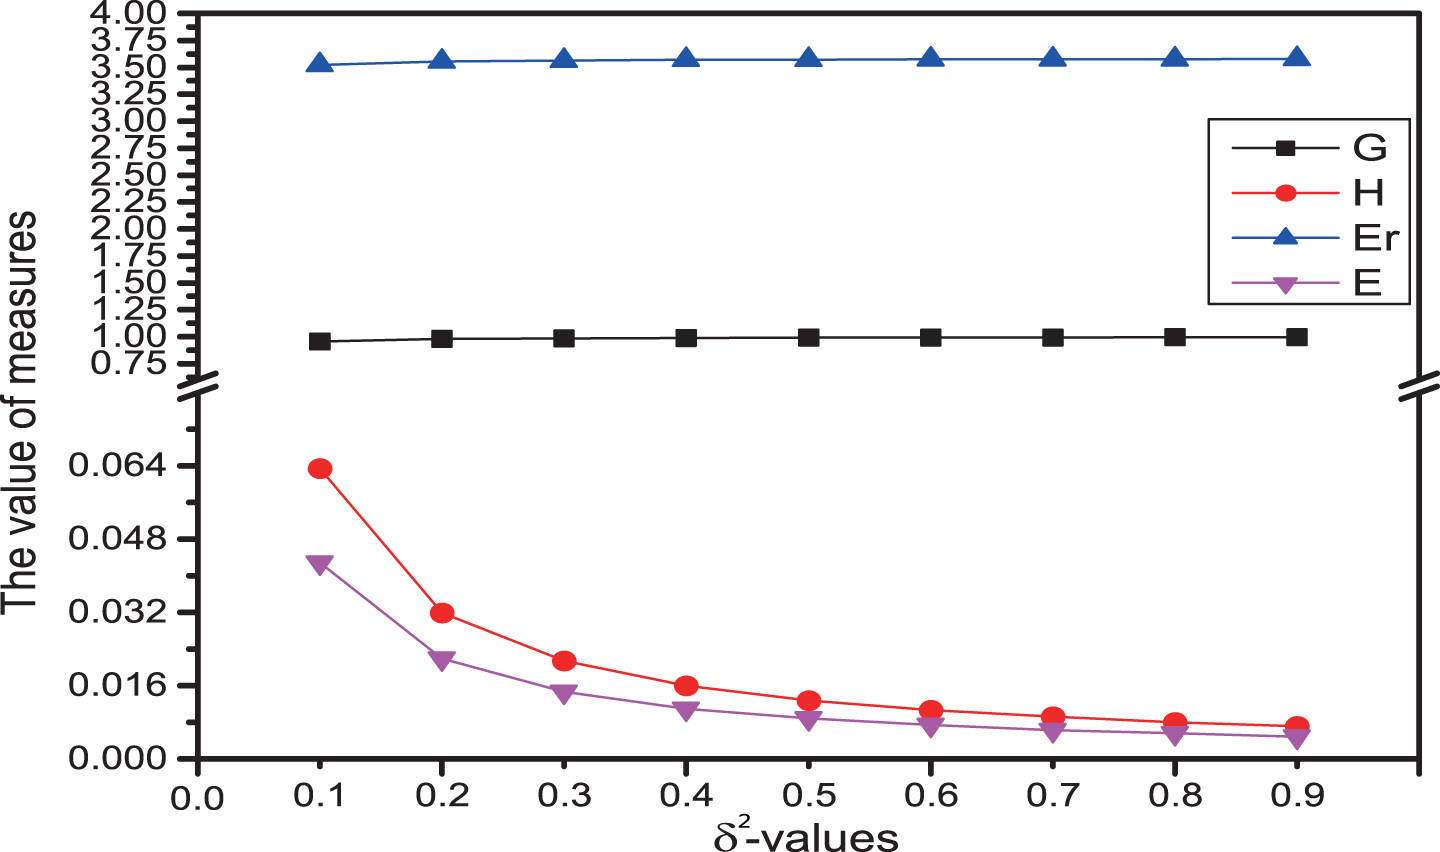
Uncertainty measures of (U, P3) with different δ.
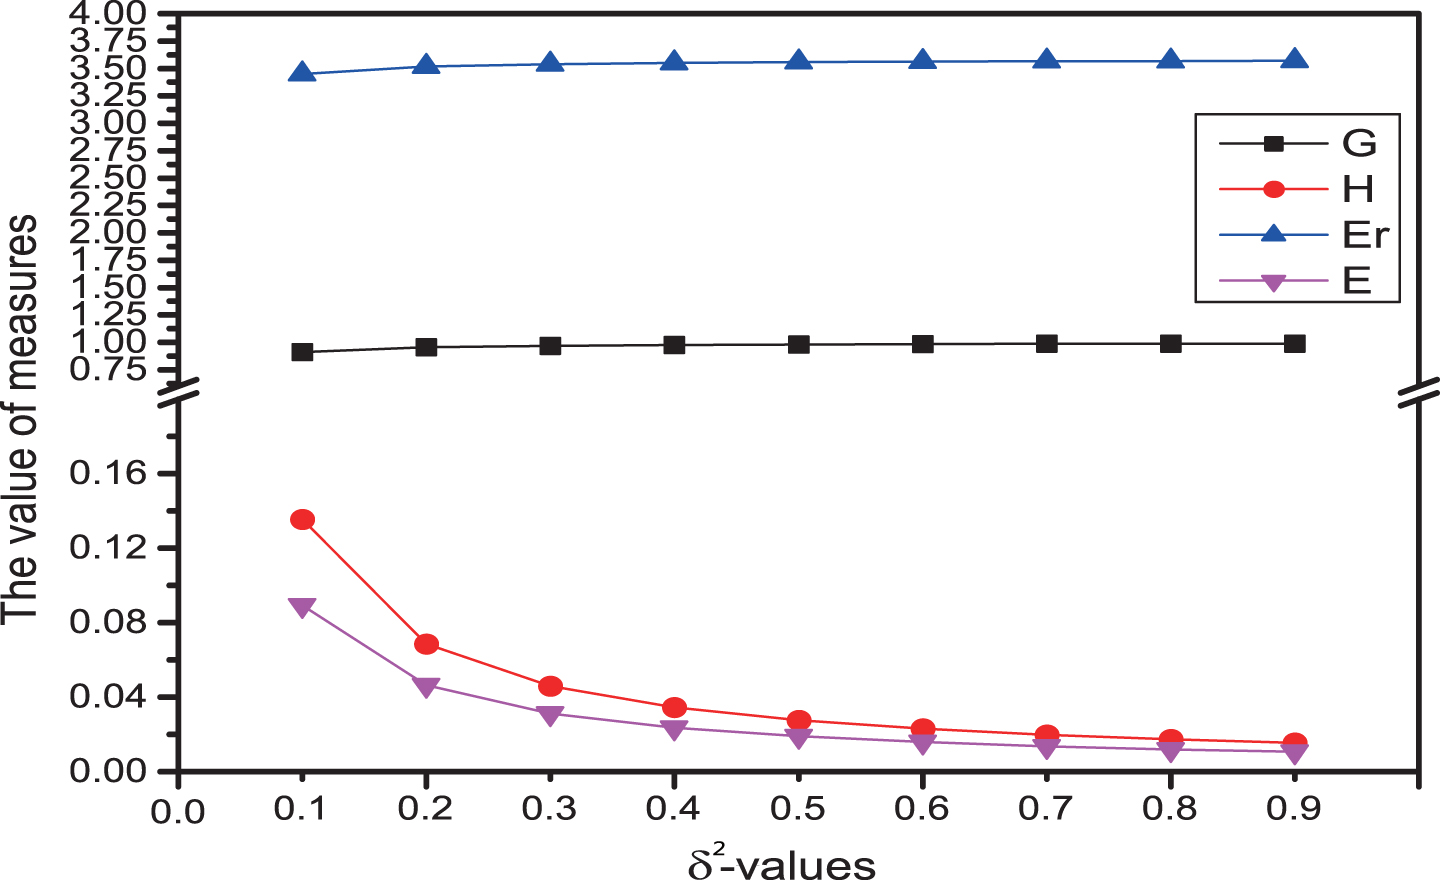
Uncertainty measures of (U, P4) with different δ.
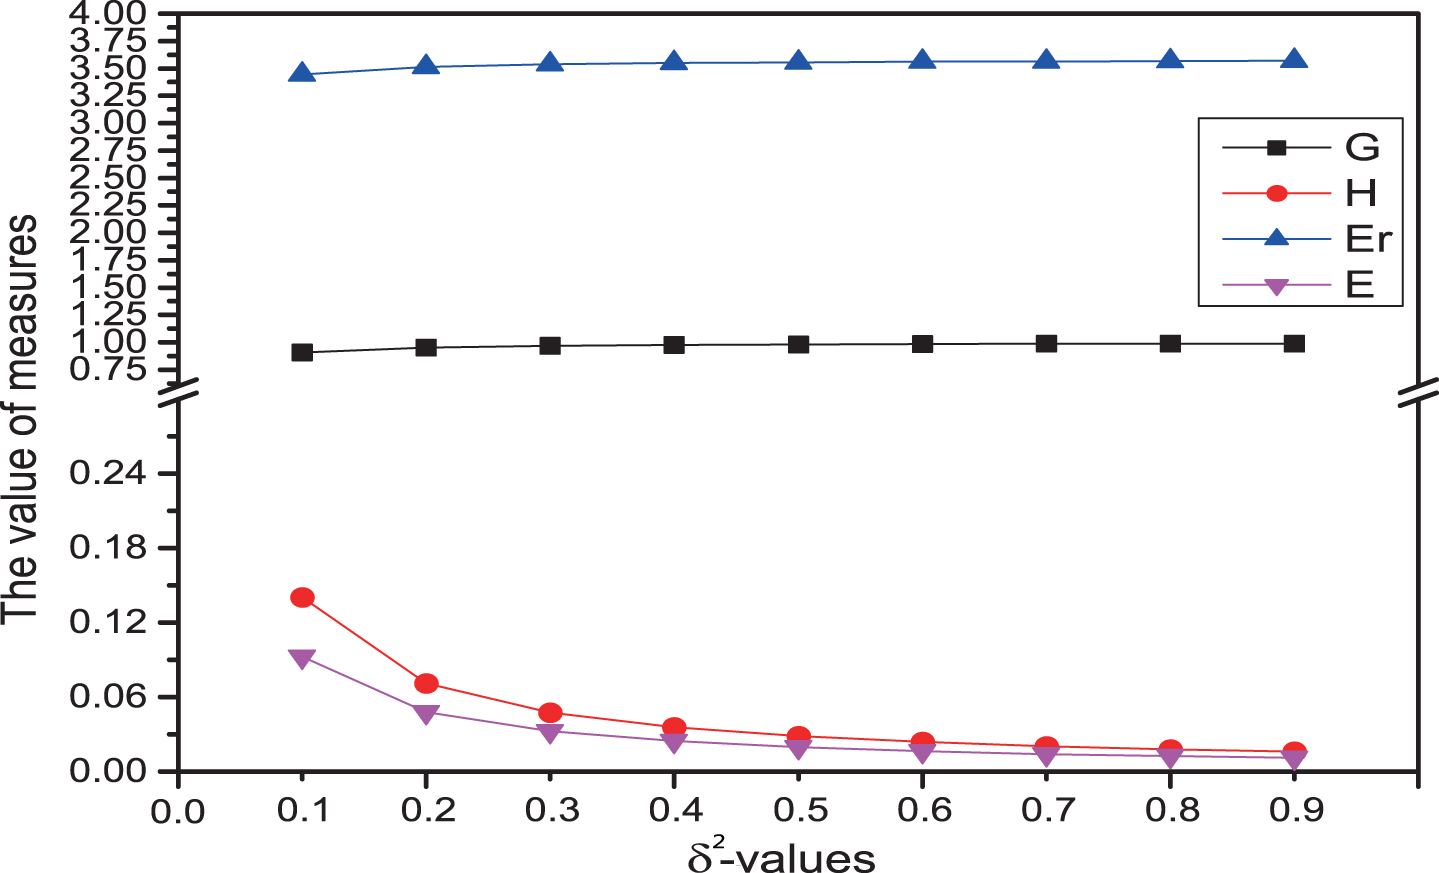
Uncertainty measures of (U, P5) with different δ.

Uncertainty measures of (U, A) with different δ.
(2) If we pick
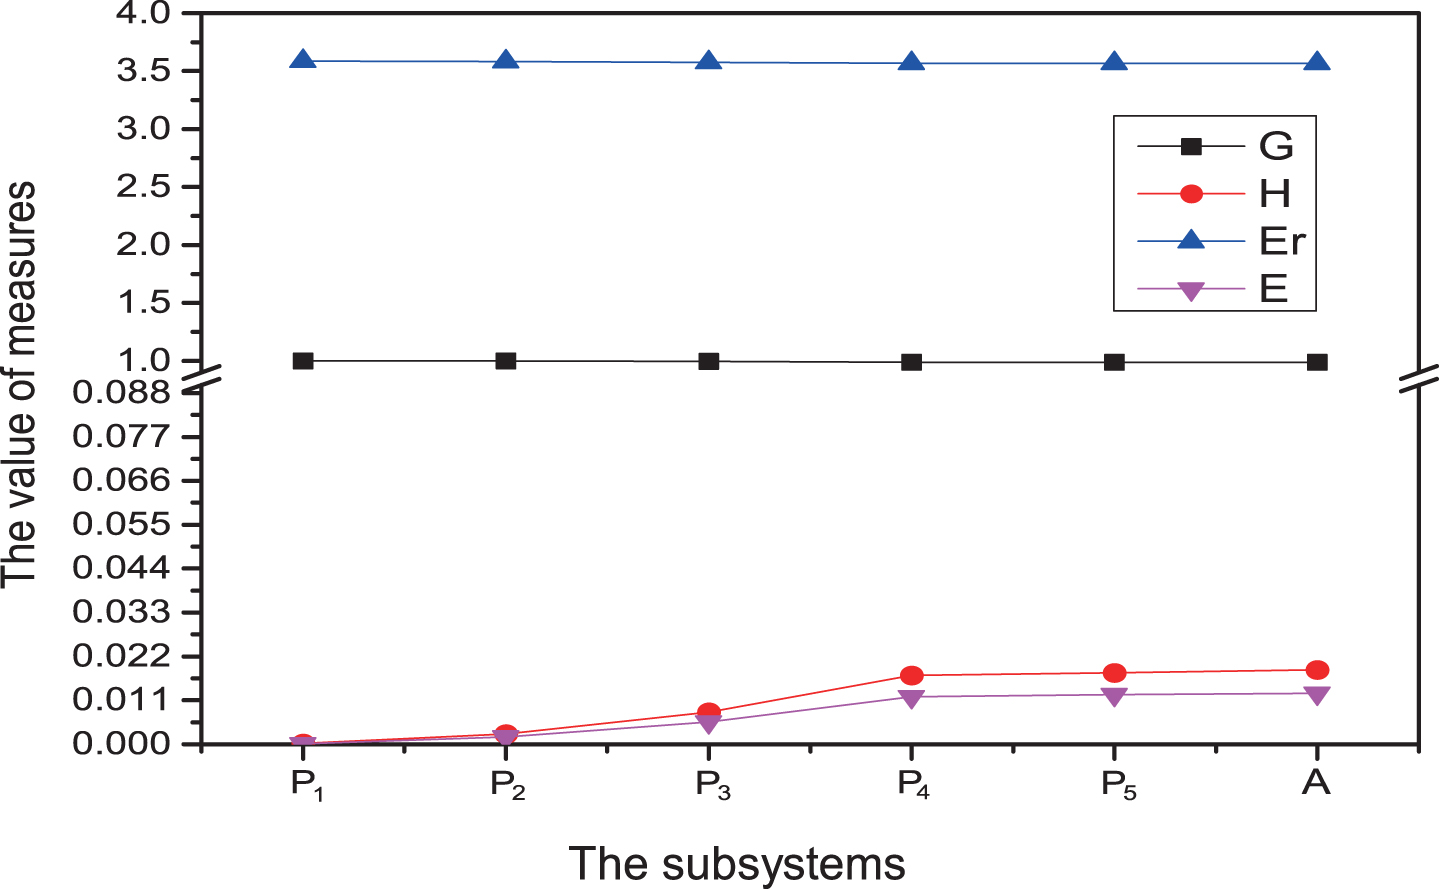
Uncertainty measures of subsystems with the fixed value
To evaluate the performance of measuring uncertainty in an image information system, this section conducts analyzes the effectiveness of the proposed measures from the angle of statistics.
Dispersion analysis
In actual statistical work, we often research the dispersion degree of a data set. A amount used to measure the dispersion degree of a data set is called a difference measure. The common difference measures have range, four point difference, average difference, standard deviation, standard deviation coefficient and so on.
In this paper, we apply the standard deviation coefficient to do effectiveness analysis of the proposed measures.
Given a data set X = {x1, ⋯ , x
n
}. Then its arithmetic average value
Then
So
Thus
From Figures 1–6 and Table 2, we obtain the following results:
Dispersion analysis of subsystem of CV with different δ
Dispersion analysis of subsystem of CV with different δ
(1) If we only need monotonicity, then G δ , E r δ , H δ and E δ have better performance for measuring uncertainty of an image information system.
(2) If we only consider the dispersion degree, then E r δ has better performance for measuring uncertainty of an image information system.
In statistics, Pearson correlation coefficient is a measure of the strength of a linear correlation between two variables or two data sets.
Given two data sets X = {x1, ⋯ , x
n
} and Y = {y1, ⋯ , y
n
}. Pearson correlation coefficient between X and Y, denoted by r (X, Y) or r
XY
, is defined as follows:
Obviously,
If r (X, Y) =0, then there is no correlation between X and Y; if r (X, Y) >0, then the correlation between X and Y is positive; if r (X, Y) <0, then the correlation between X and Y is negative. Particularly, r (X, Y) =1 indicates completely positive correlation between X and Y, and r (X, Y) = -1 means completely negative correlation between X and Y.
The closer the absolute value of Pearson correlation coefficient r is to 0, the smaller the degree of correlation between variables; conversely, the closer the absolute value of Pearson correlation coefficient r is to 1, the greater the degree of correlation between variables. Generally speaking, the degree of correlation can be classified as follows: when |r|=1, this correlation is called as complete correlation; when 0.7 ≤ |r|<1, this correlation is called as height correlation; when 0.4 ≤ |r|<0.7, this correlation is called as moderate correlation; when 0 < |r|<0.4, this correlation is called as low correlation; when r = 0, this correlation is called as no correlation.
Pick
Then
The results are shown in Table 3.
r-values of sixteen pairs of measure values sets for measuring uncertainty of the (U, A) with different δ-values
r-values of sixteen pairs of measure values sets for measuring uncertainty of the (U, A) with different δ-values
“
“
In this section, we give an application of the proposed measurement for attribute reduction.
In this paper, the set of all δ-coordination subsets (resp., all δ-reducts) of A is denoted by co δ (A) (resp., red δ (A)).
Obviously,
Since P ⊆ Q, we have
Note that |S
P
(x
i
) | = pi1 + pi2 + ⋯ + p
in
and |S
Q
(x
i
) | = qi1 + qi2 + ⋯ + q
in
. Then by |S
P
(x
i
) | = |S
Q
(x
i
) |, we obtain that
Thus ∀ i, qi1 - pi1 = qi2 - pi2 = ⋯ = q in - p in = 0 .
Hence P = Q.□
. This is obvious.
. Suppose H δ (P) = H δ (A). Then, we have
So
Note that
So ∀ i,
By Lemma 8.5,
Hence
P ∈ red δ (A) ⇔ H δ (P) = H δ (A) and ∀ a ∈ P, H δ (P - {a}) ≠ H δ (A) .
Below, we give reduction algorithm in an image information system based on δ-information entropy.

Algorithm 3 uses H to obtain the feature which is added to the the current selected coordinated set in each loop. This algorithm terminates when the addition of any remaining feature does not decrease the evaluating function. For a dimensionality of |A|, the time complexity for computing δ-information entropy is |A|, the worst search time for a reduct will result in |A| (|A|+1)/2 evaluations of the evaluation function. The overall time complexity of Algorithm 3 is O (|A|2).
Comparison and discussion
In this section, we make comparison and discussion with literatures [40, 45] so as to see the innovation of this article more clearly.
(1) All three articles consider images as the informational values and use Gaussian kernel.
(2) This paper and literatures [40] are based on granular computing. Thus, the research ideas of two articles are the same and the obtained results are similar.
(3) The differences of three articles are as below.
a) The studied information systems are different: This article considers an image information system and literatures [40, 45] study a hybrid information system with images.
b) The constructed information granules are different: This article only construct information granules that are formed by images as information values and literatures [40, 45] construct information granules that are formed from various information values. It can be said that dealing with image information values is more difficult.
c) The obtained results are different: This article give information structures and uncertainty in an image information system and literatures [45] obtain dynamical updating fuzzy rough approximations under the variation of attribute values.
d) This paper not only gives the uncertainty measurement for an image information system, but also makes effectiveness analysis of the given measures. literatures [40] only proposes the uncertainty measurement for a hybrid information system with images.
Conclusions
An image information system is an information system where each of its information values is an image. Based on the idea of granular computing, we construct information granules as shown in Figure 8.

Initialization of information granules in an image information system.
Gaussian kernel has been used to extract a fuzzy T cos -equivalence relation on the object set of a given image information system. Dependence between two information structures has been depicted. By using information structures, uncertainty measurement for an image information system have been investigated. Effectiveness analysis has been done about the proposed measurements. Theoretical and effectiveness analysis illustrate the fact that granulation measures and entropy measures can be applied to measuring uncertainty of an image information system. An application of the proposed measurement for attribute reduction has been given. In future work, we will study three-way decisions in an image information system.
Footnotes
Acknowledgments
The authors would like to thank the editors and the anonymous reviewers for their valuable comments and suggestions, which have helped immensely in improving the quality of the paper. This work is supported by National Natural Science Foundation of China (11971420), Natural Science Foundation of Guangxi (2018GXNSFDA294003, 2018GXNSFDA281028, 2018GXNSFAA294134), Guangxi Science and Technology Program (2017AD23056),Guangxi Higher Education Institutions of China (Document No. [2018] 35 and [2019] 52), Special Scientific Research Project of Young Innovative Talents in Guangxi (2019AC20052), Key Laboratory of Software Engineering in Guangxi University for Nationalities (2020-18XJSY-03), Research Project of Institute of Big Data in Yulin (YJKY03), Engineering Project of Undergraduate Teaching Reform of Higher Education in Guangxi (2017JGA179) and the project of improving basic scientific research ability of young and middle-aged teachers in Guangxi Universities (2020KY14013).