
Abstract
Air pollution management is becoming a major topic of political concern, and many studies have devoted to the efficiency measurement of air pollution management. However, several drawbacks must be overcome for better applying efficiency measurement to improve air pollution management, including neglect of the importance of different indicators, non-integrity of indicator information for efficiency measurement, and lack of analyzing regional factors in the efficiency of air pollution management. Accordingly, by utilizing the evidential reasoning (ER) approach with entropy weighting method to propose an ER-based indicator integration and introducing the slacks-based measure (SBM) model with consideration of undesirable outputs and the regression model to propose an SBM-based efficiency analysis, a new air pollution management method, called integrated ER-SBM method, is developed in the present study. In the case study of Chinese 29 provinces, the application procedure and results are provided to illustrate how to apply the integrated ER-SBM method to integrate various air pollution indicators with different importance and further analyze the influence of regional factors, such as technological innovation, regional population density, import-export values, number of industries, and energy resources, on the efficiency of air pollution management. In addition, the policy recommendations targeting the results are concluded as well.
Introduction
In the response to global climate changes, Chinese government has formulated a series of policies and regulations to reduce greenhouse gases and atmospheric pollutant emissions. According to the policy published in 2009, China’s carbon dioxide (CO2) emissions per unit of GDP growth need to be reduced by 40–45% in 2020 compared with CO2 emissions in 2005 [1]. The documents submitted to the United Nations in 2015 further showed that China’s CO2 emissions would be decreased by 60–65% [1, 2] in 2030 compared with 2005. However, besides the conflict relationship among air pollution management and economic development, air pollution has gradually become an important factor affecting social progress and hindering environmental sustainable development. The key approach to solve air pollution problem is to formulate a scientific and effective input-output assessment method for pollution control. Due to the complexity, destructiveness, and publicity of air pollution emissions, it is also necessary to ensure that the assessment method is suitable to analyze the efficiency of air pollution management for different regions, which is not only conducive to improving the efficiency of air pollution management, but also promoting the sustainable development of environment.
To best of our knowledge, existing efficiency assessment methods were mainly based on data envelopment analysis (DEA) model for environmental efficiency assessment [3, 4]. For example, some scholars applied DEA model for regional air pollution management efficiency measurement to analyze the possible impact of air pollution on society health [5, 6]. Because of the undesirable outputs of environmental management, the models which can handle undesirable outputs are introduced for environmental efficiency evaluation [7, 8], in which the slacks-based measure (SBM) model with consideration of undesirable outputs is one of the classic DEA model for efficiency evaluation in air pollution management. However, three challenges still need to be overcome for better air pollution management: Although there is lots of air pollution indicators involved in air pollution management, however, some of them were selected to measure the efficiency of air pollution management in previous studies. This is an inappropriate way to select air pollution indicators because it would lead to the non-integrity of indicator information. However, when all air pollution indicators are used in a DEA model without indicator preprocessing, the relative efficiency calculated by the DEA model will approximate 1, because any DEA model has certain limitations on the number of inputs and outputs. The selection of indicators usually makes sense that an indicator is selected by 100% importance or is abandoned by 0% importance, and all selected indicators are equally used to measure the efficiency of air pollution management. It is clear that the importance of different input and output indicators is neglected in indicators selection. Although integration methods can be used to integrate multiple indicators into one indicator, the weight of these indicators should be identified according to the hidden information in historical data, instead of experts’ knowledge with subjective preference. Previous studies mainly focused on the efficiency measure of air pollution management, but ignored the influences of regional factors on the efficiency of air pollution management. In actual practices, an effective air pollution management is an optimization of existing investment resources, including capital, technological innovation and human resources. Hence, how to effectively optimize the allocation of input and output indicators is the key to effectively improve the efficiency of air pollution management.
To overcome the above-mentioned three challenges of the previous studies on air pollution management, a new method for air pollution management is proposed by considering the integration of air pollution indicators for better efficiency measurement and investigating the influence of regional factors on the efficiency of air pollution management, in which the basis of indicator integration and efficiency measurement is the evidential reasoning (ER) approach [9] and the SBM model [10], respectively, the proposed new method is so called an integrated ER-SBM method. The contributions of the integrated ER-SBM method can be conclude as follows: Apart from the ER approach, an entropy weighting method is introduced to calculate the weight of air pollution indicators. Consequently, as one of main components of the integrated ER-SBM method, the ER-based indicator integration can not only effectively reduce the number of inputs and outputs without the loss of indicator information, but also highlight the different importance of indicators in indicator integration for efficiency measurement. Owing to the integration of indicators, the integrated indicator from various air pollution indicators is applied for efficiency measurement by the SBM model, which can measure the efficiency of air pollution management with undesirable outputs. It is clear that the indicators integration is helpful to distinguish the relative efficiency of different decision-making units (DMUs) by reducing the number of indicators. The integrated ER-SBM method not just focuses on the efficiency measurement of air pollution management, the hidden relationship among technological innovation, energy consumption, and the efficiencies measured by the SBM model are comprehensively analyzed and the influence of regional factors on the efficiency of air pollution management are also discussed via a regression model to further investigate regional air pollution management.
The remainder of this work is as follows: Section 2 is the literature review and limitations of previous air pollution management. Section 3 introduces an integrated ER-SBM method for air pollution management. Section 4 provides a case study regarding the air pollution management in China. Section 5 concludes the studies.
Literature review and challenges
Air pollution is a substantial adverse impact on social security and stability. Many studied have been done to improve the management of air pollution. In this section, the previous studies of air pollution measurement are reviewed in Section 2.1 and the challenges of these previous studies are summarized in Section 2.2.
Reviews on air pollution management
Early studies on pollution management mainly focused on characterizing and evaluating the influence of air pollution on human health and social development. For example, Burnett et al. [11] indicated that the fine particulate matter should be considered to be a reason for lung function diminished and the development of asthma; Knittel et al. [12] and Yin et al. [13] also carried out the study of air pollution management and showed the negative respiratory impacts of air pollution; Ebenstein et al. [14] considered the relationship of air pollution with people life expectancy, indicating that a long-term exposure to air pollution is associated with a reduction in life expectancy at birth of about 3 years. Huang et al. [15] indicated that air pollution is a well-known health hazard, so it is crucial to understand the influence of air pollution. Xu et al. [16] highlighted the relationship between air pollution and stock returns by investigating people’s awareness of air pollution; Zhao et al. [17] estimated the benefits of reducing air pollution and validated whether it can help to the progress of sustainable development of China.
Hereafter, scholars began to make some studies on air pollution management, however most of these studies discussed that air pollution management is only based on one type of pollutant indicator or few air pollutant indicators. For example, Ye et al. [7] analyzed the green production efficiency of industrial sectors by considering sulfur dioxide (SO2) and CO2 emission; Li et al. [18] proposed a dynamic network SBM model with CO2, SO2, and nitrogen dioxide (NO2) emissions to measure the efficiency of air pollution management. Previous studies also considered combining air pollution with other pollution indicators in pollution management, i.e., Chen et al. [19] selected CO2, SO2 and chemical oxygen demand in water pollution to evaluate the effect of pollution management; Hong et al. [20] added air and water pollution indicators into the construction of efficiency measurement model for environmental management, but it lacked of in-depth assessment on air pollution management. From the above previous studies, it is clear that there is not a consistent framework on how to select effective air pollution indicators, which leads to the differences in indicators selection of air pollution management.
In the previous studies on the efficiency measurement of air pollution management, DEA model is the commonly used model but the input-output indicators used for constructing DMUs were often selected by the experience of experts, leading to the fact that the differences of indicators fail to be reflected in efficiency measurement. For example, Li et al. [21] carried out an abundant study on the relationship between input and output of air pollution and the efficiency of air pollution management; Wang et al. [22] proposed a new indicator to evaluate the air pollution emission efficiency in different regions of China without considering indicators differences; Zhang et al. [23] constructed a three stages DEA model with the output of air pollution to analyze industry efficiency; Ren et al. [24] proposed an evaluation model for air pollution analysis but the selection and construction of indicators are not effectively used to combine with the evaluation model.
Additionally, the previous studies on air pollution management also include the analysis of the relationship between influencing factors and air pollution management. For example, Long et al. [4] added air pollution indicators into a regression model to analyze the efficiency of 268 cities in China after Beijing Olympic Games; Gao et al. [25] analyzed whether regional cooperation of air pollution management can improve the effectiveness of air pollution management by the game theory. However, previous studies on the influencing of regional factors on pollution management were only based on the analysis of whole environmental governance, which added different types of pollutants in efficiency analysis, such as water pollution indicator, solid waste indicator, and forest greening indicator. The relationship between regional factors and air pollution management efficiency in different regions did not are in-depth analyzed in previous studies.
Limitations of existing air pollution management
According to the above review on the air pollution management, the main process of the existing methods can be summarized, as shown in Fig. 1.
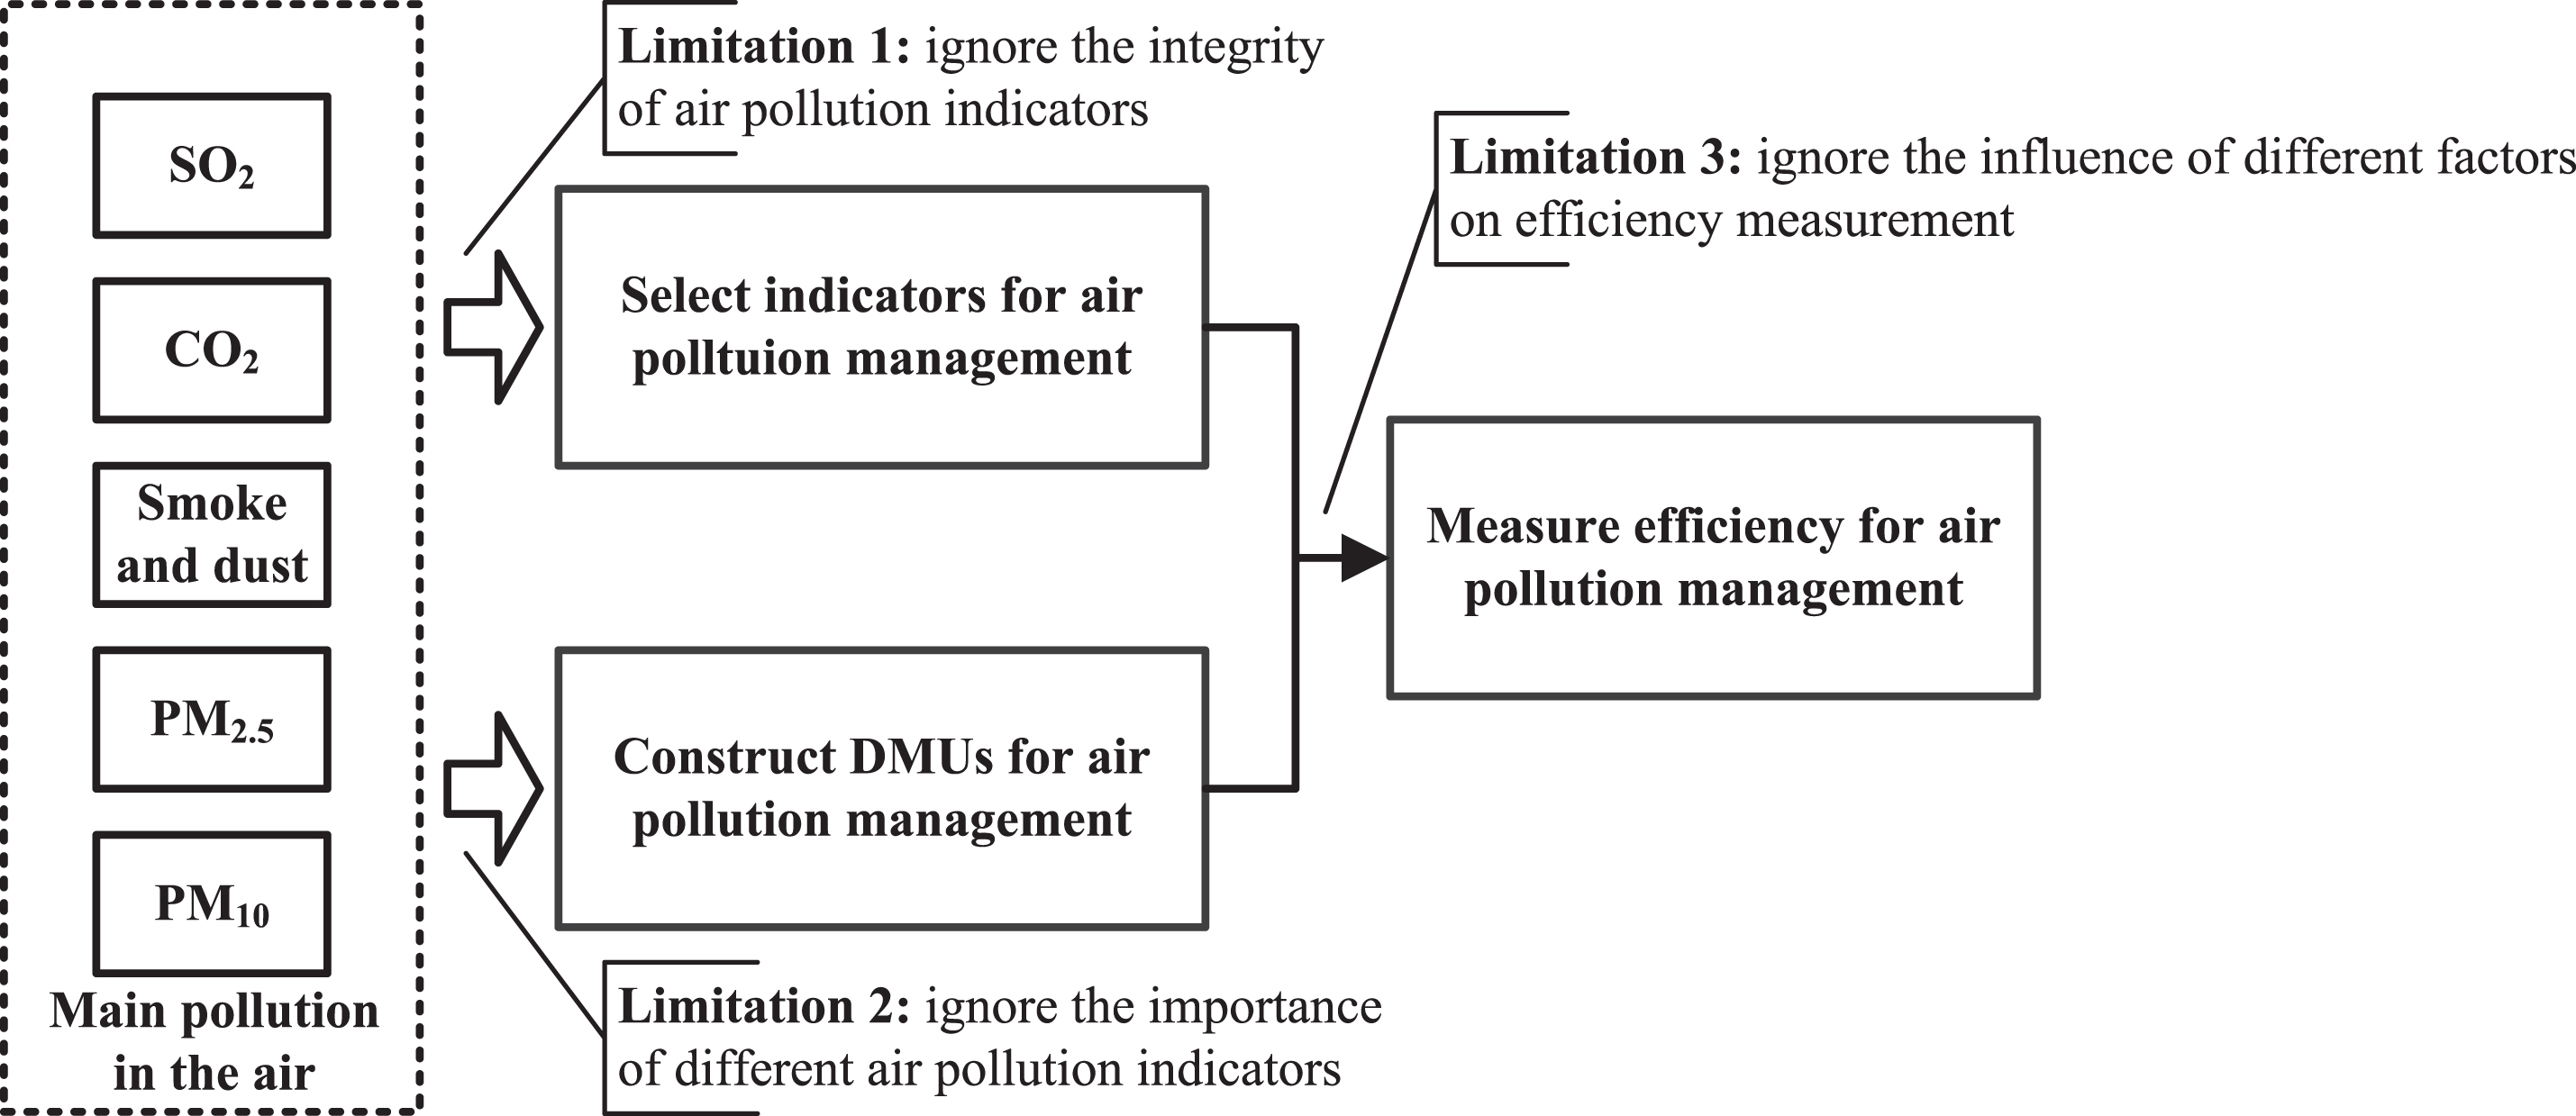
Main process and limitations of existing methods.
From Fig. 1, three limitations of existing methods can be identified as follows: Ignore the integrity of air pollution indicators. In previous studies, air pollution management was mainly based on one type of air pollutant or a single air pollution indicator, leading to the issue of information loss and the negative influence made by subjectivity, because few indicators are selected from a larger number of indicators by personal preference to study air pollution management. However, when all kinds of air pollution indicators are used in a DEA model without indicator preprocessing, the DEA model will lose its ability in the efficiency measurement of air pollution management, because any DEA model has certain limitations on the number of input and output indicators. Ignore the importance of different air pollution indicators. Previous studies on the efficiency measurement of air pollution management showed that it is easy to ignore the difference of the importance between input and output indicators, so it is difficult to reflect the accurate results among different research objects. At the same time, although some integration methods, such as weighted sum and ER approach, can be used to integrate multiple similar indicators into one indicator, the weight of these similar indicators to be integrated should be identified according to the hidden information in historical data, instead of experts’ knowledge with subjective preference, which will result in the inaccuracy of indicators integration. Ignore the influence of different factors on efficiency measurement. Previous studies on air pollution management only pursue if the efficiency of air pollution management can be efficiently measured by DEA models, most of them failed to further analyze the influence of different factors on air pollution management. However, in actual practices, there is no disputing the phenomenon that many uncertain factors may affect the treatment of air pollutants, such as the impact of technological innovation, population density and economic development in different regions.
From the above analyses, it is clear that the existing studies have some limitations in air pollution management. Thus, in the coming sections, various kinds of air pollution indicators with weight calculation are considered to construct DMUs for the efficiency measurement of air pollution management. Moreover, by considering the relationship between efficiency and different regions, the influencing factors on air pollution management are also analyzed.
In this section, an indicator integration method is proposed based on ER approach with an entropy weighting method, which is so called ER-based indicator integration. At the same time, an SBM model with a regression model is developed to analyze the influence of regional factors on air pollution management, which is named SBM-based efficiency analysis.
ER-based indicator integration for air pollution management
Air pollution management involves a large number of various air pollution indicators, but few of them were applied in previous studies to determine the degree of air pollution due to the complexity of considering all indicators. However, an incomplete set of indicators usually cause information loss and calculation errors in air pollution management. Therefore, an ER-based indicator integration method is proposed to ensure the integrity of indicator information.
Weight calculation of different indicators
Since different indicators inevitably have different importance in air pollution management, it is necessary to quantify the importance of air pollution indicators. Based upon the view of point, an entropy weighting method is used to calculate the weight of air pollution indicators. It is worth noting that the reason why focuses on the entropy weighting method is that 1) the entropy weighting method is an objective weighting method, so that it can largely avoid the interference of subjective factors; 2) the kernel of the entropy weighting method is based on the information entropy, which is able to obtain a more objective weight for each indicator; 3) Due to the differences of indicator importance by experts, the weight assigned by a subjective method may be different and there is a certain deviation in the result of subjective judgment.
In the process of calculating weights for each indicator using the entropy weighting method, suppose that air pollution management includes S regions and T air pollution indicators, xs,t (s = 1, ... , S; t = 1, ... , T) is the observed value of the tth indicator in the sth regions. Considering that the units of different indicators are not uniform, these observed values should be normalized before using them to calculate weights. The most commonly used normalization method is as follows:
Thereafter, based on the normalized values zs,t, the proportion, denoted as ps,t, for the tth indicator in the sth region can be calculated by using the following formula:
Next, the entropy value, denoted as e
t
, for the tth indicator is calculated by:
Finally, the entropy weight, denoted w
t
, for the tth indicator can be obtained by:
After calculating entropy weights for air pollution indicators shown in
In the process of integrating indicators with their entropy weights using the ER approach, suppose that air pollution management includes S regions and T air pollution indicators, xs,t (s = 1, ... , S; t = 1, ... , T) is the observed value of the tth indicator in the sth region, w
t
is the entropy weight of the tth indicator obtained from
where
Afterwards, the integrated value of the T indicators for the sth regions, denoted as x
s
, can be calculated according to the average utilities as follows:
Air pollution efficiency analysis is an indispensable part of air pollution management, so it is necessary to measure the efficiency of air pollution management and also investigate the influence of regional factors on the efficiency. Hence, in this section, the SBM model with the consideration of undesirable outputs is introduced to measure the efficiency of air pollution management firstly, followed by the use of the regression model to analyze the influence of regional factors on efficiency measurement.
In the process of measuring efficiencies for air pollution management, suppose that there are S regions and each region involves T1 input indicators, T2 desirable output indicators, and T3 undesirable output indicators, the observed values of the three kinds of indicators are denoted as a s = (as,j; j = 1, ... , T1), b s = (bs,k; k = 1, ... , T2), and c s = (cs,h; h = 1, ... , T3), respectively, for the sth region. Thus, S DMUs can be constructed according to the value of input, desirable output and undesirable output indicators as follows:
Next, for a certain DMU, i.e., (a
s
, b
s
, c
s
), its efficiency can be obtained by using the following SBM model with the consideration of undesirable outputs:
It is unnecessary to specify the production function form of inputs and outputs for SBM model, so the efficiency can be evaluated under complex production relations; The measurement of efficiency using SBM model is not affected by the selected unit of input-output data, and it can process both proportional data and non proportional data at the same time, that is, proportional data and non proportional data can be used in input and output data; The weight of SBM model is generated by mathematical programming according to data, so it does not need to set the weight of input and output in advance, and it is not affected by human subjective factors; SBM model can be used to actual efficiency analysis, which can further understand the use of resources in DMUs, and it can be also used as a reference for managers to make decisions.
Based on the efficiencies obtained from SBM model, the influences of regional factors on efficiency evaluation can be analyzed by a regression model, which is an important mathematical model that includes a statistical process to estimate the relationship between independent and dependent variables, in which the regional factors can be defined as follows:
According to the regional factors RFs,i derived from Definition 1 and the efficiencies θ
s
derived from Equation (19), the following regression model is introduced to analyze the influence of P regional factors on the sth efficiency:
Based on the ER-based indicator integration shown in

Theoretical framework of integrated ER-SBM method for air pollution management.
According Fig. 2, the detailed steps of the integrated ER-SBM method are as follows:
The ER-SBM method includes the weight calculation for air pollution indicators, which can avoid the limitation of giving weights by experts in indicator integration. In other words, the integration of air pollution indicators based on weight calculation method is able to reflect the importance difference and objectivity of different indicators. A complete set of air pollution indicators can be integrated into a unified indicator for ensuring the integrity of indicator information. Moreover, the reduction of indicator number contributes to meet the requirements of the DEA-related models in term of the maximum number of inputs and outputs. The ER-SBM method is an efficiency analysis tool because it allows that regional factors are considered in the efficiency measurement by a regression model, so that some common factors, e.g., technological innovation coefficient, can be regarded independent various to analyze the efficiency of air pollution management.
To verify the integrated ER-SBM method for air pollution management, the regional air pollution management data of 29 provinces in the mainland China are utilized to perform a case study according to the following aspects: The data source and variable definition are showed in Section 4.1. The results and validation of air pollution management method is in Section4.2. Different performances of air pollution management efficiency are analysis in Section 4.3. Influence of different factors on air pollution management efficiency is in Section 4.4.
Data source and variable definition
According to the indicators used in the previous studies [26], three indicators named energy consumption, air pollution treatment input, and labor input are selected as input indicators; one indicator named gross domestic product (GDP) is selected as desirable output indicator; and another four indicators named SO2, CO2, smoke and dust, and inhalable particulate matter (PM) are selected as undesirable output indicators for the efficiency measurement of air pollution management. Based on these indicators, the corresponding environmental data of 29 provinces in mainland China from 2010 to 2016 are collected from China Environmental Statistical Yearbook, China Energy Statistical Yearbook and China Statistical Yearbook. The statistic analysis of environmental data is showed in Table 1, in which the energy consumption is calculated by the amount of coal consumed in each province; the air pollution treatment input is measured by the input of industrial waste gas treatment, and the labor input is calculated by the number of employees in environment management. Additionally, it is clear from Table 1 that there is a significant difference in the observed data of air pollution indicators, i.e., the ratio of standard deviation to mean in SO2 is 38/96×100% = 39.58%.
Statistic analysis of environmental data of input and output indicators
Statistic analysis of environmental data of input and output indicators
In order to analyze the influence of different factors on the efficiency measurement of air pollution management, five kinds of regional factors, including technological innovation, regional population density, import-export values, number of industries, and energy resources, are introduced and the detailed description of these regional factors are shown in Table 2, in which the technological innovation is assessed by the university enrollment, education funds, new products and number of patent based on the Equation (20), and all these technological innovation-related indicators are shown in Table 3.
Definition of variables in regression analysis
Definition of technological innovation
In this section, the application procedure and intermediate results of the proposed ER-SBM method are provided when measuring the efficiency of Chinese 29 provinces for air pollution management.
Firstly, based on the ER-based indicator integration for air pollution measurement, all the undesirable output indicators shown in Table 1 should be integrated into one indicator. Hence, according to the process of weight calculation shown in Section 3.1.1, the entropy weight of SO2, CO2, smoke and dust, and PM can be calculated using the historical data shown in Table 1. Afterwards, when the number of evaluation grades used to each undesirable output indicator is assumed to be 5, the specific evaluation grades and their utility values can be initialized by experts’ knowledge and the lower and upper bounds of each indicator, as well as the utility values used for the integrated indicator, which can be calculated by Equation (14) shown in Section 3.1.2. Taking the air pollution management of Beijing as example, the results of entropy weights and utility values are shown in Table 4. It is clear from Table 4 that the weights of the four air pollutants are quite different, for example, the weight of smoke and dust is lower than other undesirable output indicators, whose value is 0.1648. The undesirable output indicator with the highest weight is PM, whose value is 0.3152.
The weight and evaluation grade for air pollution integration
The weight and evaluation grade for air pollution integration
Based on the entropy weights and utility values shown in Table 4, the environmental data of four undesirable output indicators can be integrated into new data using the steps of ER-based indicator integration shown in Section 3.1.2. Taking the environmental data derived from 29 provinces at 2016 for an example, the integrated data are shown in Fig. 3. It can be found from Fig. 3 that the integrated data of Hebei, Shanxi, Neimenggu, Liaoning, Shandong and Henan provinces are the highest, while the integrated data of Hainan, Beijing, Tianjin, Shanghai and Fujian provinces are lower than other provinces. This result is related to the regional differences in China, because the air pollution in the southern region is generally lower than that of the northern region in China. Therefore, future policy should focus on the air pollution management of northern region in China.
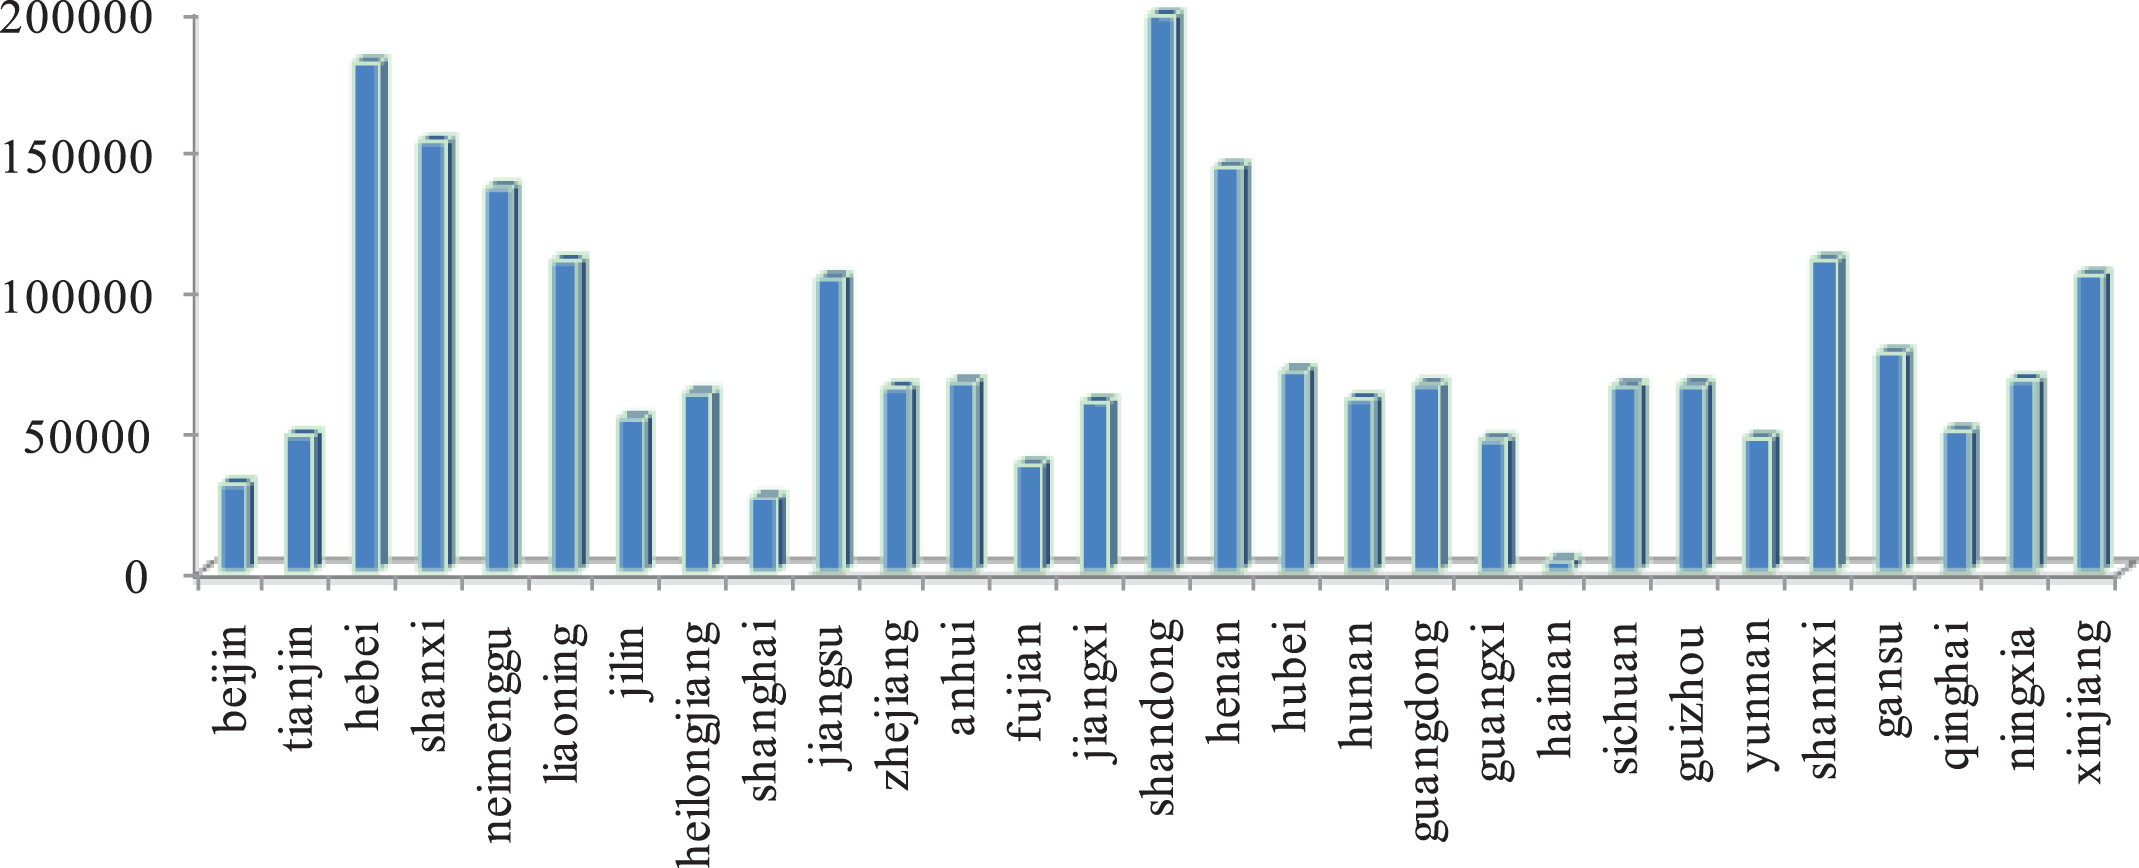
Air pollution of different provinces in 2016 based on indicators integration.
Based on the above similar process of integrating undesirable output indicators, the integrated data of all provinces from 2010 to 2016 can be obtained and they are showed in Fig. 4. It is clear from Fig. 4 that the overall change trend of integrated air pollution emissions in all provinces is relatively consistent in each year. The provinces with the largest air pollution emissions are mainly concentrated in Hebei, Inner Mongolia, Liaoning, Jiangsu, Shandong, and Sichuan provinces, Moreover, there are significant regional differences in integrated air pollution emission, for example, the concentration of air pollution emissions is low in the southern regions of Fujian, Anhui, Zhejiang, and Hunan provinces, while the integrated air pollution emissions are much high in the northern regions of Shandong, Hebei, Henan provinces and the northeastern region Liaoning and Jilin provinces.
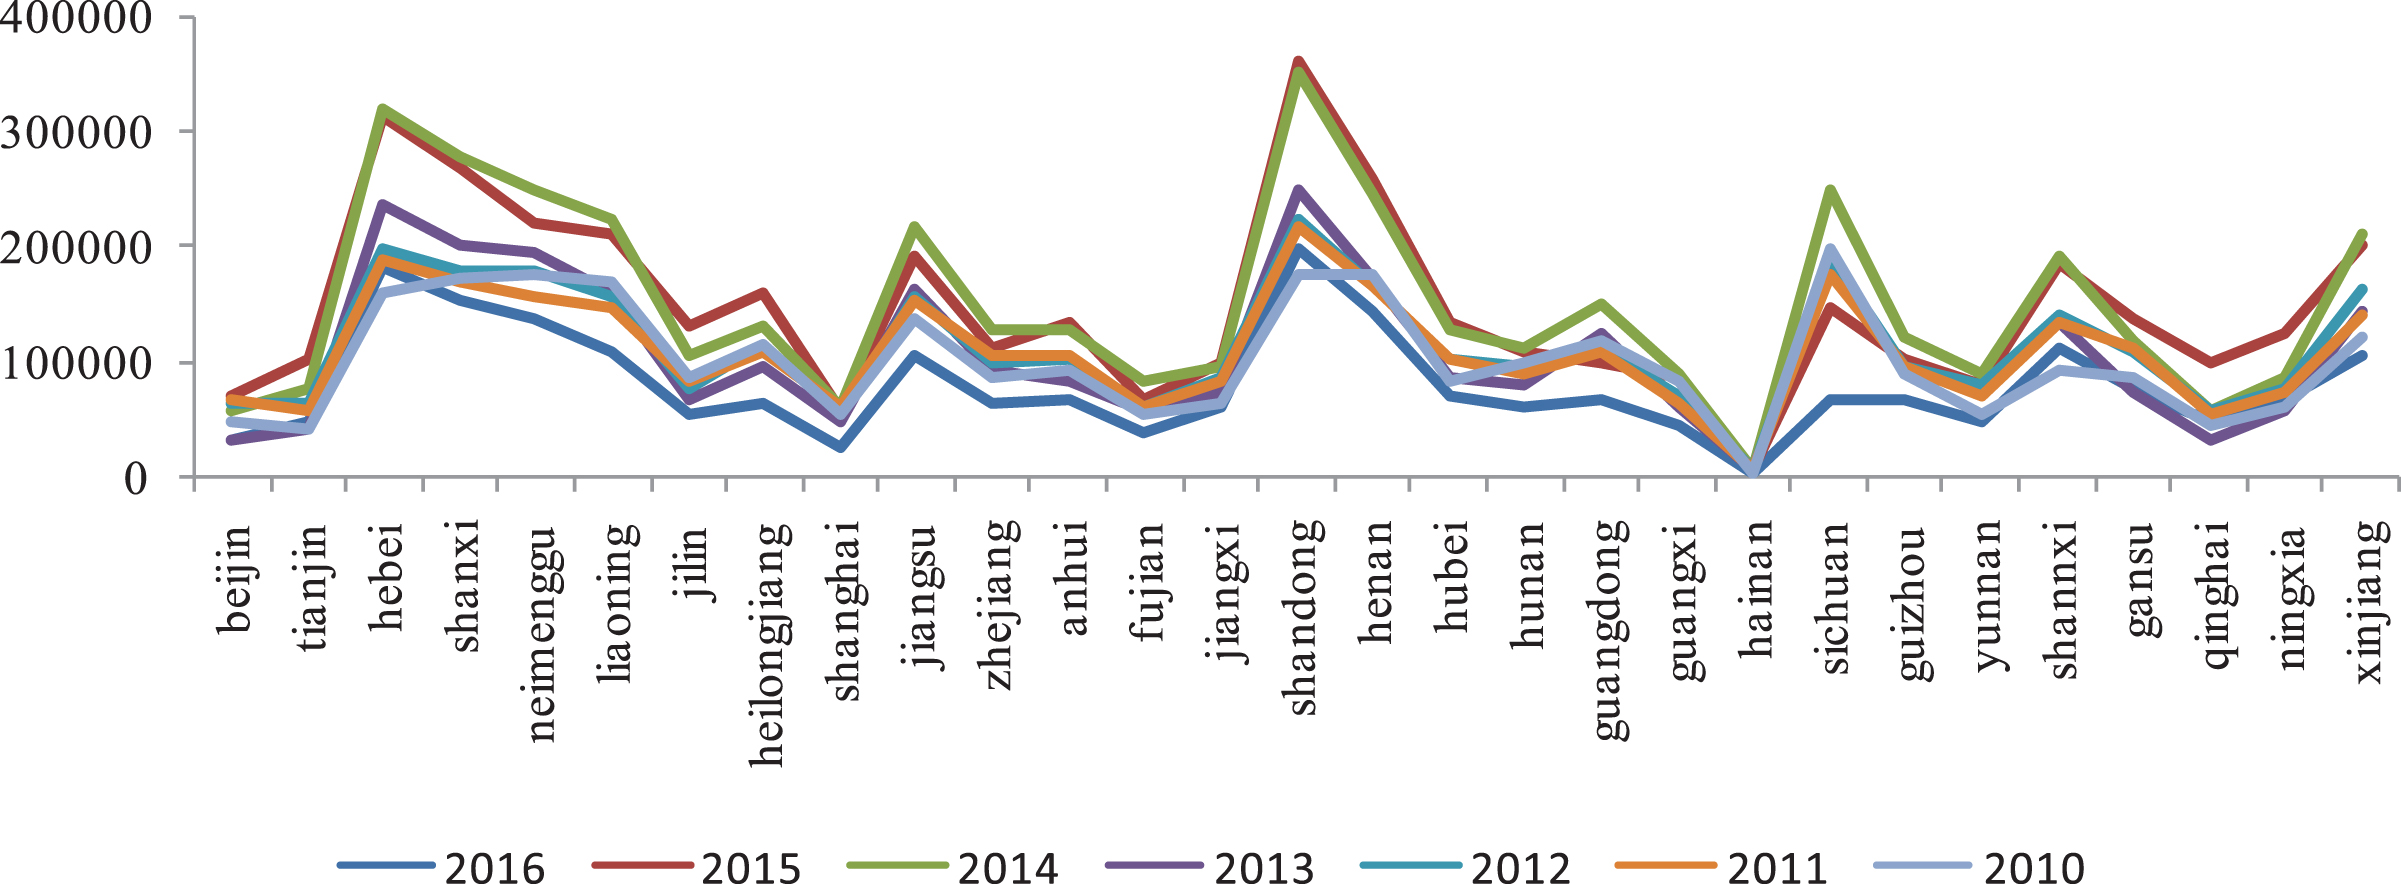
Integrated air pollution of different provinces from 2010 to 2016.
In order to further analyze the change of integrated air pollution from 2010 to 2016, the average value of the integrated air pollution of all provinces for each year are calculated and they are shown in Fig. 5. From Fig. 5, the air pollution in 2010–2016 presents an inverted “U” type, that is, the air pollution rises rapidly from 2010 to 2013, the total emission of air pollution in 2014 and 2015 reaches the maximum, and shows a certain downward trend by 2016. Although the overall emissions of air pollution decreased significantly in 2016, air pollution is still a key factor restricting social development and residents’ health in various regions of China. Therefore, a reasonable air pollution management and its efficiency measurement are particularly important for social sustainable development.
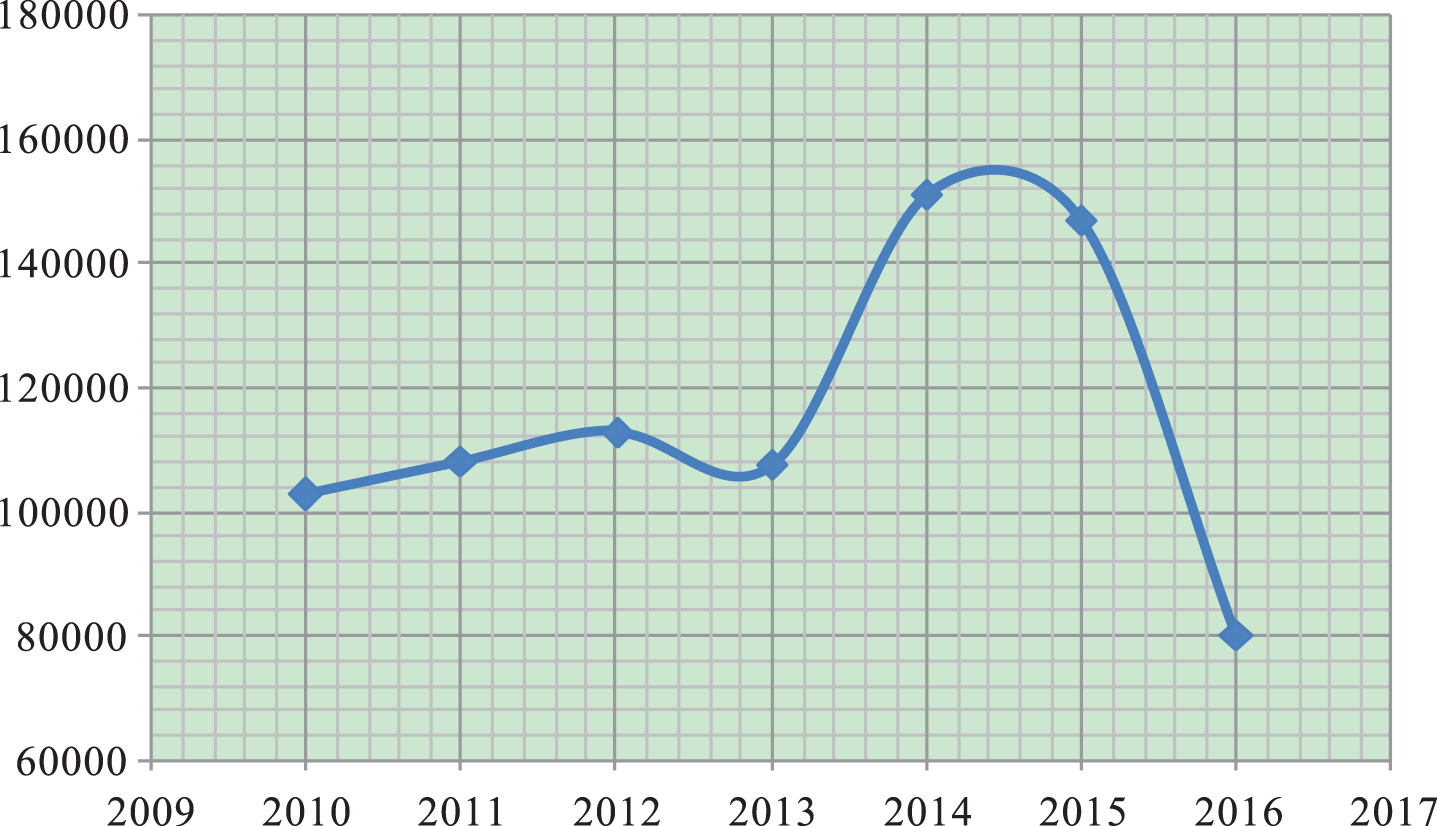
Average value of integrated air pollution for all provinces from 2010 to 2016.
After integrating undesirable output indicator for all provinces of 2010 to 2016, the integrated data together with input and desirable output data can be used to construct DMUs and further used to measure efficiency of each provinces based on the SBM-based efficiency analysis shown in Section 3.2. Taking the efficiency measurement for 2016 for an example, Fig. 6 shows the efficiency of 29 provinces. From Fig. 6, the efficiency of air pollution management in China is quite different, and most provinces have not achieved relatively effective air pollution management. The possible reason is that although the cost of air pollution management in different regions increases rapidly, the emission of pollutants also shows an increasing trend. Therefore, although the economic growth rate is accelerating, the problem of air pollution is also an increasingly serious problem. It can be inferred that, considering China’s actual development situation, the current focus of the government is still on economic development, which shows that the government’s air pollution management system is still not perfect in the efficiency measurement of air pollution management.
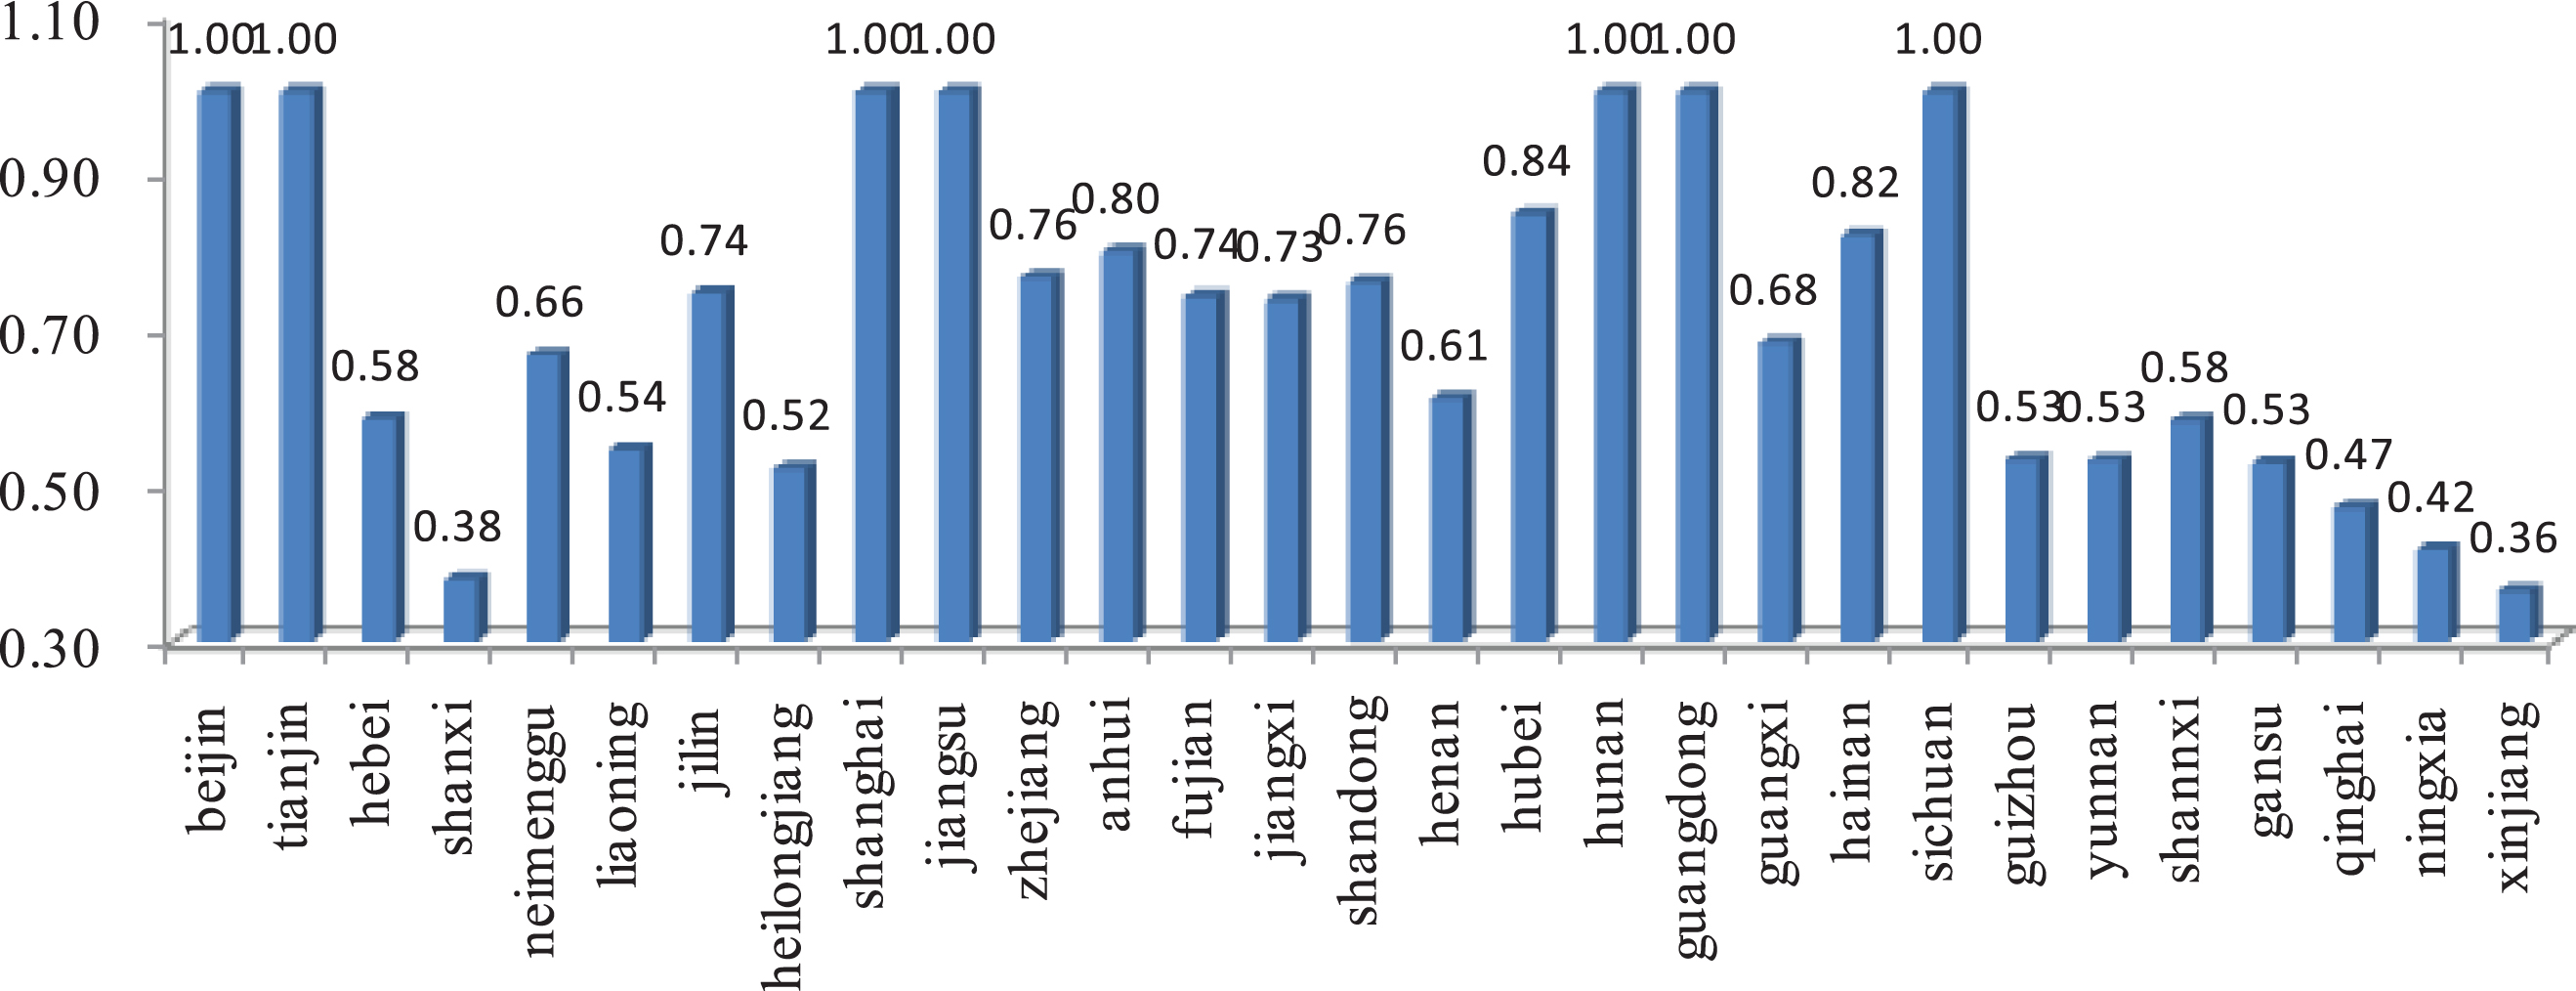
Air pollution management efficiency based on indicators integration and SBM model in 2016.
Based on the evaluation results of air pollution management efficiency by SBM model, it can be seen that the current air pollution management efficiency in China still needs to be improved. Therefore, the input-output efficiency evaluation of China’s provinces in 2016 is taken as an example to analyze the key factors to improve the governance efficiency of different regions in China. The results are showed in Table 5. It can be found that the key to improve the efficiency of air pollution management in various regions is to save investment in air pollution management. From the perspective of energy consumption, the western region needs to save the highest amount of energy consumption, while the central region and the northeast region have the lowest energy consumption. The amount of capital investment needed to be saved is less, and the eastern and northeastern regions are smaller in capital investment than the western and central regions. From the perspective of labor input, the western region needs to save the most labor, while the central region needs to save the least labor. Thus, it has large adjustment space of investment in air pollution management.
Input-output analysis of different regions in 2016
In order to further compare the influence of different models on DMUs’ ranking, Fig. 7 shows the efficiency evaluation of different provinces based on the proposed SBM model, original CCR model and DEA undesirable output model. From Fig. 7, the proposed SBM model can effectively rank different provinces. Oppositely, the original CCR model fails to distinguish most provinces by using the efficiency of air pollution management, and the efficiency evaluation of top 10 provinces also have the same order by DEA undesirable output model. The main reason is that these two models have different preprocessing for undesirable outputs and ignored the number of input-output indicators in efficiency evaluation, in which the proposed SBM model is based on indicator integration to evaluate the efficiency of 29 Chinese provinces, thus the corresponding ranking can effectively distinguish different provinces’ air pollution management.

Performance of different efficiency evaluation models.
Technological innovation is an important factor affecting the efficiency of air pollution management. Therefore, Fig. 8 showed the spatial correlation between air pollution management efficiency and technological innovation in China’s different provinces. It can be found that the efficiency of air pollution management in China has an obvious regional agglomeration, among them, the coastal provinces and municipalities in the central and eastern regions mainly reflect the ‘H-H’ agglomeration based on the data in 2010, while the western provinces and municipalities reflect the ‘L-L’ agglomeration. According to the data in 2013, there is no significant change in the efficiency of air pollution management and technological innovation compared to the data in 2010, but the data in 2016 has significantly different from the data in 2010 and 2013, where most provinces reflect the ‘H-H’ agglomeration, except Inner Mongolia, Xinjiang and some provinces in Northeast China are represented as ‘L-L’ agglomeration, it indicates that in spatial distribution, technological innovation and air pollution management in the central and eastern regions are better than those in the western and northeastern regions. Technological innovation gradually exerts its advantages and the influence of technological innovation on air pollution management is more significant over time, thus, more regions are manifested as ‘H-H’ agglomeration.
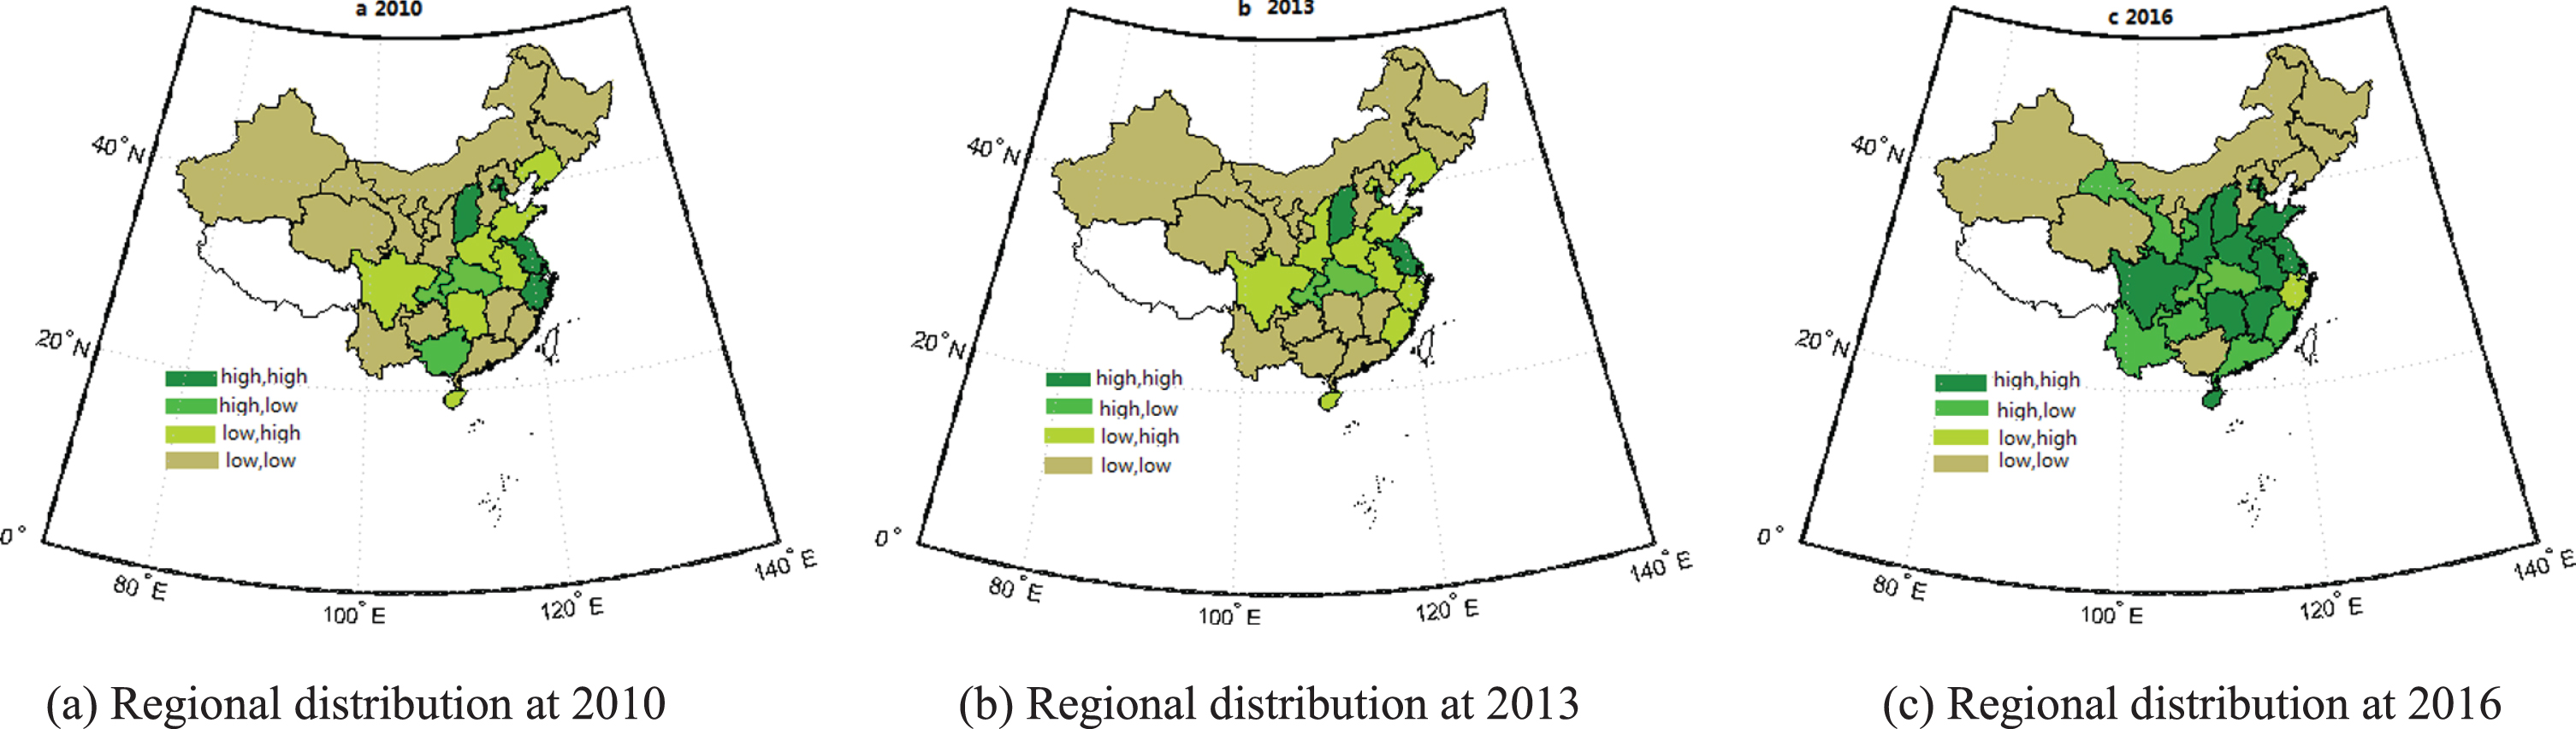
Regional distribution of technological innovation and air pollution management efficiency. (a) Regional distribution at 2010. (b) Regional distribution at 2013. (c) Regional distribution at 2016.
In order to further analyze the change of air pollution management efficiency and its influencing factors in China, the relationship between GDP, energy consumption and air pollution management in China is analyzed. As shown in Fig. 9. It can be found that there is a certain correlation between energy consumption and air pollution management efficiency. Energy consumption and air pollution management efficiency are mainly in the lower part between 2010 and 2013. Energy consumption decreases significantly from 2010 to 2016. At the same time, air pollution management efficiency is improved in 2016 compared with 2010 and 2013. From the analysis of the relationship between GDP and air pollution management efficiency, it is found that the change of GDP in the past few years is not obvious, but the efficiency of air pollution management has been improved, which shows that the efficiency of air pollution management has achieved positive results.
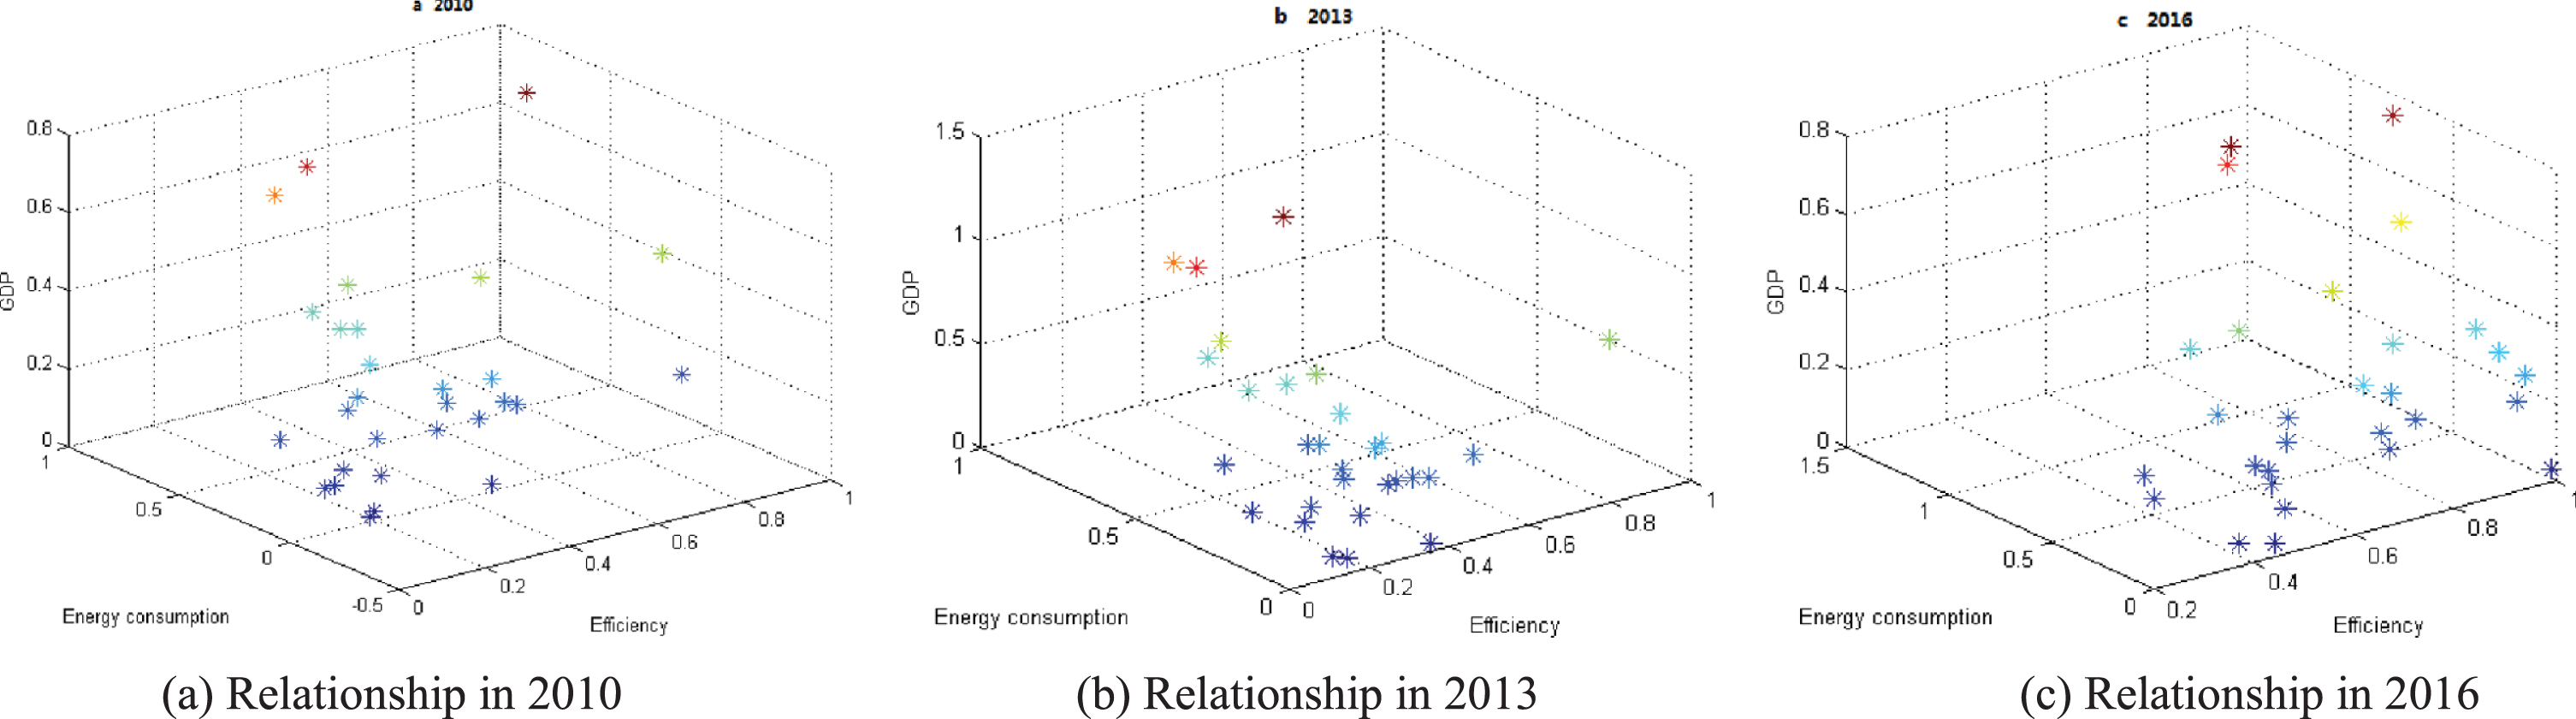
Relationship between GDP, energy consumption and air pollution management efficiency. (a) Relationship in 2010. (b) Relationship in 2013. (c) Relationship in 2016.
Fixed-effect model is a commonly used model in regression analysis, which can overcome the endogenous problem of variables to some extent. Therefore, according to the fixed-effect model, the influencing regional factors on air pollution management efficiency are analyzed in Table 6. Prob > chi2 = 0.0141 represents P < 0.05, the Hausman test rejected the null hypothesis and adopted the fixed effect model.
Regression results on air pollution measurement efficiency
Regression results on air pollution measurement efficiency
*Denotes p < 0.1, **denotes p < 0.05, and ***denotes p < 0.01; Prob > chi2 = 0.0141 represents P < 0.05, the Hausman test rejected the null hypothesis and adopted the fixed effect model.
Table 6 shows that the technological innovation has negative influences on the air pollution management efficiency, but it has no statistical significance. The reason may lies in the current air pollution management, technological innovation lags behind the air pollution emission, and the achievements of technological innovation are not fully used in air pollution management. However, there has a significant positive correlations between population density and air pollution management efficiency, with a significant level of 10%, this shows that the higher population density, the better air pollution management efficiency. The main reasons are as follows: (1) Densely populated areas pay more attention to air quality management to ensure the health of residents, so they pay more attention to air pollution management; (2) Densely populated areas are often economically developed areas, which can devote large investments in air pollution control to ensure the efficiency and effectiveness of air pollution management.
Taking the number of industries as an important factor affecting air pollution management, it is found that the number of industries has a significant positive correlation with air pollution management efficiency, and is significant at 1% of the statistical level. It is worth noting that the number of industries is the main financial source of all regions, and those industries are most the environmental protection enterprises that the government pays more attention to pollution control. Therefore, these industries can not only provide financial sources for the local air pollution management, but also be the input object of the local environmental protection technology, which is conducive to the improvement of local air pollution management efficiency.
In order to overcome the challenges in previous studies, a new air pollution management method, called integrated ER- SBM, was proposed to integrate air pollution indicators and analyze the influence of regional factors on the efficiency of air pollution management, in which the air pollution indicator integration is based on the ER approach with an entropy weighting method; the efficiency analysis is based on the SBM model with the consideration of undesirable outputs and the regression model. A case study of China 29 provinces was provided to illustrate the process of air pollution management using the proposed ER-SBM method. The specific conclusions of the case study can be further summarized as follows:
The integrated value of air pollution obtained by the ER approach with entropy weighting method had a significant regional different, in which the air pollution in the north provinces was higher than that in the south, and the air pollution in the northwest provinces was on the rise. The emission concentration of air pollution in different regions of China showed significant time variation. Air pollution reached its peak in 2014 and 2015 and the emission of air pollution decreased in 2016. However, the overall emission of air pollution fluctuated greatly because this is closely related to the difference of governance level in different regions.
Based on the efficiency measurement by the SBM model, the current efficiency of air pollution management in China still needed to be improved. It shows that the key to improve the efficiency of air pollution management in various regions was to save investments in air pollution management. At the same time, the technological innovation is an important factor affecting the efficiency of air pollution management, because the technological innovation and the efficiency of air pollution management showed a significant spatial agglomeration effect. Furthermore, with the passage of time, the effect of technological innovation in air pollution management was gradually remarkable from 2010 to 2016.
Regression analysis not only showed that population density and the number of industries above regional scale affected the efficiency of air pollution management, but also reflected that the degree of local economic development is closely related to air pollution emission. Hence, the more intensive industry and population is, the higher the efficiency of local air pollution management has.
Based on the above conclusions, some relevant policy suggestions for air pollution management are also needed for environmental sustainable development.
Firstly, air pollution management should devote to the resource control through innovative energy saving and emission reduction technology. To effectively improve air conditions, each province should expand the green area and strengthen dust control to optimize ecological environment systems. The cooperation of the mandatory emission reduction policy can be regarded as an important approach in air pollution management. For the relatively backward area of economic development, government should pay more attention to the regulation of pollution emissions when undertaking polluting industry, so as to achieve the coordinated development of economic development and air pollution protection.
Secondly, it is necessary to further improve the investment mode of air pollution management. Through combining administrative means with economic means, financial supervision should be carried out on the industrial enterprises which violate regulations. At the same time, governments must set up a clear plan for the investment of air pollution management and construct a real-time control system for air pollution investment to maximize the possible role of key investments in air pollution treatment.
Finally, all regions should speed up the implementation of a comprehensive compensation mechanism for air pollution control. Through the dual consideration of economic development and air pollution, the implementation of reward and punishment mechanisms can be used to ensure the synchronization of regional economic development and air pollution management, namely, the provinces having the improvement of air quality can be rewarded, but the provinces having the backward economic development with low efficiency of air pollution management should be punished, so as to encourage all provinces to pay attention to the improvement of local air pollution management.
The efficiency measurement model used in the present study is only one kind of classic DEA model, future researches can introduce other classic DEA models to measure the effectiveness of air pollution management. Furthermore, in the case studies, the regional air pollution management was regarded as a research object to carry on the model construction, which fails to involve different industries in the efficiency analysis of air pollution management. In future studies, the research can be extended to the analysis of pollution control in industries production process.
Footnotes
Acknowledgments
This research was supported by the National Natural Science Foundation of China (Nos. 61773123 and 72001043), the Humanities and Social Science Foundation of the Ministry of Education (Nos. 20YJC630188, 19YJC630022, and 20YJC630229), and the Social Science Foundation of Fujian Province, China (No. FJ2019C032).