
Abstract
In this article, we propose a method to recognize human emotions based on user context and brain signals. We evaluated the method through an experiment during which individuals performed tasks using a simulator for electrical power systems operator training. We collected user context through log data retrieval and brain signals using an Electroencephalography (EEG) portable monitor. The experimental results demonstrated that the method could be successfully applied to recognize the emotional states based on EEG signals and user context.
Introduction
The application of emotion recognition to a variety of fields such as elderly care, robotics, medicine, aviation, and automation systems, among others [–3], is increasing in the last years. Also, a variety of techniques to acquire emotion information, such as facial expressions [4], voice signals [5], body language [6], and physiological signals [7], have been reported. The central problem in emotion recognition is its susceptibility to ambiguous interpretation by analysts and dissimulation from the subject. Such a situation is mainly the case when using systems based on facial analysis, spoken language, or body language, compromising the accuracy of the data [8]. As an example, an actor can simulate several emotions regardless of the true emotional state. Besides, such systems are not universal, depending on culture, gender, and age of the individual [9].
In contrast, even if a person does not express his emotions through voice, facial expressions, or gestures, changes in physiological state are uncontrollable and thus detectable [10], because the sympathetic nerves of the autonomic nervous system are activated when an individual is positively or negatively excited. Another advantage is the impossibility to manipulate physiological signals in emotion recognition to simulate a false emotional state, which makes these systems more reliable [11].
Despite being immune to dissimulation, biological signals may present a low temporal resolution, which prevents their use in real-time systems. An exception to this case is the brain electrical signal acquired by electroencephalogram (EEG), which has an excellent temporal resolution (approximately 1 ms), allowing its use in real-time [12–16]. This work employs EEG signals for the recognition of human emotions.
However, EEG signals are not enough to detect human emotions in daily activities. Various internal and external stimuli influence human emotions, such as past and recent experiences, personality, affection, and interpretation of these influences on cognitive networks [17]. These factors are not considered in emotion recognition systems discussed in the literature, as they are designed only to detect emotions stimulated from images, sounds, music, or videos, and thus are one main disadvantage. In other words, existing approaches are not context-aware.
Context is as any information used to characterize the situation of an entity. An entity is a person, place, or object considered relevant to the interaction between an individual and the working tools, including the individual and the tools [18]. Examples of context information include user identity, location, time, date, temperature, the emotional state of the user, attention, orientation, objects, and people in the surrounding environment [19, 20].
In this article, we introduce a method to recognize emotions based on EEG signals and the user context. Our approach promotes user mobility and non-intrusiveness of data acquisition, preserving human behavior, comfort, and attention levels while executing critical operational tasks. We evaluated the method through an experiment with individuals performing critical tasks using a real simulator for electrical power systems operator training that reproduces the workplace of a substation. We acquired and analyzed EEG signals and context data from the participants to assess the relationship between their emotional state and the individual’s task outcome measured by the number of errors registered by the simulator during the execution of a task. Therefore, evaluating how an operator’s emotional and context state can lead to misleading actions resulting in errors that impact the operational state of the electrical systems, causing, for example, power shortages.
The main contributions of this article are twofold. In essence, we introduce a method to recognize human emotions through EEG signals and user context avoiding false simulations and misinterpretation with good accuracy and present an experiment to validate the method that show how to recognize emotions during daily activities and that may help people to avoid activities that they are not apt to execute in a certain period. During the experiment, it was possible to identify if a person could perform critical activities in the environment of an electric system substation based on her emotions.The remaining of the paper is organized as follows: In Section 2 we present the steps to apply the proposed method and in Section 3 we present the experiment. In Section 4 we present results and discussions. Finally in Section 5 we present conclusions and future works.
Method
This section details the three steps to execute the proposed method for emotion recognition based on EEG signals and user context and are as follows: EEG signals are acquired and processed in order to identify the emotional state of an individual; individual’s context information is collected and mapped to emotions, and; the individual’s emotion is obtained through the merger of the emotions mapped from EEG signal and user context.
Mapping EEG signals to emotions
The first step is mapping brain signals to emotions. This step includes brain signals acquisition, signals preprocessing, signal processing, and emotion recognition.
EEG signals are acquired and processed through a Brain-Computer Interface system (BCI). BCI systems allow direct access to the brain signals of a human being, without using peripheral nerves and muscles [21]. Rehabilitation, neuroscience, and cognitive psychology are the main application fields. Currently, these systems are also being successfully applied in emotion recognition since emotions originate in the brain [22, 23]. There are low-cost BCI systems for collecting EEG signals, such as NeuroSky 1 , Emotiv Epoc 2 , and Muse 3 among others [24–31]. In contrast with the traditional methods for the acquisition of brain signals, such as magnetoencephalography (MEG), functional Magnetic Resonance Imaging (fMRI) and Near-Infrared Spectroscopy (NIRS), EEG devices are easy to use, portable and with a high temporal resolution, enabling them to be applied in real daily activities [32]. The acquisition of EEG signals from the pre-frontal region of the brain occurs during the signals acquisition phase.
In the signal preprocessing phase, electric noise and the noise caused by the heartbeat signals are eliminated [33]. The signal processing is performed in two stages: selecting brain signals features and classifying these signals according to a set of characteristics relevant to the particular application. Results’ quality is a function of the choice of the EEG signal characteristics, as well as of the processing techniques [34]. Wavelet algorithms and Artificial Neural Networks, ANNs for short, are used in the selection and classification of EEG signal characteristics related to emotions. In Sections 3.3.4 and 3.3.5 we discuss the the motivation for using Wavelets and ANNs.
A wavelet is a finite wave with an average value of zero. When comparing sine waves, which are at the basis of Fourier analysis, to wavelets, sine waves are endless, unlike wavelets. Furthermore, the sinusoids are regular, while the wavelets are irregular and asymmetric. The main advantage of the wavelets over other classification methods is that it makes it possible to use observed data points not detectable using other analytical techniques, such as the trend of degradation and self-similarity points. These particularities of wavelets allow compression of a signal and removal of noise without a considerable degradation of the signal [35]. Wavelets extract EEG features, such as theta, delta, alpha, beta e gamma. These features can be used in the classification phase to detect emotions since they are related to theta and alpha characteristics.
ANNs are non-linear mapping structures based on the function of the human brain. They are universal and highly flexible function approximators for any data, and thus widely used as classifiers, especially when the underlying data relationships are unknown. We employ ANNs to map EEG features into human emotions, such as positive/calm, positive/excited, negative/calm, and negative/excited.
According to Aula and Surakka [36], negative emotions affect the individual’s efficiency to perform cognitive tasks. Besides, negative emotions leave the individual more susceptible to make mistakes [37]. On the other hand, positive emotions relate to reasoning flexibility and a higher level of creativity to solve a given problem [38]. We use these affirmations to analyze the case study presented.
Mapping user context to emotions
Context is critical when assessing an individual’s emotions, since everyday events; personality and even preferences can affect the emotional state. Furthermore, the context of an individual is essential to distinguish between his emotions, since different contexts can stimulate different emotions in the same individual [38]. Each context-related factor has a different level of influence on emotion recognition. For example, when carrying out an everyday task such as driving, the driver’s emotions are influenced by experience, fatigue, and attention, amongst other factors; but each of the factors, as mentioned earlier, has a different impact on the emotional state.
When modeling the context, the first step is to identify all the variables that are relevant to a given situation. In this article, the individual’s context is that of an operating room at an electrical system substation. To gather these factors, we employed the 5W1H information approach to answering the questions: Who, Where, When, Why, What, and How [39].
Regarding an individual’s characteristics (WHO), one gathers information such as name, gender, preferences, and personality, among others. In the specific case treated in this paper, additional characteristics such as level of knowledge and a basic level of attention are essential to the user context.
WHERE concerns information about the place where the situation occurs, such as country, state, or city, or precisely defined: neighborhood or a particular address. The level of user location specificity depends on its relevance to the description of the context. In this example, it is in the control room of an electric substation. From this information, the task outcome can be considered critical.
WHEN regards the date of an event and any time of occurrence information, such as morning, afternoon, or evening, the season of the year, or any other relevant information. We considered the time of day when the task is performed since there is a relationship with the error occurrence.
WHY must clarify why the event occurred. Knowledge of the event motivation is essential since this information has a significant influence on the emotional balance of those involved. Positive reasons induce positive reactions to the individuals’ brains, unlike negative reasons. The tone of the context, such as a family celebration, work activity, or sad occasions, determines the individual emotional valence as positive or negative.
We also consider the complexity of the task. In this case, the question to be answered is HOW, and its response must consider the individual level of control over the task. In this case, the level of fatigue can influence the task outcome.
The relevant information can be acquired automatically, using tools applied to social networking, GPS, calendar, and scheduling, among others. Alternatively, one can apply questionnaires, or perform direct observation of the context.
Having acquired all relevant information to the Context, one must select the variables that best describe it. The selection uses on a tentative model which represents all the factors that influence the Context, with respective weighted impact given by:
Each variable is associated with a state value, which is between 0 and 2. 0 is the lowest level assigned to a given factor, 1 is an intermediate level, and 2 the highest level. For instance, given the knowledge factor 0 corresponds to a low level of a given person dual knowledge on the task; 1 to a medium level and 2 to a high level of knowledge. Applying this scale, the Context represented by the equation results in one of the three levels of individual aptitude for performing a task, such that: 0 ≤ Context < 1, Negative Emotion; Context = 1, Neutral; 1 < Context ≤ 2, Positive Emotion.
Individual’s emotion
The last step of the method is mapping the results obtained from brain signals and context classification into emotions, as is presented in Table 1. For instance, considering line 1 in Table 1, we have that whenever both the Emotional State and the Context Result are apt, we map the Individual’s Aptitude to perform a task to apt.
Method output based on an individual emotional state and context
Method output based on an individual emotional state and context
To assess the effectiveness of the method when compared to other methods adopted in work psychology and product usability testing, we defined and executed an experiment. The experiment investigates the relationship between an individual’s emotional state based on EEG signals and user context with task outcome and performance. The nature of the task focus of this study is a critical task, that is, a task which outcome could result in material losses or endanger lives.
Protocol and subject participants
We used an experimental protocol to support the observation of human behavior [40] This experimental protocol consists of different steps that include receiving the participant and explain what and the conditions he/she will participate and filling out forms that state that the individual agrees to the conditions of the experiment as well as the with the recording of images and audio. Then, we ask the participant to fill out a registration form with personal contact data and stating personal characteristics to establish if the individual’s profile coincides with that specified for the group of participants. The participants are also informed about the possibility of interrupting their participation in the experiment at any time. Besides, the participants express their opinion on both the task performed as well as working tools. Finally, participants answer two questionnaires in order to determine their level of inherent attention and perceived exertion during the experiment. The experiment takes a total of 1 hour and 45 minutes, with 50 minutes are reserved for the planned task.
The Ethical Committee of the Federal University of Campina Grande approved the study protocol, according to the regulations imposed by the Brazilian National Committee on Research Ethics, and all participants gave written informed consent.
Experiment
The experiment consisted of observing and registering individuals’ behavior, emotions and performance during the execution of critical operations tasks. In order to gather the data we used a 3D, virtual reality Operator Training Simulator (OTS) to control an electric system substation [41, 42]. Indeed, the simulator used in the experiment is the same one used to train real system operators in a regional power electric company, a screenshot of the operating room simulator is shown in Fig. 1.

Screenshot of the 3D simulator used to perform the experiments.
Two types o operation is carried on electrical substations, namely as frequent and programmed. An operation is a sequence of actions listed on a script. The required results must be achieved within deadlines and strictly according to the prescribed sequence of actions. The task consists of acting upon control devices located in control panels or on the screen of a supervisory system. To provide more realism in the context, participants were subject to stressing events during task performance, which typically occurs during an operator’s regular working shift. These consisted of incoming telephone calls and triggering of system alarms. It is important to point out that the tasks were defined based on real operation data provided by the regional power electric company and are real operating situations scenarios.
The individuals performing the operator task could move around the virtual operating room, interacting with the 3D world representation of the work environment, using the mouse or keyboard. In the simulated environment, there are virtual representations of control panels and a virtual screen representing the screen of a real supervisory system, Fig. 1.
Took part in the experiment, individuals with varying levels of task and context knowledge, this later including the simulator itself. To evaluate the influence of fatigue on participants, they were deprived of a set number of hours of sleep (0, 4, and 8 hours), the night before the experiment. Participants were immersed in the simulated environment and had their interactions recorded in video, while data was acquired in parallel on their emotional state, according to the experimental protocol described in [40].
Personal data, such as gender, age, and psychological profile, was collected through a questionnaire before the experiment has begun. Data was also collected o experience with simulating tool.
To evaluate the individual’s inherent attention level, all participants performed the D2 test, employed to identify an individual’s attention and concentration levels [43]. The test consists in recognizing a specific set of three characters amidst 47 different characters. The activity takes place in a total of 14 replicates, with a set duration of thirty seconds each. We performed a qualitative analysis from the provided answers, which allows us to identify normal (or abnormal) levels of attention and alertness.
Experiment environment
We executed the experiment in a two-room laboratory-controlled environment. The experiment room, where the user performs the task, is equipped with the necessary tools (operator training simulator) to perform the task and with the monitoring equipment: cameras, microphones, and the EEG equipment. The control room, with the data acquisition and recording equipment, was used to perform the visual observation (by researchers), as shown in Fig. 2.
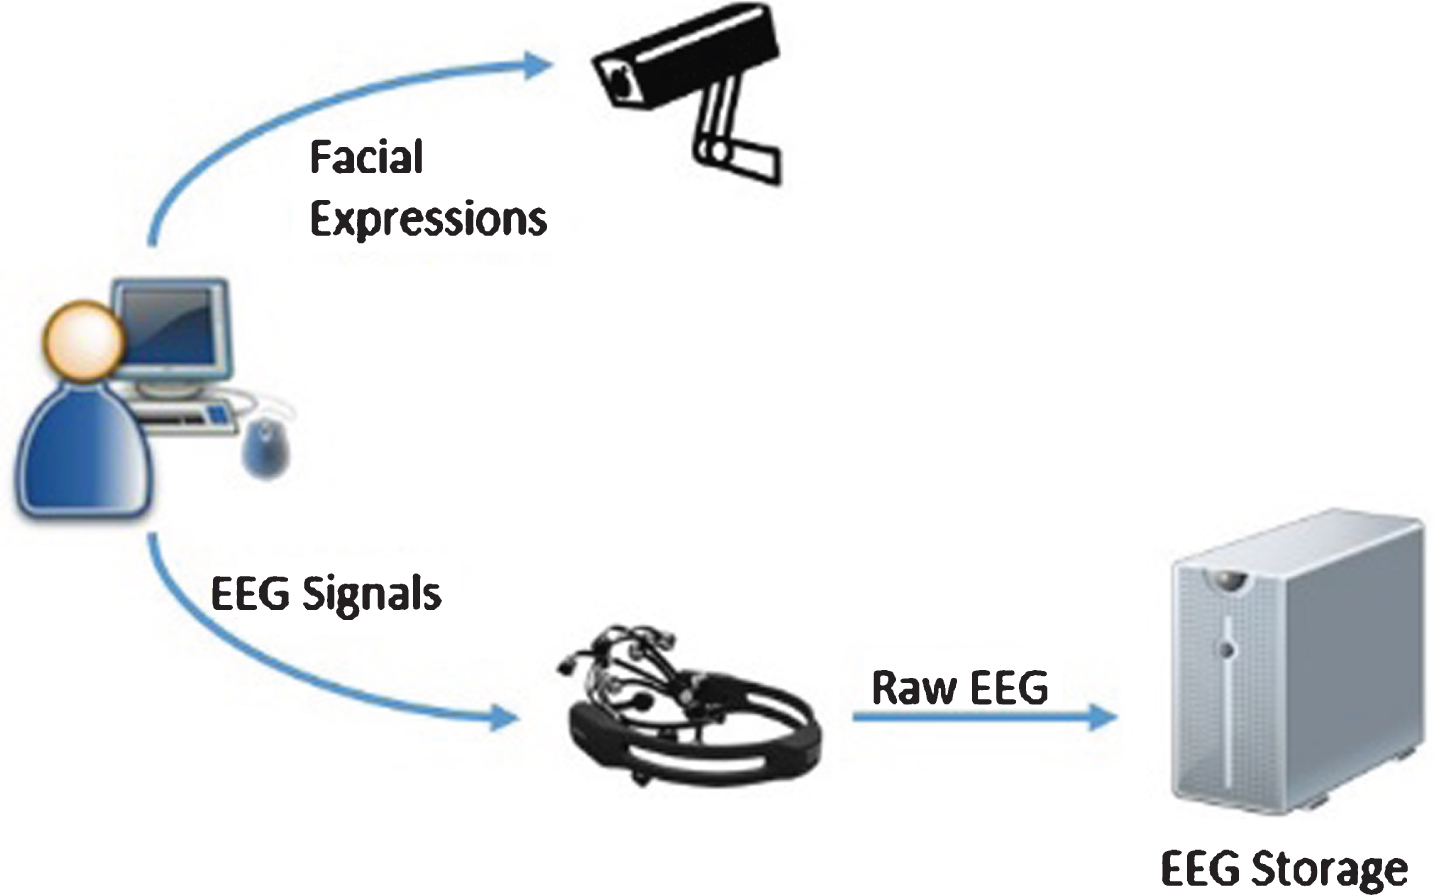
Experiment environment.
The simulator was available on a laptop computer. The brain signals were acquired, recorded, and processed in the second computer in a room, as shown in Fig. 3.

Experiment room.
Figure 4 illustrates the monitoring room setup. From there, the team observing the individual can follow the behavior and performance, visualizing images simultaneously from the simulator screen and the participant facial expressions registered by a video camera. From the control room, it is possible to intervene during the experiment in other to offer guidance to the participant.
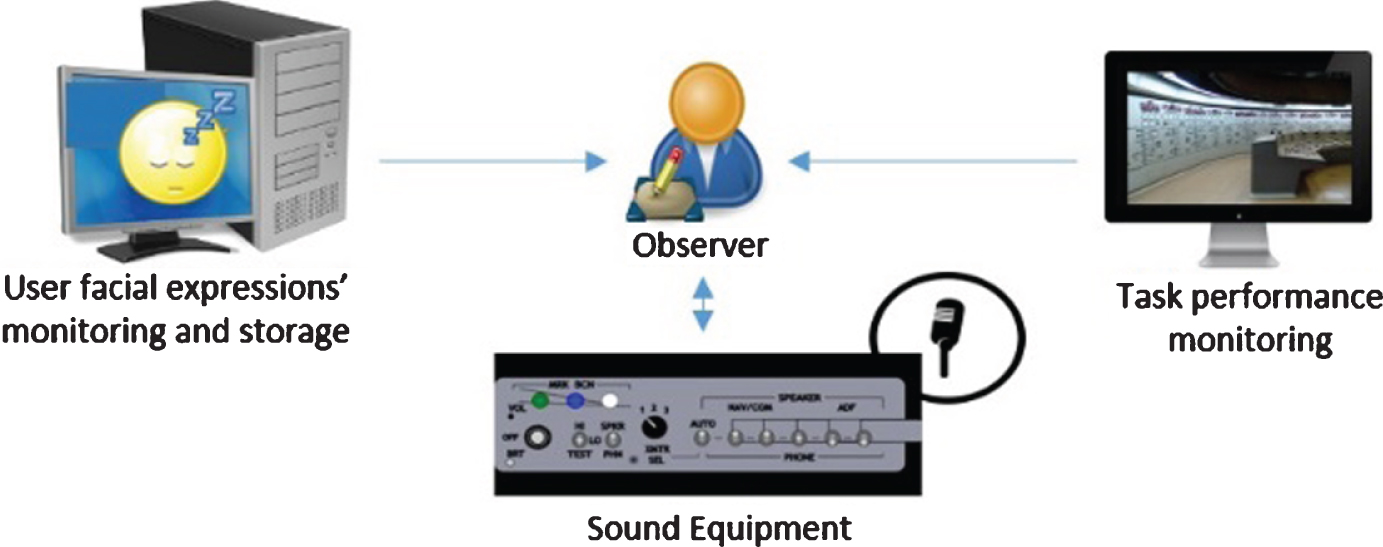
Observation environment.
In this work, assessing emotions is based on an individual’s brain signals and his context. Brain signals can be obtained and processed by a brain-computer interface system.
Brain Signals Acquisition
The EEG signal was acquired using a consumer-grade EEG headset, named Emotiv Epoch, in order to identify the emotions of the subject participating in the experiment. The Emotiv Epoch headset is a non-intrusive device with fourteen channels to acquire EEG signals, and two reference channels, namely CMSDRL - Common Mode Sense/Driven Right Leg in terminals P3/P4. The position of the electrodes is according to the international system [44], AF3, F7, F3, FC5, T7, P7, O1, O2, P8, T8, FC6, F4, F8, AF4 as shown in Fig. 5.
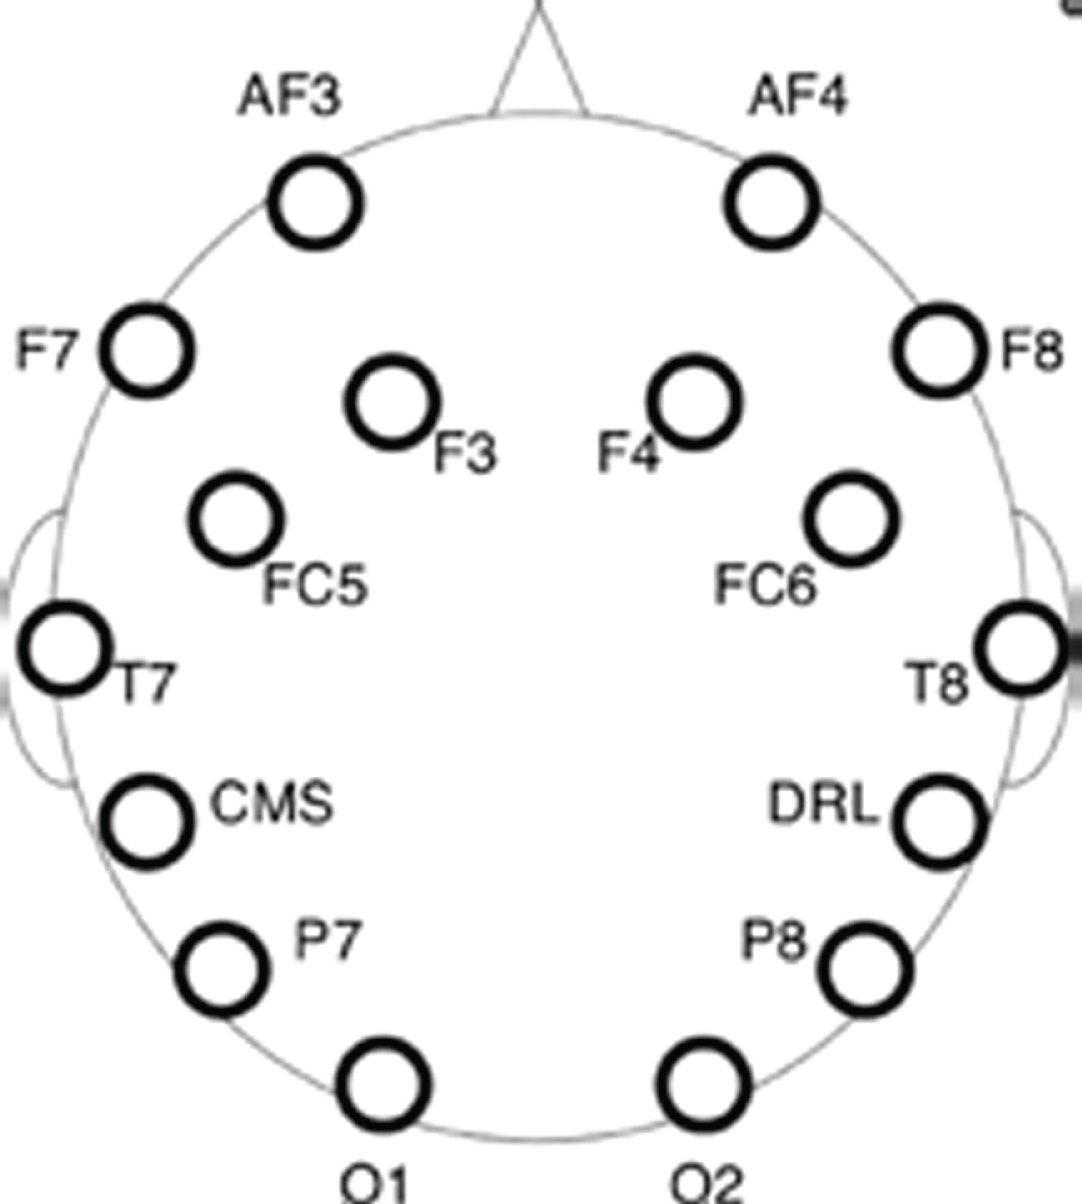
Electrodes positioning for the Emotiv Epoch headset according to the international system 10–20.
Although the portable EEG equipment used in this experiment does not share the precision of an EEG equipment used for medical applications, according to the findings reported in [45] except for rehabilitation and control of prostheses, these can be suitable for many applications, such as the one here proposed.
During the experiment, the Emotiv EPOC EEG equipment was attached to the surface of the participant scalp and connected to the computer, running the Emotiv Control Panel software. This software was employed for: checking the signal quality of each of the Emotiv electrodes and acquiring the EEG signals.
Following the acquisition phase, two software applications were used: one for reading and recording the EEG signals and another to acquire the signals processed by the EEG equipment employed to analyze emotions and facial movements.
The EEG signals were acquired at a sampling rate of 128Hz and stored in a text file. According to Afifi and Begman [46], the brain areas related to the emotional processes are on large encephalon areas and that among these areas, the hypothalamus, the prefrontal cortex, and the limbic system are of higher importance. Also, the prefrontal region is the only one activated while sensing any emotion, either negative or positive [47].
The prefrontal region is well connected identified that to the brain-stem and limbic formations, including the amygdala, as well as the hypothalamus, which plays a vital role in emotional behavior [48] This region performs functions related to the choice among different options and behavioral strategies that are most appropriate to the physical and social situation of the individual, maintaining attention, and, more important, in the scope of this paper, the control of emotional behavior [49]. Therefore, we used the signal from channel AF4 to identify the emotional state of the individual.
The high-level language for numerical computation, visualization, and application development tool: Matlab [50] was then used in the EEG signal pre-processing steps, as described below.
The first step consisted in filtering the signals by the EEG equipment, which has a bandpass filter, with the minimum frequency cut off of 0.2 Hz and a maximum frequency of 45 Hz, in addition to one notch filter with a frequency of 50 Hz and another of 60 Hz to eliminate the noise generated by the electric power grid. EOG and EMG artifacts, concentrated at frequencies below 4 Hz and above 30 Hz, respectively, were removed by a linear bandpass filter, with the minimum frequency cut off of 4 Hz and a maximum frequency of 30 Hz. Also, signals were split into separate 60 s samples to identify an emotional state for each sample.
Signal processing
As discussed in Section 2.1 We divided the signal processing of EEG in two steps: the selection of the signal characteristics and the classification of these characteristics. The choice of the method to be used in the first step depends on the signal characteristics if they are in the time or frequency domain. In the second step, the choice of method is independent of the signal domain.
Signals features selection
Wavelets [51] are mathematical functions as small waves that have limited duration and zero as the average value widely used to select the characteristics of EEG signals by emotion recognition systems. Wavelet analysis consists in decomposing a signal into shifted versions in different scales from that of the original wavelet. The wavelet analysis is either continuous or discrete.
After investigating different possibilities, we choose Daubechies 4 (db4) wavelet [52] because it is the one that presents the smoothing feature and near-optimal time-frequency localization properties that make it the most appropriate choice to process EEG signals [53, 54]. In [51], the authors describe several experiments with several families of wavelets. In those experiments, the authors found that the wavelet db4 best represents the EEG signals.
We implemented a Matlab function to read the EEG signals acquired and to select the features delta (1–4 Hz), theta (4–7 Hz), alpha (8–12 Hz), and beta (12–30 Hz), based on the EEG signals sampled at a rate of 128 Hz; therefore, for selecting the characteristics of the signal, we used a db4 wavelet of order 4. Also, we calculated the wavelet coefficients using two Matlab functions: detcoef (returns coefficients details of a wavelet) and appcoef (returns the approximation coefficients of a wavelet). Then, we calculated the details and approximations of the wavelet using the upcoef Matlab function, giving results such as the sample shown in Fig. 6.

Wavelet transform signal extraction sample.
Theta and alpha signals relate to human emotions, and thus we choose them to classify emotions. Values of entropy and energy components of the alpha and theta were calculated in order to evaluate which parameter can provide better results when classified into emotions. Entropy is a measure of the useful information from the EEG signal related to human emotions and the energy corresponds to the amplitude of the EEG signal. In this work, the arrays had theta and alpha features to estimate the entropy and energy.
The second stage in EEG signal processing consists in classifying the signals of interest for a given application, using translation algorithms. Examples of translation algorithms include linear discriminant analysis, k-nearest neighbor, support vector machine, and ANNs [55], among others.
ANNs, have been successfully applied in different medical applications as well as to solve problems that cannot be solved based only on signal processing techniques [56]. This technique, together with linear classifiers, are those that are most useful in the context of [57]. Besides, ANNs can be effectively employed to classify EEG signals with high precision, mainly when using a small number of electrodes to acquire the EEG signal [58]. ANNs are very well suited to classify EEG data due to the inherent capacity to deal with noisy data [59–64]. These characteristics drove us to adopt ANNs to classify emotions based on EEG signals.
ANNs are computational learning models inspired by the biology of the human brain. These models consist of neurons interconnected by synapses. From a functional point of view, ANNs copy the ability of the brain to learn and ideally can be trained to recognize any information, given a set of input data, by adjusting the synaptic weights. A properly trained network, in principle, should be empowered to apply its knowledge and to respond adequately to completely new entries. The most common application of ANNs is based on supervised classification, thus requiring a set of training and test data. Since the training data perform learning, the mathematical formalization uses these data.
ANNs performed the classification of the characteristic of the brain signals into emotions. An ANN consists of an input layer, a hidden layer, and output layer. The input layer is composed of neurons that receive input stimuli. The output layer is composed of neurons which output corresponds to the network output. The hidden layer or intermediate layer is composed of neurons that perform the data processing network. This layer may be composed of only one layer or several layers of neurons, depending on the complexity of the network.
There are several parameters to be defined, such as the number of hidden layers, the number of neurons in each layer of the network, and the training method. The ANNs employed to classify the characteristics of alpha and theta EEG signals on emotions has the following parameters: An input layer with one input signal. The ANNs were trained and evaluated with the energy and entropy from the characteristics theta and alpha, as input data, using all data types, one at a time; Three hidden layers with 40 neurons in each one; The ANN output is one of the EEG signals classified into emotions: positive/excited, positive/calm, negative/excited, and negative/calm.
As mentioned before, the technique used for training the network was resilient propagation.
Results and Discussion
To identify the emotions of an individual performing daily activities, this paper proposes a method based on brain signals and user context. We present a case study to evaluate a method and demonstrate the impact of emotions in a critical activity, relating the number of human errors and the individual’s emotional state. We described an experiment where sixteen individuals took part and data collected with the D2 test; profile questionnaire, observations, facial expressions; and brain signals. The collected data was grouped in two categories for processing purposes: context of information and EEG signals.
Results obtained from the Brain Signals Analysis
We obtained the recognition of the emotional status based on brain signals of an individual using the AF4 channel near the prefrontal area of the brain, which is intrinsically related to human emotions.
The EEG signals of the sixteen participants were processed and the theta and alpha components of these signals were selected. Furthermore, we calculated the values for energy and entropy of the two components. The energy and entropy values were then applied to the input of the ANN to translate brain signals into four emotional states according to the two-dimensional approach [65]. The ANN used in this work consists of only one neuron in the input layer, and thus receives as data type information on one vector at a time.
We performed tests with four ANNs. First, we applied the vector corresponding to the energy values obtained from the theta component as input. Then the vector consisting of the values of entropy for the theta component was used as the network input parameter. Third, we applied as input the vector with the energy values for the alpha component was applied to the input of the ANN. Finally, we tested as input the vector with the entropy values obtained from the alpha component. We trained validated and tested the ANN, with each of the mentioned vectors. Then mean and standard deviation were calculated on the basis of the results obtained for each of the classified emotions as shown Tables 2–5.
Mean and standard deviation for the recognition of the positive/excited state
Mean and standard deviation for the recognition of the positive/excited state
Mean and standard deviation for the recognition of the positive/calm state
Mean and standard deviation for the recognition of the negative/excited state
Mean and standard deviation for the recognition of the negative/calm state
The results were indicative that the entropy is the most appropriate statistical measure to identify the emotional state, regardless of alpha or theta characteristic being selected. To confirm the obtained results, the parameters true positives, false positives, false negatives, true negatives and accuracy were calculated for entropy based on theta and alpha characteristics. For alpha we obtained: 22.26% of True Positives; 2.74% of False Positives; 2.74% of False Negatives; 72.26% of True Negatives; and 94.50% of Accuracy. For thetha we obtained: 21.85% of True Positives; 3.16% of False Positives; 3.12% of False Negatives; 71.87% of True Negatives; and 93.70% of Accuracy. Therefore, the results obtained show good accuracy, with 94.50% and 93.70% of correct classification based on theta and alpha characteristics, respectively.
We performed analysis of the task outcome focusing on the human error and the individual’s emotional state at the time of its occurrence after performing the data classification. From this analysis, we found that approximately 80% of the error events happened while the participants were in a negative emotional state, regardless of being excited or calm, corroborating with the results suggested in [37] These results are presented in Figs. 7 and 8.

Results from entropy based on theta characteristic classification into emotions.
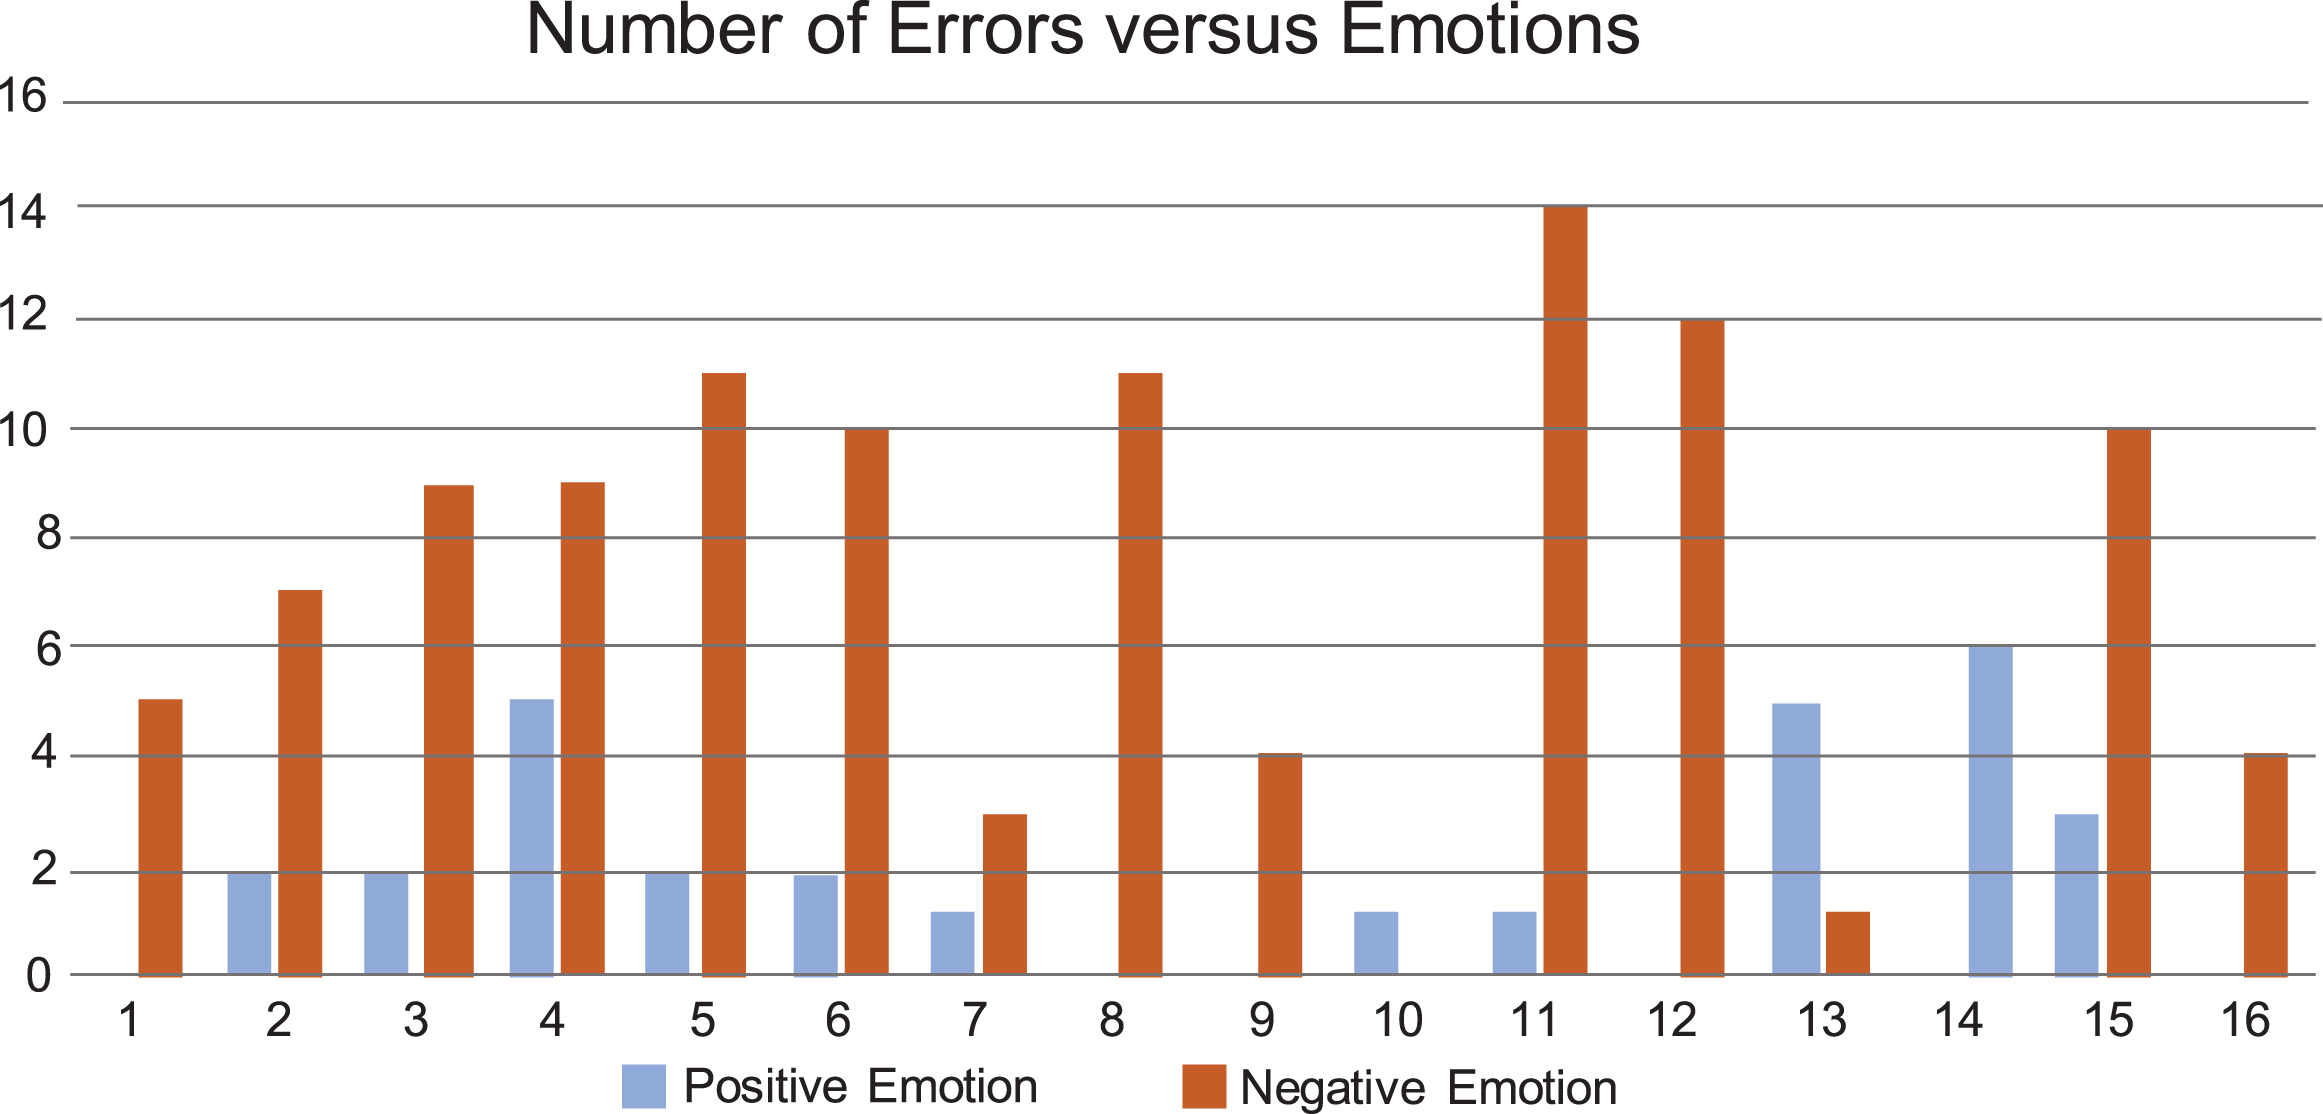
Results from entropy based on alpha characteristic classification into emotions.
Data on the Context was acquired from three sources: a questionnaire on the user profile, the application of the D2 attention test, and from the log file generated by the simulator used for the task. We used this data to analyze the influence of the Context on the task outcome indicating the individuals’ task performance, as shown in Table 6. The experiment has been applied to 16 individuals. In order to compute the number of subjects
Influence of the context on participant task performance
For the study presented in this paper, we obtained the confidence level given by Z∝/2 from the table of probabilities of the standard normal distribution, which is 1.96 for a 95% confidence level [66]. Since in our case p is unknown beforehand we assume that p=0.5 [66]. Finally, we considered an error margin given by E is 25%; thus the number of subjects considering the previous restrictions is n =16.
The variable Sleep Deprivation represents the number of hours slept by the participant before taking part in the experiment. The variable Expertise Level represents the participants’ knowledge of the simulator used to perform the task. The variable Attention Level represents the inherent individual’s attention level as measured by D2, while the variable Period of Day is when we executed the test. It has a high impact on the state of fatigue of the individual.
We statistically analyzed the Context data to assess the correlation between variables, despite being collected from a small sample [66]. The methods employed were: correlation matrix, ρ-values matrix, normality test, and linear regression. During the analysis, it adopted a 10% significance level due to the sample size.
We calculated the Pearson correlation coefficients of the variables presented to obtain the correlation matrix, as shown in Table 8. The Pearson correlation coefficient (ρ) measures the degree of correlation between two variables and has values ranging between –1 and +1. The signal indicates whether the correlation is positive or negative, that is if the variables are related directly or inversely. for ρ > 0.7, positive or negative, there is a strong correlation; for 0.3 <ρ < 0.7, positive or negative, has a moderate correlation; for ρ < 0.3, positive or negative, there is no correlation.
The correlation matrices and ρ-values obtained are shown in Tables 7 and 8. Based on the analysis, we conclude that the negative correlation between the number of errors and the level of expertise on the simulator (approximately -0.86) is significant. It is evidenced by the ρ-value of 0.00002, with a significance level of less than 10%. Besides, there is a moderate correlation between the number of errors and the level of attention (approximately –0.45), considering the ρ-value of 0.0792, with a significance level of less than 10%.
Pearson Correlation Matrix
ρ–values matrix
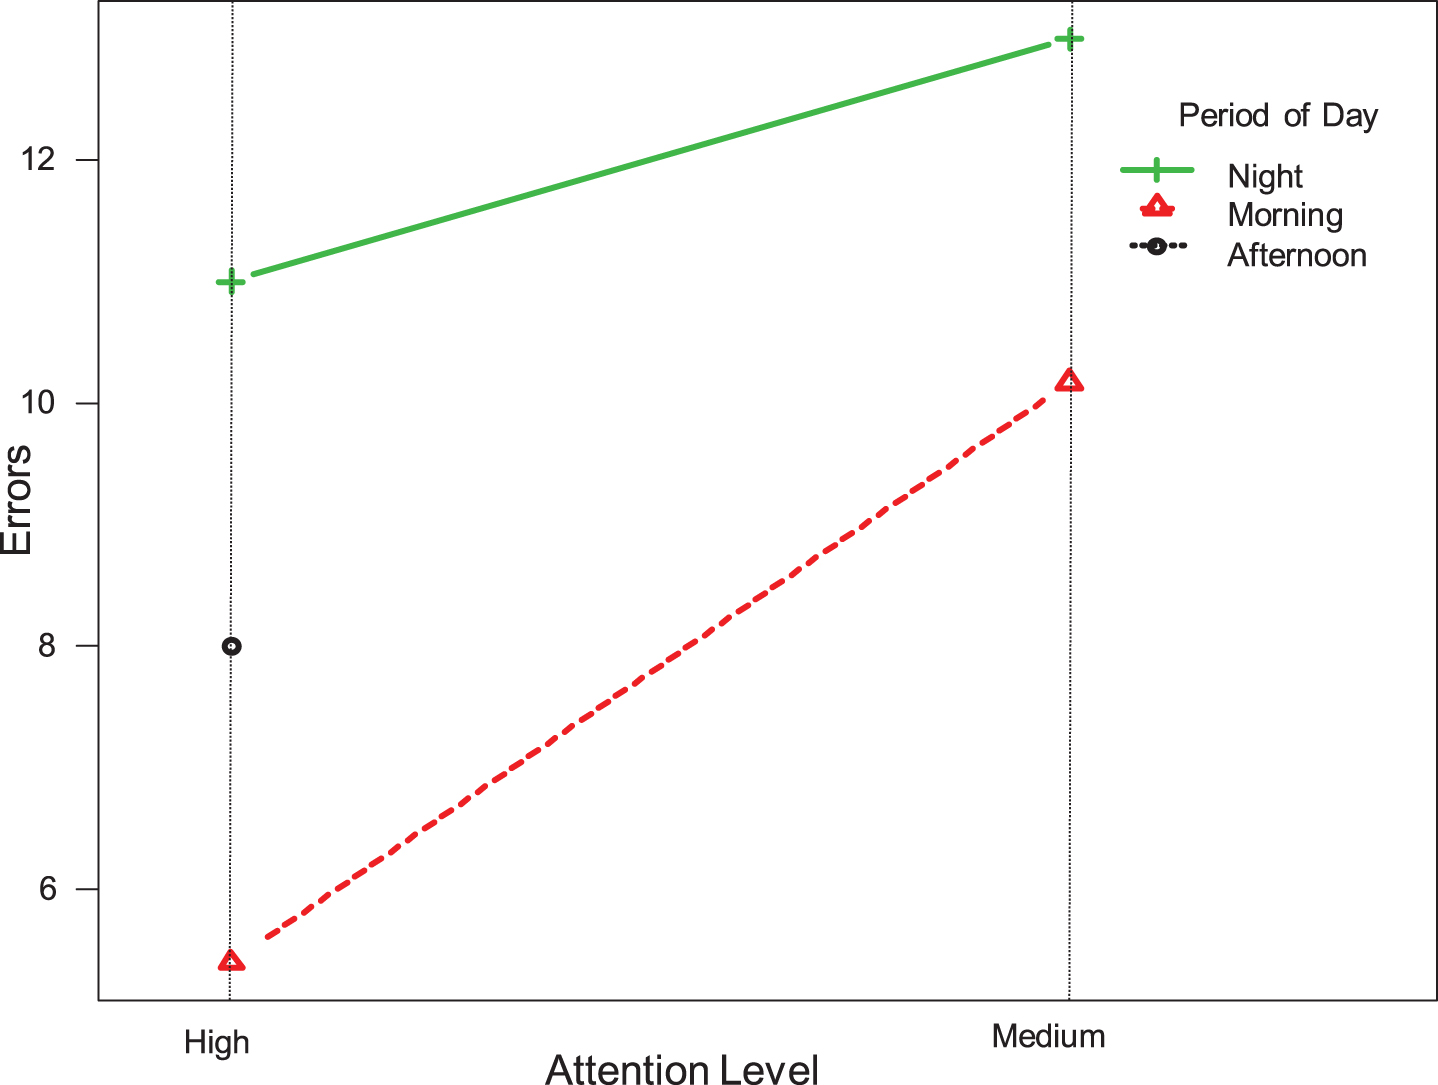
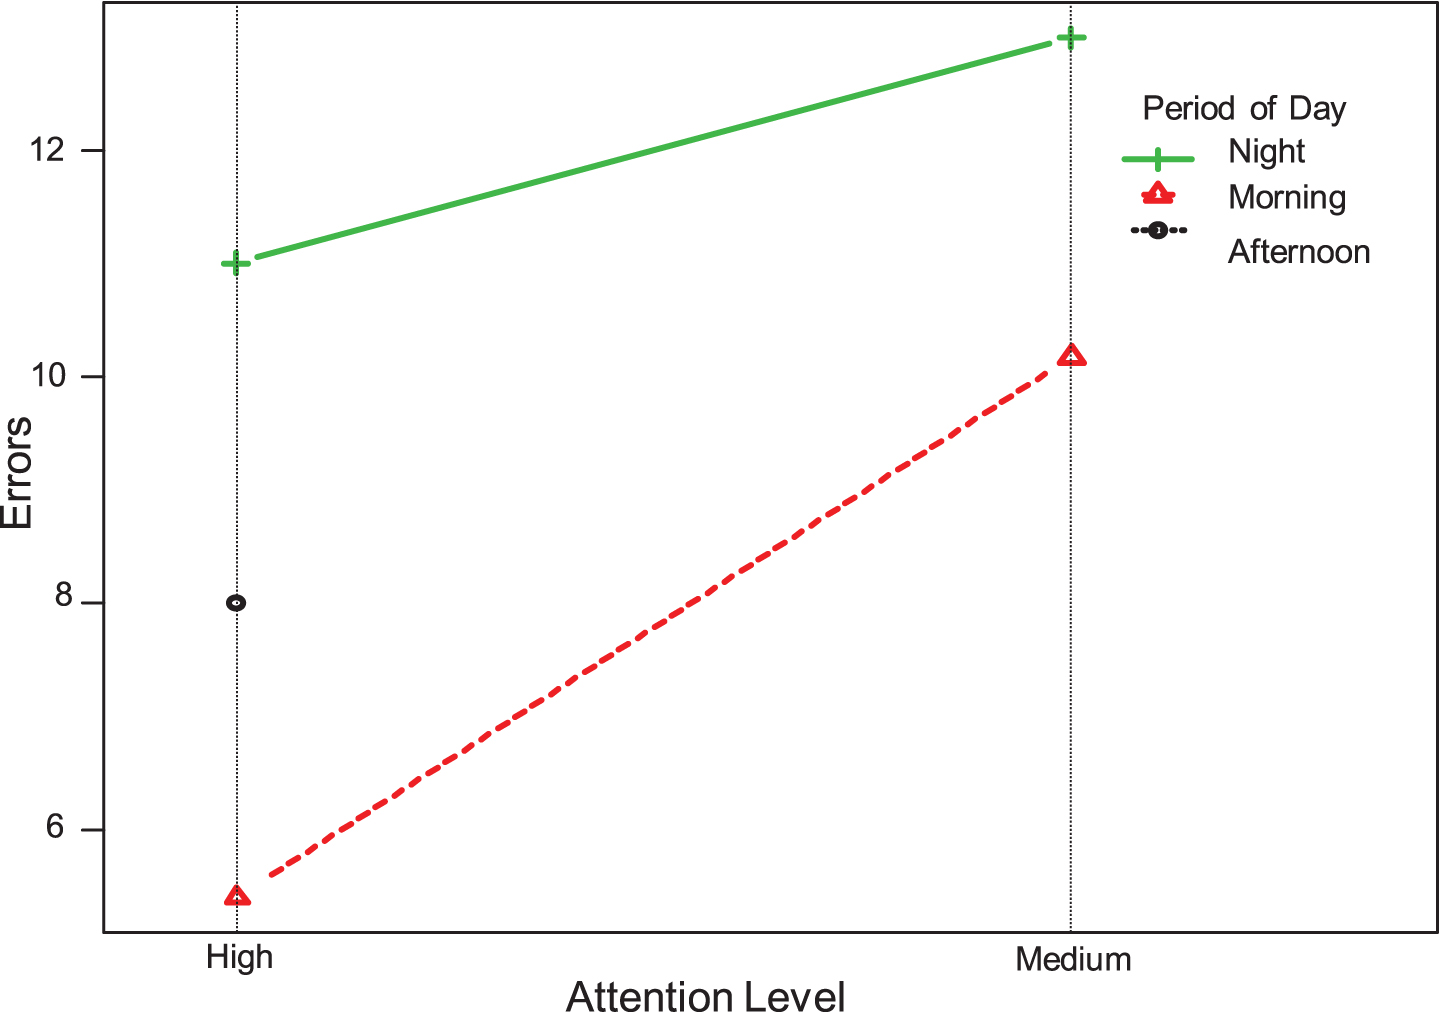
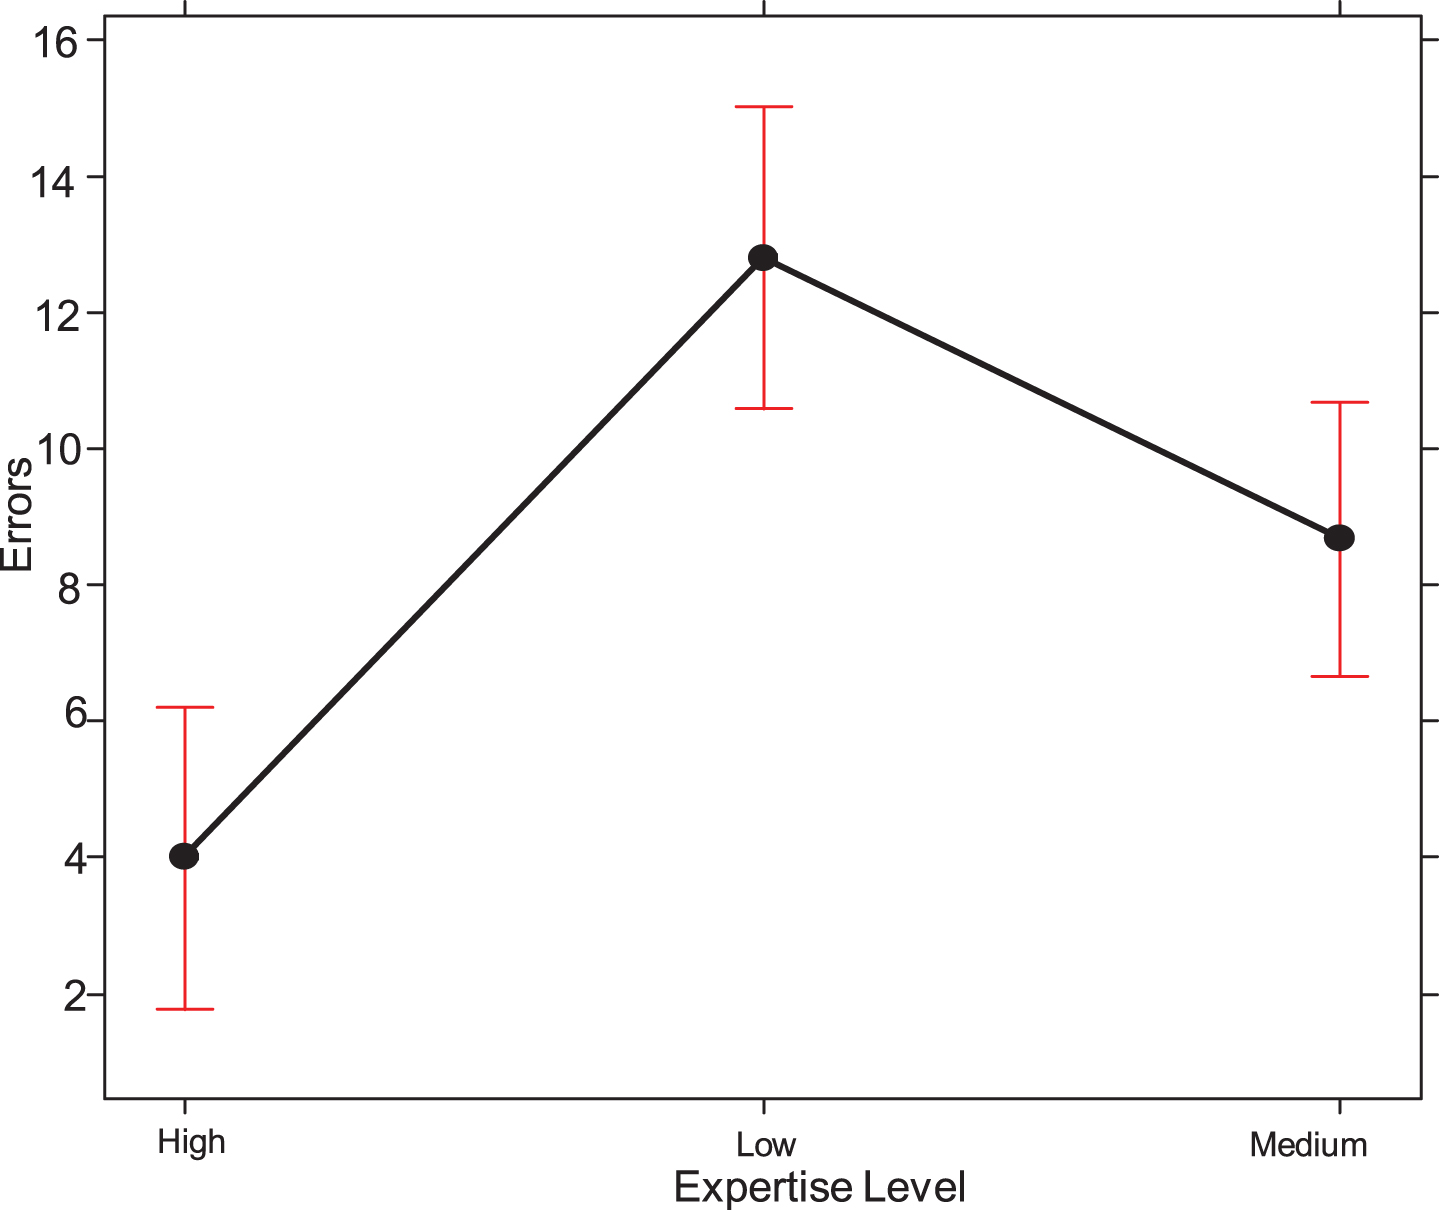
We analyzed the participant’s performance to evaluate the impact of each factor (variables) considered when determining the Context, the interaction between each pair of factors. The corresponding error graphs are shown in Figs. 9–14.

Expertise Level/Sleep Deprivation/Errors.
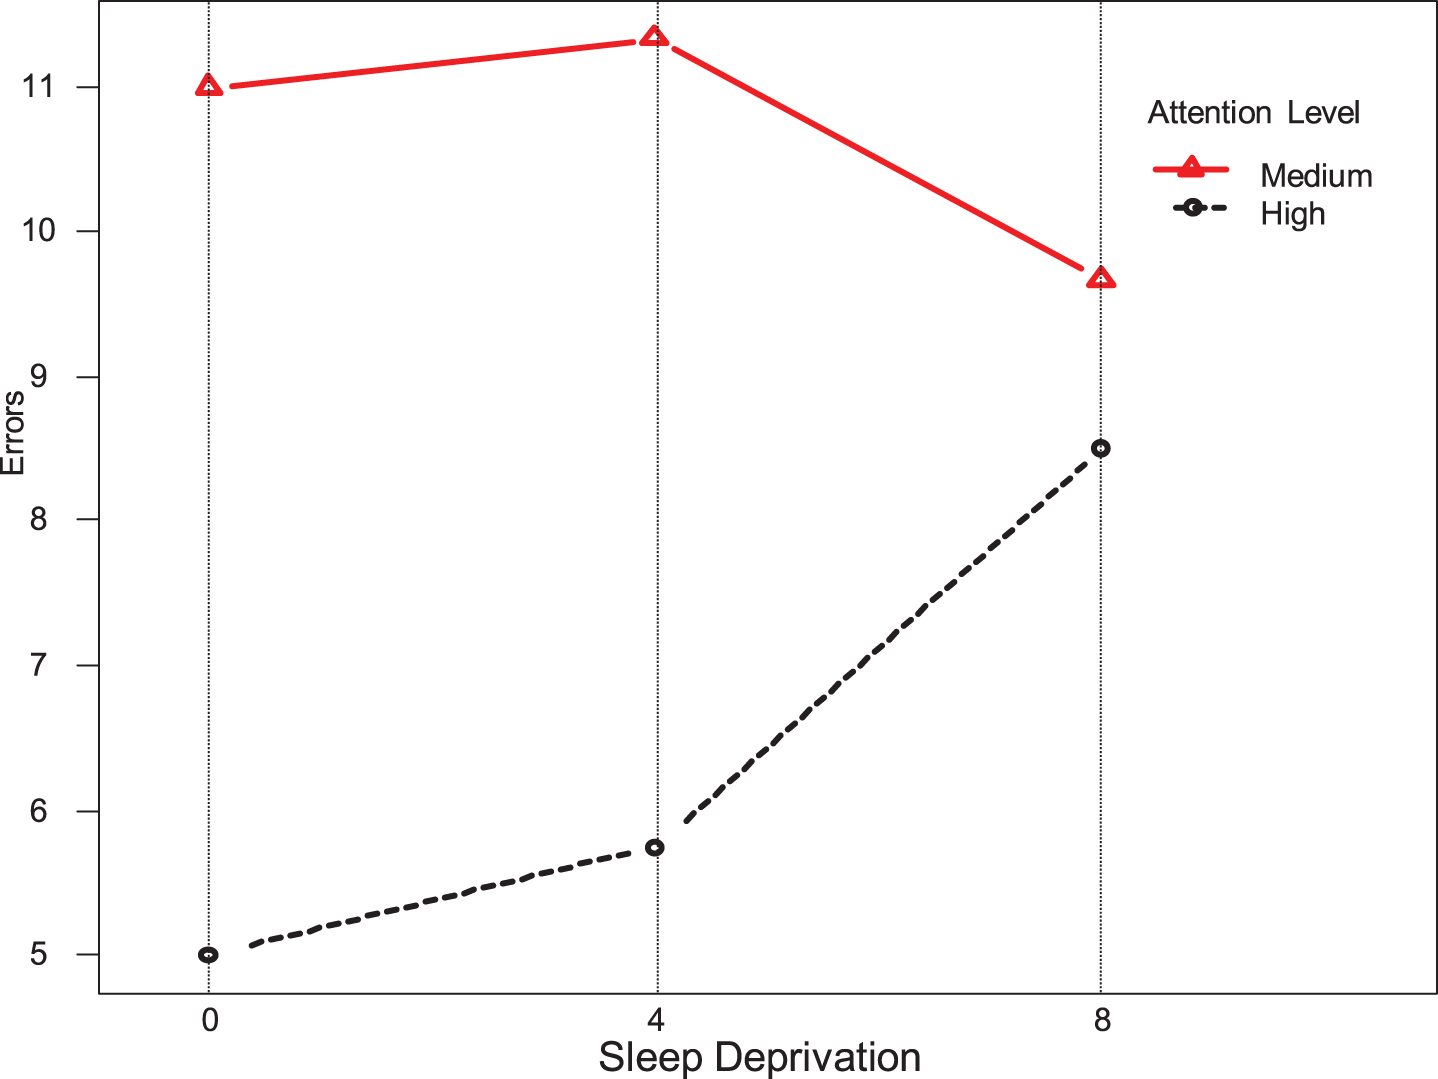
Attention Level/Sleep Deprivation/Errors.

Period of Day/Sleep Deprivation/Errors.
Expertise Level/Attention Level/Errors.

Period of Day/Expertise Level/Error.
Attention Level.
Another tool used in this study was the effect graph to show the relationship between the variable Errors and other variables, as shown in graphs presented in Figs. 15–18. We can observe that the Expertise Level and the Expertise Level have the highest impact on the participant’s performance. The higher the participant’s level of Expertise_Level on the simulator, the fewer the number of errors during the task performance.
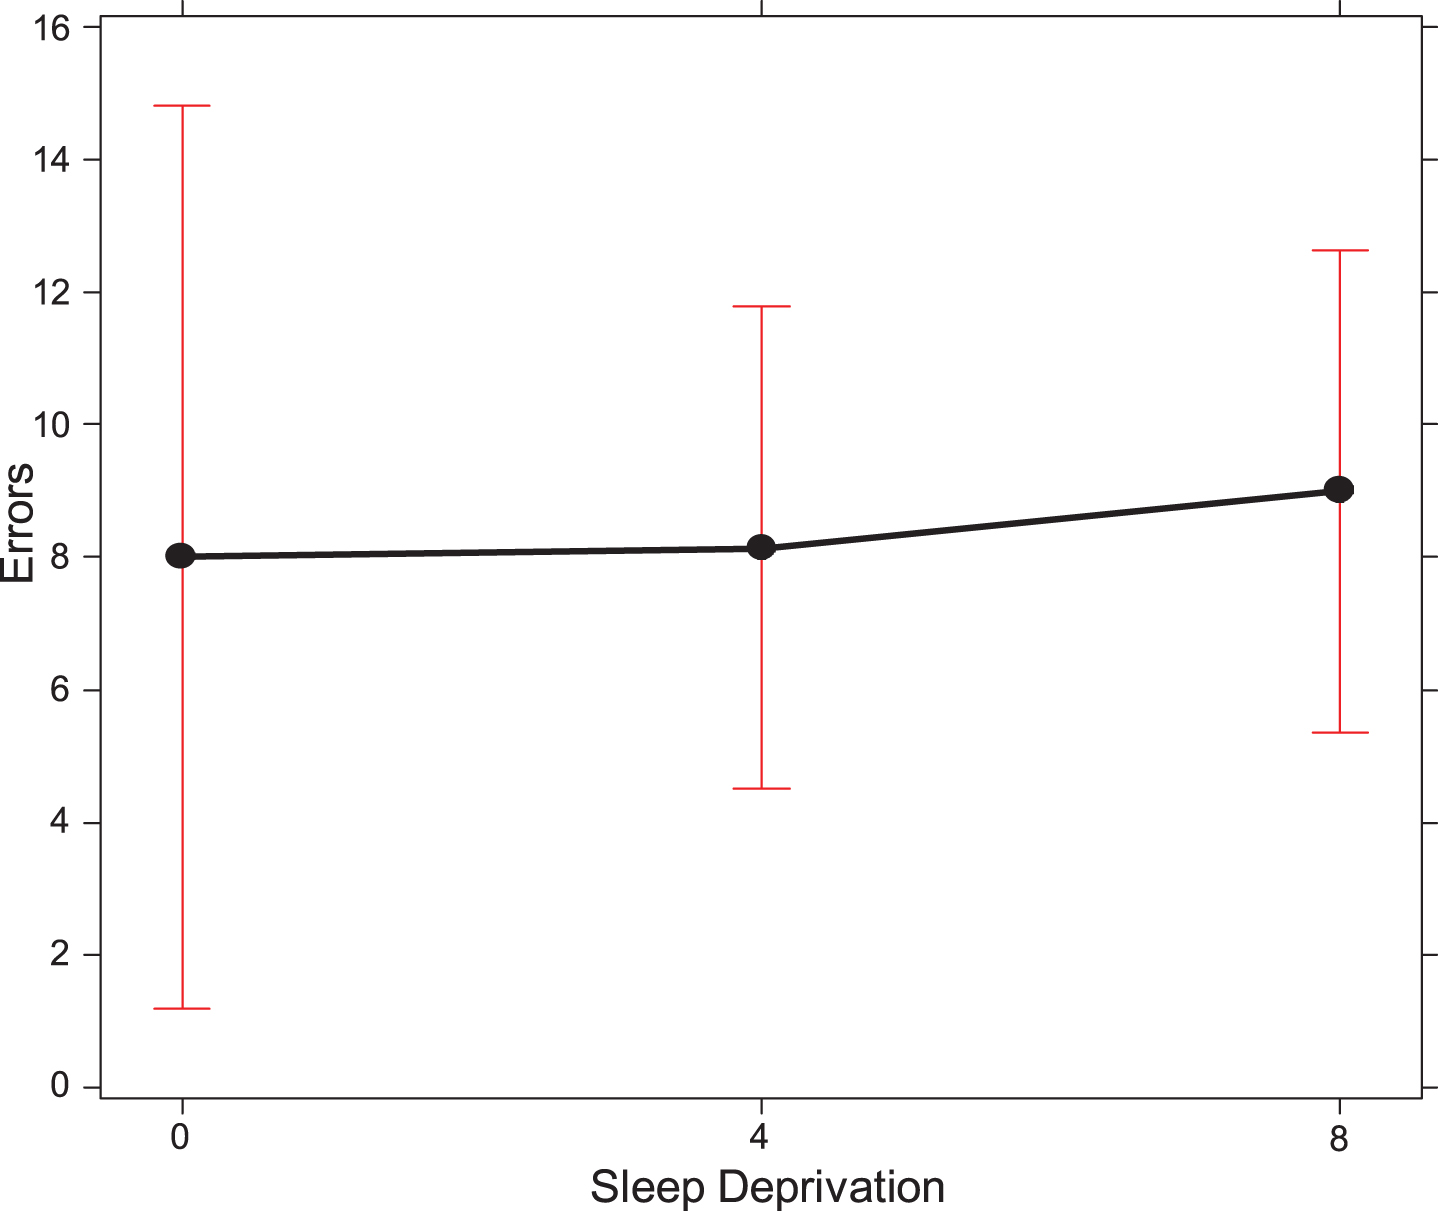
Sleep Deprivation × Errors.
Expertise Level × Errors.
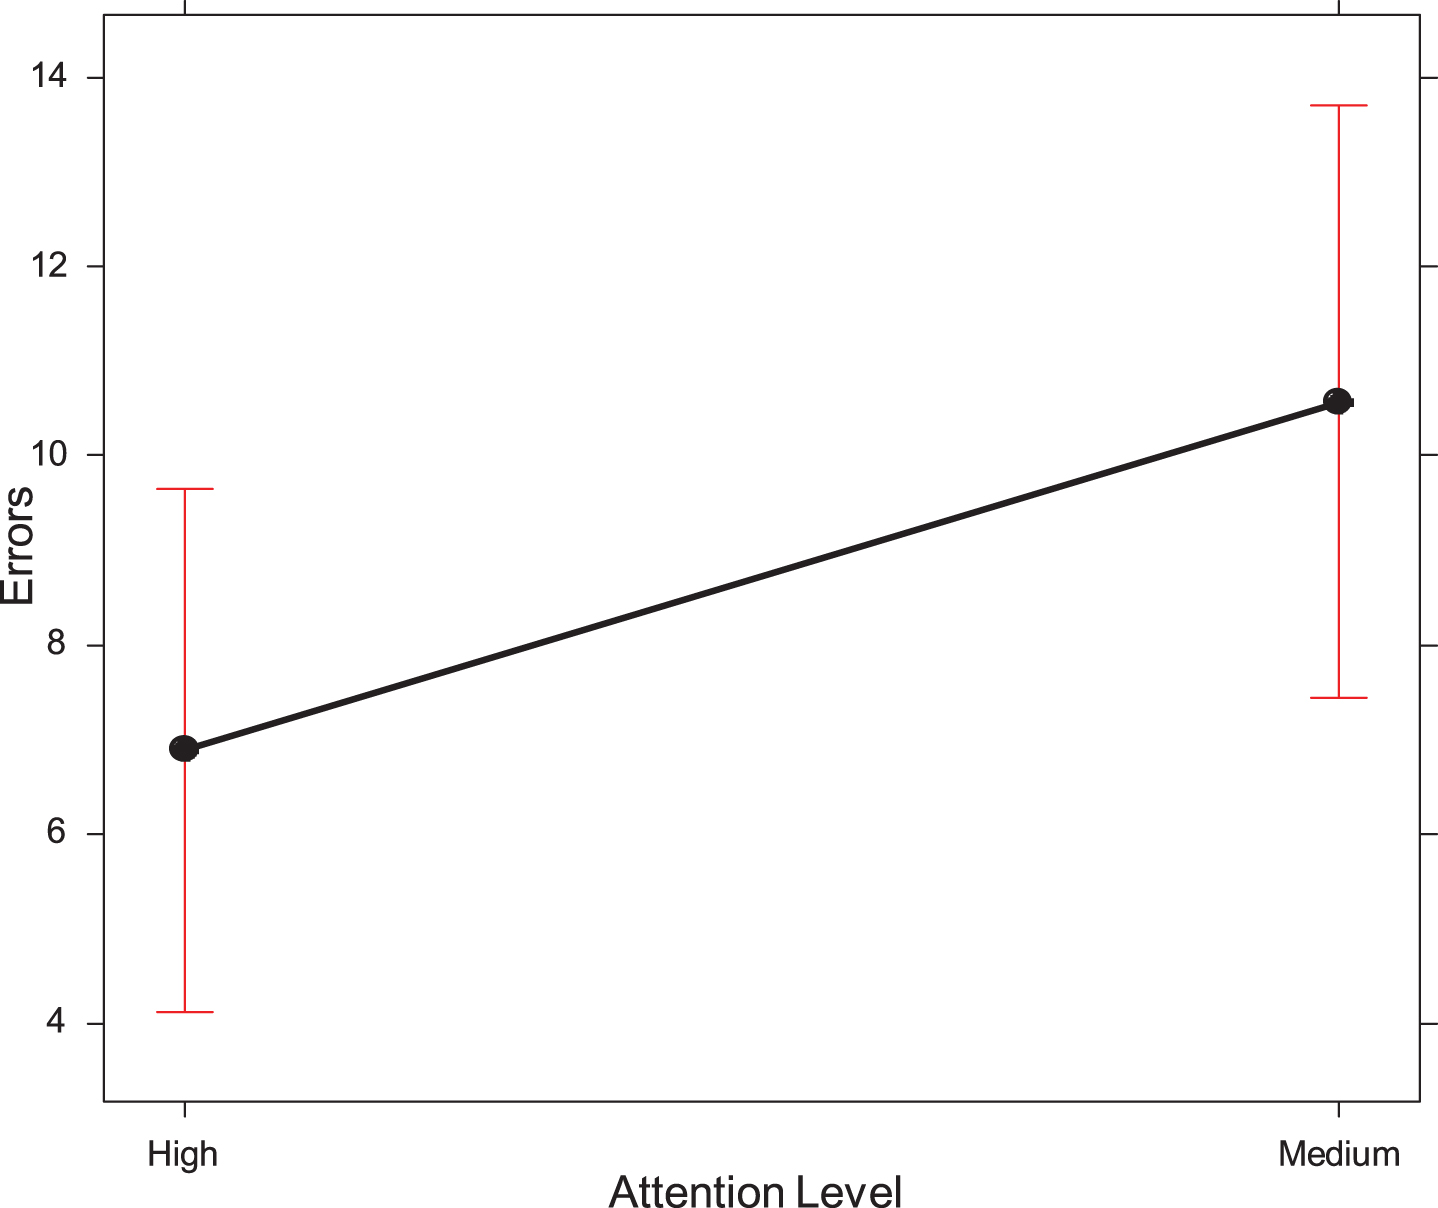
Attention Level × Error.
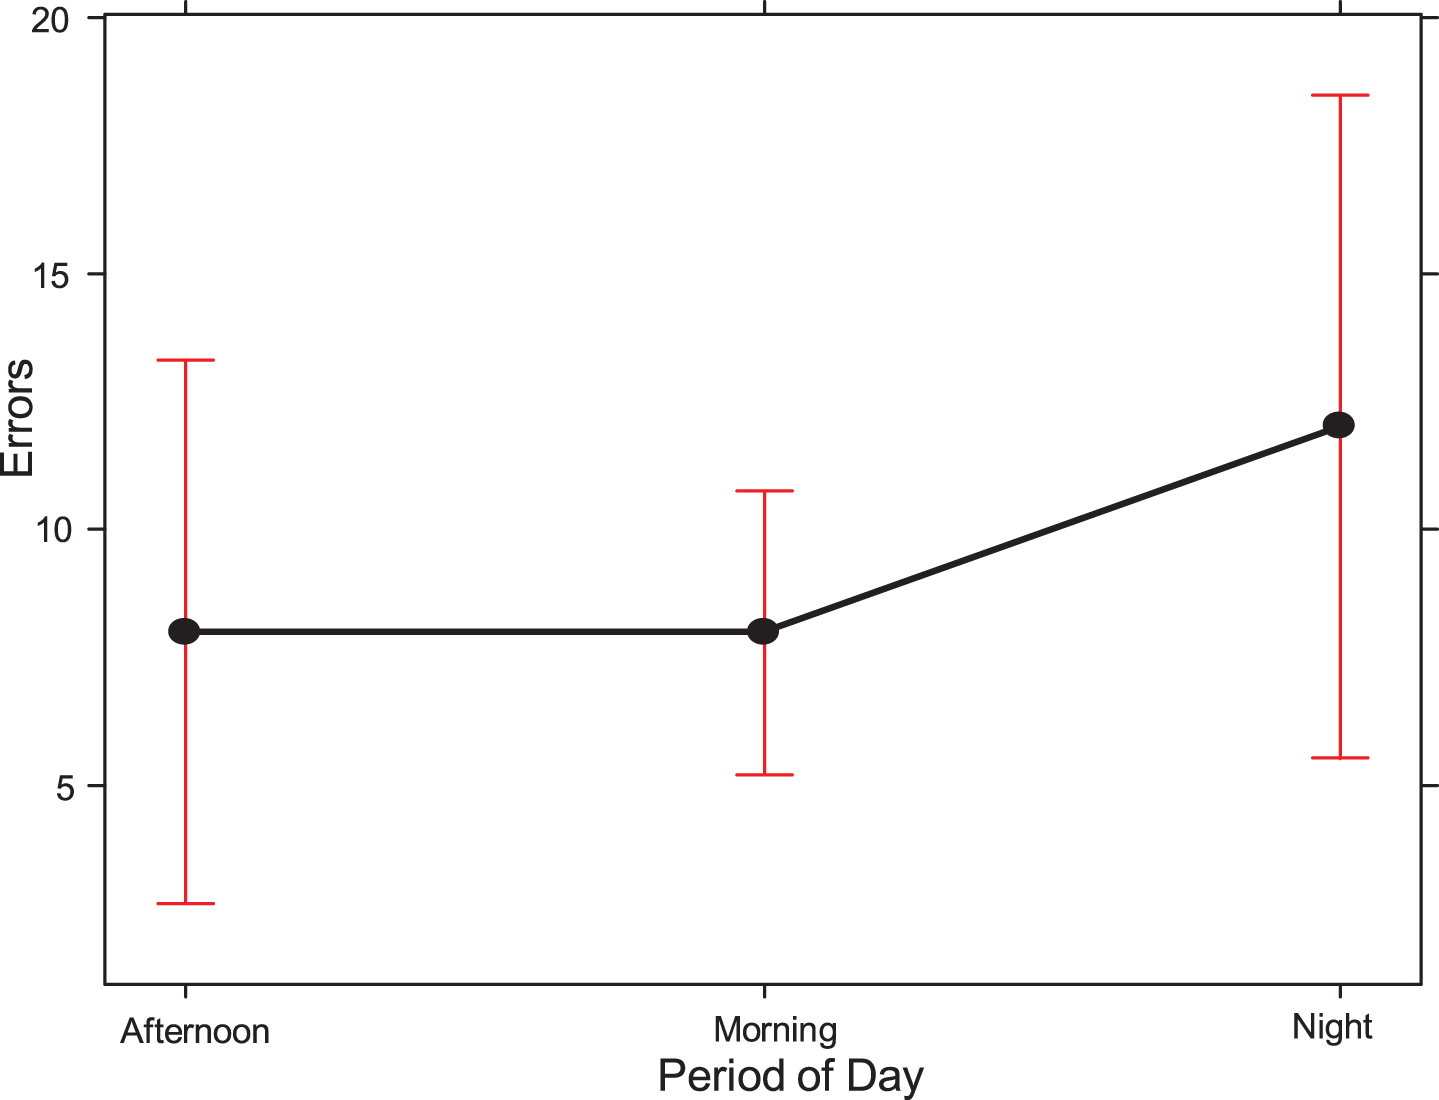
Period of Day.
To identify the impact of the Expertise Level, Sleep Deprivation, Attention Level and Period of Day on the number of errors, given by Errors, the normality test was applied to verify if the variable Errors follow a normal distribution. The results from the tests were: the Shapiro-Wilk statistic equals to 0.92482, and the ρ-value was 0.20159. Since the ρ-value was 20.16%, the hypothesis of a normal distribution can be accepted. Thus, with a 95% confidence level, there is evidence that the data follow a normal distribution. The data distribution is close to the line and thus follows a standard distribution, as can be seen on the graph shown in Fig. 19.
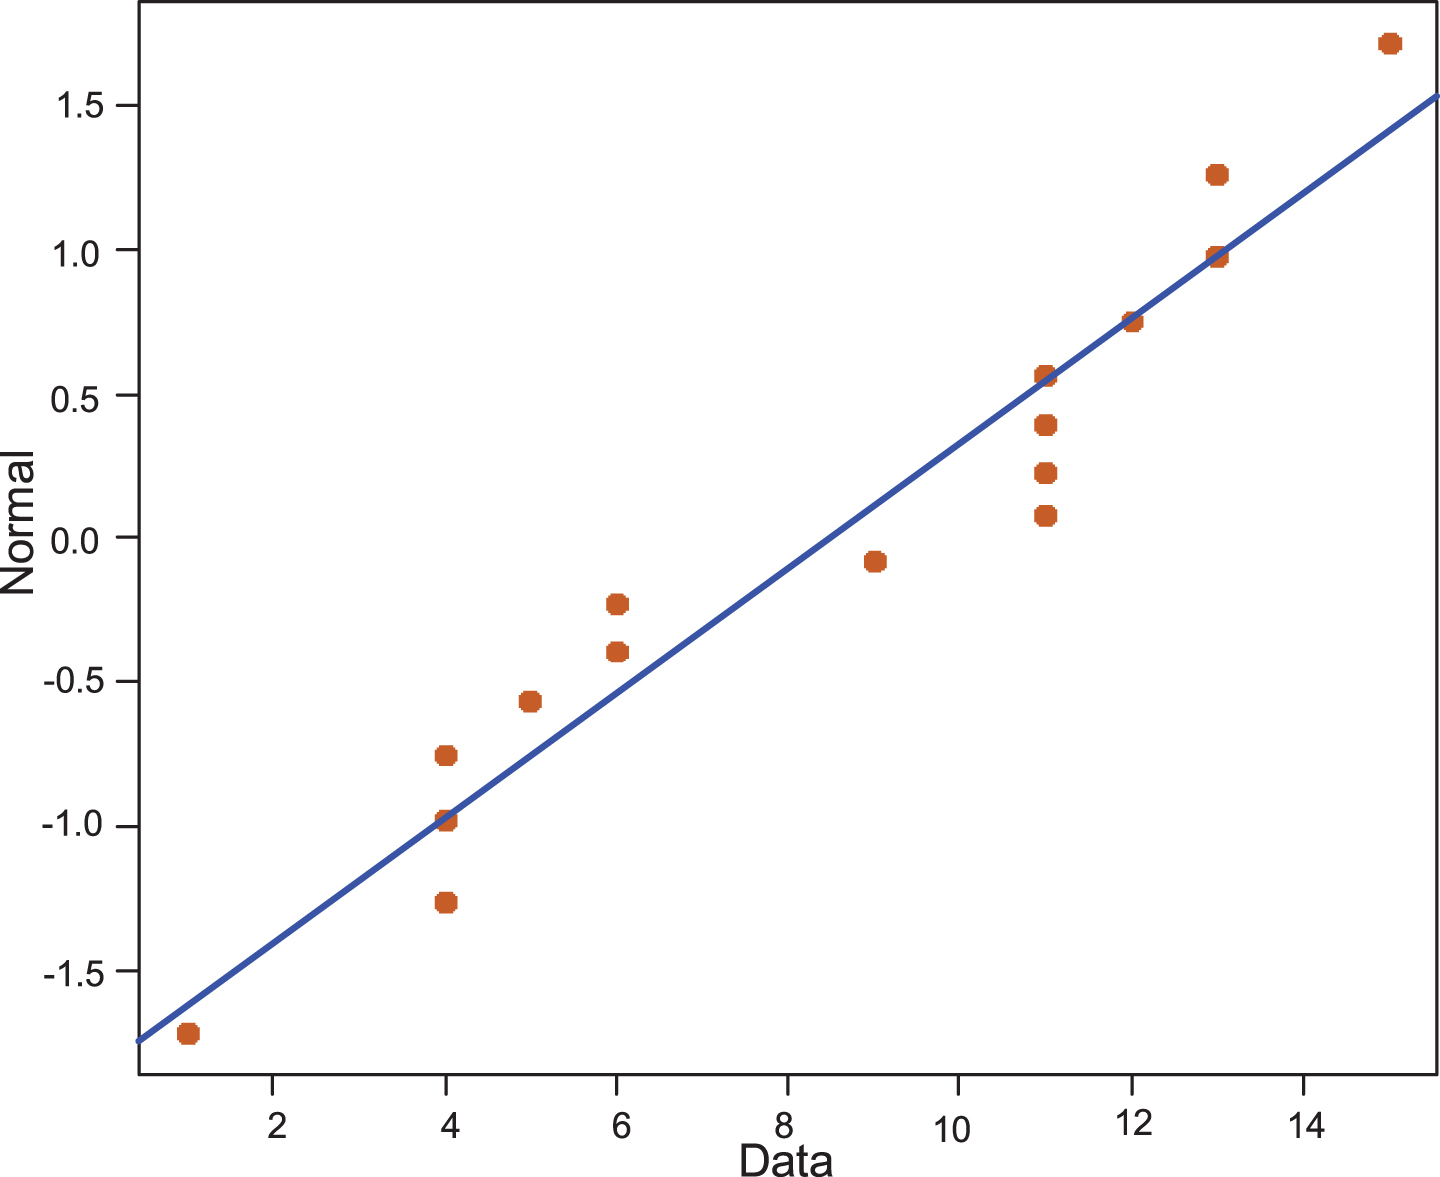
Role of Normality.
We applied a multiple linear regression model for the data acquired in this experiment because the data follow a normal distribution, and defined a subset of independent variables from all the variables available that best explain the behavior of the response variable. The most appropriate model for error analysis is defined as follows:
To verify if the model is adequate and the explanatory variables are significant for the behavior of the dependent variable, that is if the ρ- value for the variable is smaller than 0.1, it was tested for the null hypothesis if the coefficients for these variables were null, that is, H0 : β0, β1, β2 = 0 and H1 : β0, β1, β2 ≠ 0.
The test results are shown in Tables 9–12. Analyzing the results shown in Table 9 it is apparent that the variable Expertise Level is significant to the model since the ρ- value for its coefficient was below the significance level 0.10. Table 10 presents a descriptive analysis of the model residues containing the values of quartiles, maximum and minimum, average, and median. Furthermore, in Table 11 the ρ-values for each coefficient are shown. To reject the null hypothesis that considers that the coefficient is not significant for the model, the ρ-value of each coefficient must be lower than 0.1. Since both the value for the intercept and the variable Expertise Level are smaller than 0.1, we reject the null hypothesis, that is, these variables are significant for the model. On the other hand, the ρ-value for the Sleep Deprivation variable coefficient is greater than 0.1, and therefore we cannot reject the null hypothesis, and we cannot state that this variable is significant for the model.
Variance analysis
Exploratory analysis (residual values)
Coefficients of the linear regression model
Context classification
{The Residue Standard Deviation is 2.24932, the Degrees of Freedom is 13, R
Based on the results here presented, there are indications that the errors made by individuals taking part in the experiment are dependent mainly on their level of expertise on the simulator. The model proposed to describe the Context, considered the time of day in which the activity the individual’s level of attention, based on the D2 test and the individual’s number of hours of sleep deprivation. It also describes how each factor impacts on the dependent variable, based on the linear regression model, as a weighted average of the various factors considered:
Table 12 shows the results from the Context classification according to the aptitude of the individuals to perform a given task. The Context model introduced effectively determines whether an individual is apt to perform the critical task.
In this paper, we presented results related to the influence of the emotional state based on brain signals and Context of an individual while executing a given task. The aim was to investigate the emotional recognition of an individual performing a critical activity to evaluate the proposed method.
We obtained the data on the emotional state of individuals during experiments and classified them as: positive/excited, positive/calm, negative/excited, and negative/calm.
The results obtained with the EEG signals classification for detecting an individual emotional status were considered satisfactory. This result has an accuracy of approximately 90%, using the entropy characteristic. Furthermore, from the data analysis, it was observed that 80 % of the human errors occurred when the subject was in a negative emotional state.
We defined the Context by a set of factors chosen to have the most significant impact on task achievement. The choice of factors was guided by adopting the technique 5W1H. A multiple linear regression model was employed to verify the impact of variables on the human error during the experiments. It was observed that each variable habit won degree of influence. Therefore, Context is represented by a weighted average of the considered factors to represent their impact on the emotions. We can conclude based on the results that an individual’s level of experience is the most influential factor in the emotions because those individuals better qualified and experienced incurred in a positive emotional state and consequently in fewer errors.
As future work, we are planning to increase the number of participants in order to achieve higher degrees of confidence in the results, although we already have a 95% chance that results presented in this paper are significant. We also plan to investigate how face expressions acquired using cameras during the experiment can be used to increase the confidence in the results and other working and operational conditions.