
Abstract
Falls in the elderly are a public health problem because this population tends to have a longer recovery time and consequently longer hospital beds. Studies show that 84% of falls in hospital rooms occur near the bed, that led to strategies to prevent falls in the elderly population have been studied. In this context, this paper presents a schema for the detection and emission of bed exit alerts in the elderly. This schema uses signals derived from RFID sensors processed by a model based on Intelligent Swarm and Fuzzy Sets. The main contribution of this study is the use of a Membership Windows that reduces the effects of missclassification of other strategies. The proposed work evaluated a data set containing 14 elderly aged between 66 and 86 years divided into two rooms. The results show that the presented approach improves the precision and recall in environments with greater uncertainty of classification.
Introduction
Recently, the population demography has undergone drastic changes, placing elderly population in constant growth [15]. This growth may be associated with a reduction in the birth rate, that is, the number of older people has balanced in relation to the number of non-elderly people or is associated with scientific advances in general. Thus, new discoveries in science, elaboration of new technologies and discoveries of new pharmacological substances and sophisticated equipment allow prolongation of life confronting the pathologies [29]. In this way, the developing of new technologies in order to provide greater well-being for this population is a field of research that has attracted interest from several researchers [1, 28].
The falls recurrent by elderly in domestic or hospital environments are a public health problem. Occurrences of these falls and its consequences may lead to the need for health services which generally implies very high costs [10]. A prevalence of 84% of falls with elderly in hospitals occurs during movement in the bedroom and near bed [12]. In addition, falls in this population result in longer hospital stays compared to younger people [11] and it can result in disorders such as anxiety, depression and even loss of independence. Similarly, caregivers and nurses may also be affected by psychological trauma [23].
Therefore, some studies have focused on the development of strategies for monitoring the bed exit of elderly. This monitoring can provide the caregiver or nurse opportunities for intervention and prevention of possible falls [11, 34]. Installation of cameras in the rooms of the elderly allows this monitoring efficiently [4, 30]. A 3D Convolutional Neural Network (CNN) was used to predict motion sequences of healthy adults of ultra low resolution clips of depth images [5]. Its experimental results show that the method is efficient to recognize bed exits and movements anterior to the bed exit, which may allow nurses or caregivers to intervene in a timely manner. However, using video cameras makes the method invasive [21]. In addition, experiments were done only in healthy adults and not in elderly.
A non-invasive approach uses low-cost Radio Frequency Identification (RFID) devices and machine learning techniques [29, 37]. Sensors are made up of a small, inexpensive, lightweight RFID tag called Battery Wireless Identification and Sensing Platform -WISP or W2ISP [13] and are used in the garments of elderly patients, as can be seen in Fig. 1. This technology provides a low computational cost solution using a single accelerometer per people [31] and a good receptivity on the part of the participants for being light, small and allows simultaneous monitoring of the multiple patients [17] without decreasing patients’ privacy, which occurs with the use of video cameras.

Elderly using sensor W2ISPens (3g, 18 × 20 × 2 mm), flexible antenna (36 × 85 × 2 mm) and insulating silver fabric (230 × 220 mm). [37]
Limitations of the non-invasive approach are presented: Firstly, it cannot discriminate efficiently the classes that are imbalanced and they are. In additional, seated and standing postures are difficult to discriminate, since in both the shoulders are placed in erect form. Unbalance occurs because the study was performed with elderly who usually spend more time lying down than walking [29]. Secondly is the positioning of some antennas in the room where the experiments were performed [29, 37]. During the transition of some positions occurred occlusions of some sensors with the body which entails errors of reading and classification and consequently the emission of false alerts. Finally, responsiveness of the bed-exit recognition algorithm can be limited by time the sensor observations are obtained by the antenna and potentially directed to the system [37]. For example, an out-of-bed prediction may occur after the physical transition of a patient because the sensor was not properly energized at the time of the patient’s bed exit transition. This is due to the sensor collecting power from the antennas installed in the room and this is a limitation of the sensor used [25]. In [37], the efficiency of the approach depends on the correct postural transition. Thus, reading errors of sensors and or of the classification may compromise the issuance of the alert.
The dificulty in discriminating seated from standing postures, the complexity of dealing with problems with unbalanced classes [29] and the dependence on the correct classification transition sequence [37] will be addressed in this study. Therefore, this paper presents a bed exit monitoring and detection scheme of elderly. This scheme uses signals issued by RFID sensors [29, 37] and a prediction system inspired by Particle Swarm Optimization (PSO), denominated New Constructive Particle Swarm Clustering (NcPSC) in this paper, associated with a decision-making model based on Fuzzy Sets [38].
The main contribution of this study is the use of membership values in each class to detect bed exit alerts (Section 2.2), reducing dependence on correct postural transition mentioned in [37] and the effects imposed by structural limitations of the sensors and configuration of the experiments [29, 37]. Another contribution is the use of a classification method based on prototypes, different from other studies. That sort of classification better deals with problems in which classes are arranged alternately and are non-linearly separable.
The efficiency of the proposed scheme is evaluated in a database containing 14 elderly participants aged 66 to 86 years divided into two rooms and the results are compared to ones presented in [29, 37]. Our propose presented better results for room 1 than all other studies. It is important to mention that room 1 has a higher signal loss rate than room 2 due to the way the antennas were installed.
This paper is written in then following manner: similar works are in subsection 1.2, the proposed scheme is described in section 2; section 3 presents the data set used in the experiments and their results; finally, in section 4 the final considerations are made.
A real-time data flow tracking strategy is proposed in [36] in which the classification task is performed only in follow-ups whose information is accurate for reducing classification errors. Four classification models, such as Conditional Random Fields (CRF) [18], Support Vector Machine (SVM) [35], Naive Bayes [26] and Random Forest [2] are used to discriminate the activities. The proposed strategy presented good precision and recall values, but it should be emphasized that the experiments were performed in young adults (mean age of 26 years) and not in elderly.
Other studies investigated healthy older adults because usually elderly spend more time lying in bed than performing other activities unlike young people. So [29] uses signals provided by RFID sensors and a method based on CRF for movements recognition considered from bed exit. The strategy presented good results (accuracy and recall values) for of one room, however, in another room its recall value is less than 70% making intervention difficult.
The work proposed in [33] uses a score function in each class (computed as the number of occurrences of the class in fixed time window) and determines as predicted activity the one with the highest value. This mechanism is implemented by Weighted Support Vector Machine (WSVM) classifier [19] for discriminating classes. This study implemented a fixed window with 4.8 s (delay), thus, if intervener is not close to the bed, delay tends to increase reducing the possibility of correct intervention.
In [37], a Sequential Learning Classifier was proposed to analyze bed exit motion. For validation, the authors used data extracted from 14 elderly (66-86 years old) who wore a wearable embodiment of a battery-operated accelerometer RFID sensor loosely attached to their clothes at chest height. The participants undertook a series of activities including bed exit in two room settings.
Finally, [32] presented a CRF-based hierarchical classifier for bed exit detection. The classifier is evaluated using 3 datasets formed by Hospitalized Elderly and Healthy Elderly. Main advantages of the proposed scheme are ability to adapt the trained model to different activities and a shorter training time compared to other models. However, similar to most methods, this approach generates a large amount of false alarms due to signal loss and incorrect readings.
Detection and alerting of bed exit motion
This section presents the proposed approach, illustrated in Fig. 2, for issuing bed exit alerts. Initially, labeled instances (containing the class) were used for model learning (training step). In this step, the labeled data are presented to the NcPSC method [27] and it generates a set of labeled particles that maximizes the accuracy of the dataset (subsection 2.1). These particles can be seen as prototypes of groups, that is, a class can be represented by more than one particle. Because the classification process was performed with prototypes and using Euclidean distance as similarity metric, the data were normalized in the interval [0,1], avoiding one dimension from being more important than other. In a next step, the “Computing Membership Function Values” module determines the association values that will compose each window (subsection 2.2). These values are computed using RFID sensor signals and the set of labeled particles found in the training step. These windows are used to determine if a bed exit alarm will be triggered in “Bed Exit Detection and Alerting” module.
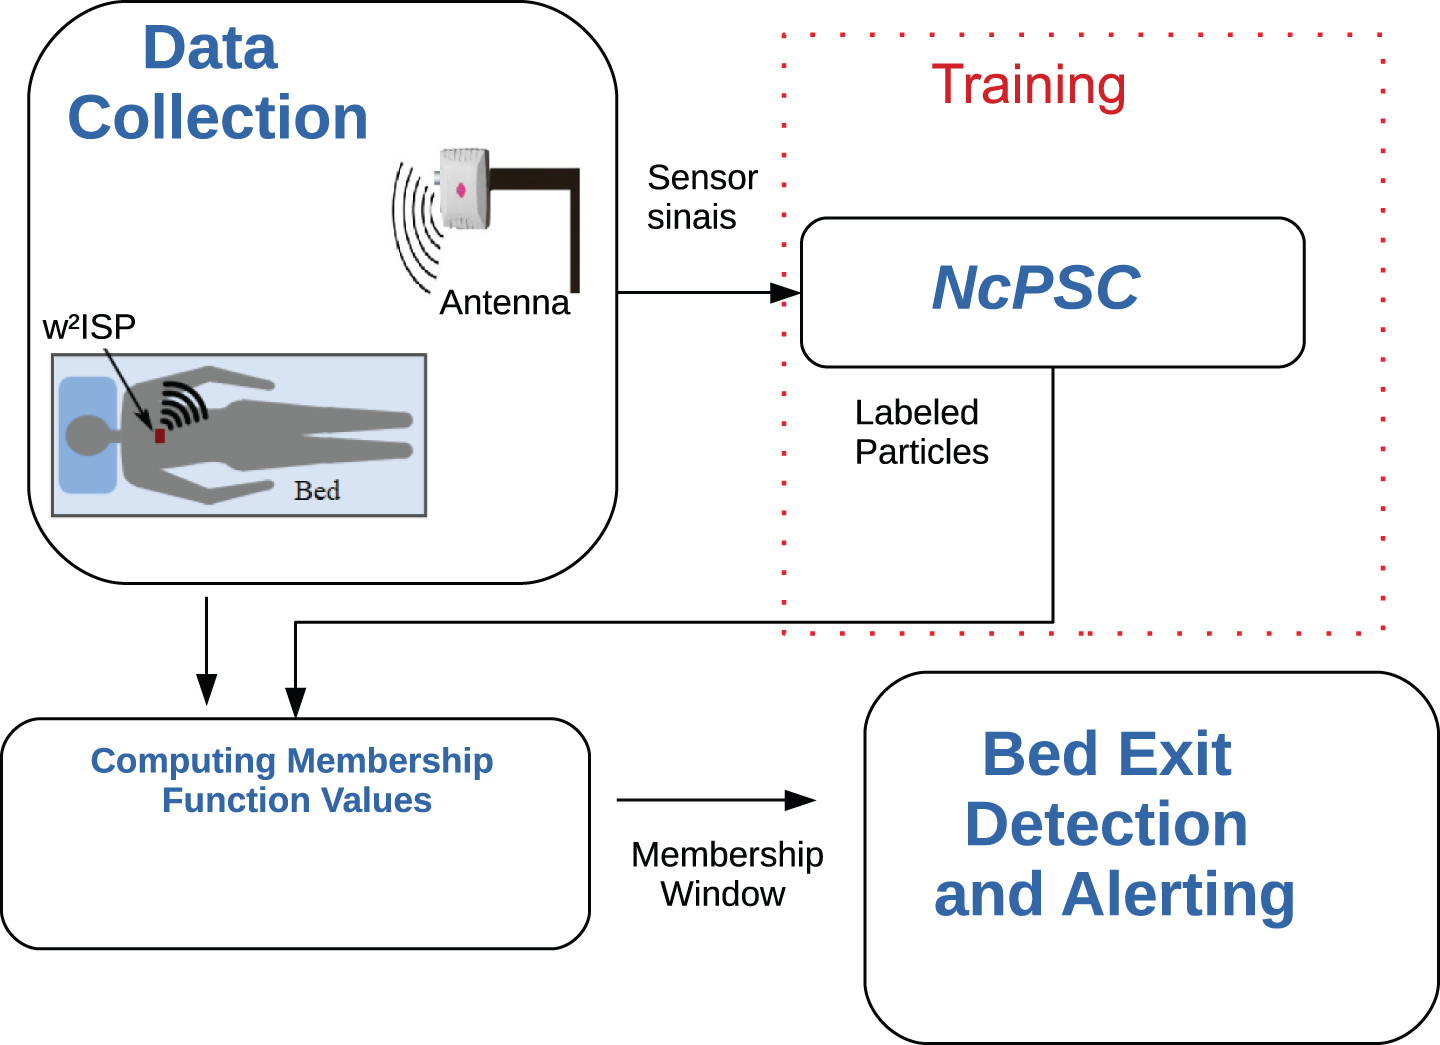
Classification and Bed Exit Detection scheme flowchart.
Classification stage used New Constructive Particle Swarm Clustering (NcPSC) method. Firstly, this method was proposed for classifing faults in a drive system of a DC motor [3]. The NcPSC classification mechanism occurs adaptively since algorithm seeks to increase the number of prototypes for increasing the accuracy of the method. However the number of prototypes can not enhance significantly, not allowing to increase the computational cost. In the NcPSC the prototypes are called particles, since it is based on the algorithm Particle Swarm Clustering (PSC) [9], an algorithm for texts grouping adapted from the Particle Swarm Optimization (PSO) method [14].
NcPSC is a rating method inspired by the PSO, and therefore, it implements memory and cooperation concepts for moving particles through the search space. A term of self-organization [16] is added to the particles motion mechanism [9]. Thus, each training instance is presented to the NcPSC and the particle with highest similarity to the instance moves towards it.
Equations 1 and 2, proposed in [9], update, respectively, the speed and position of a particle through the search space. Where: α is the inertia weight used to prevent particles with very high speeds from moving out of the discourse universe. The terms φ1, φ2 and φ3 are vectors of random weights generated in an uniform distribution in the interval [0,1], are used for pondering the weights of memory, cooperation and self-organization, respectively, of each particle; p
w
is the winner particle (most similar to the training instance Y
j
); and V
w
denotes the speed of particle p
w
. Pbest and Gbest are, respectively, be the optimal (highest similarity) position found by each particle and by the total swarm in relation to the training instance Y
j
.
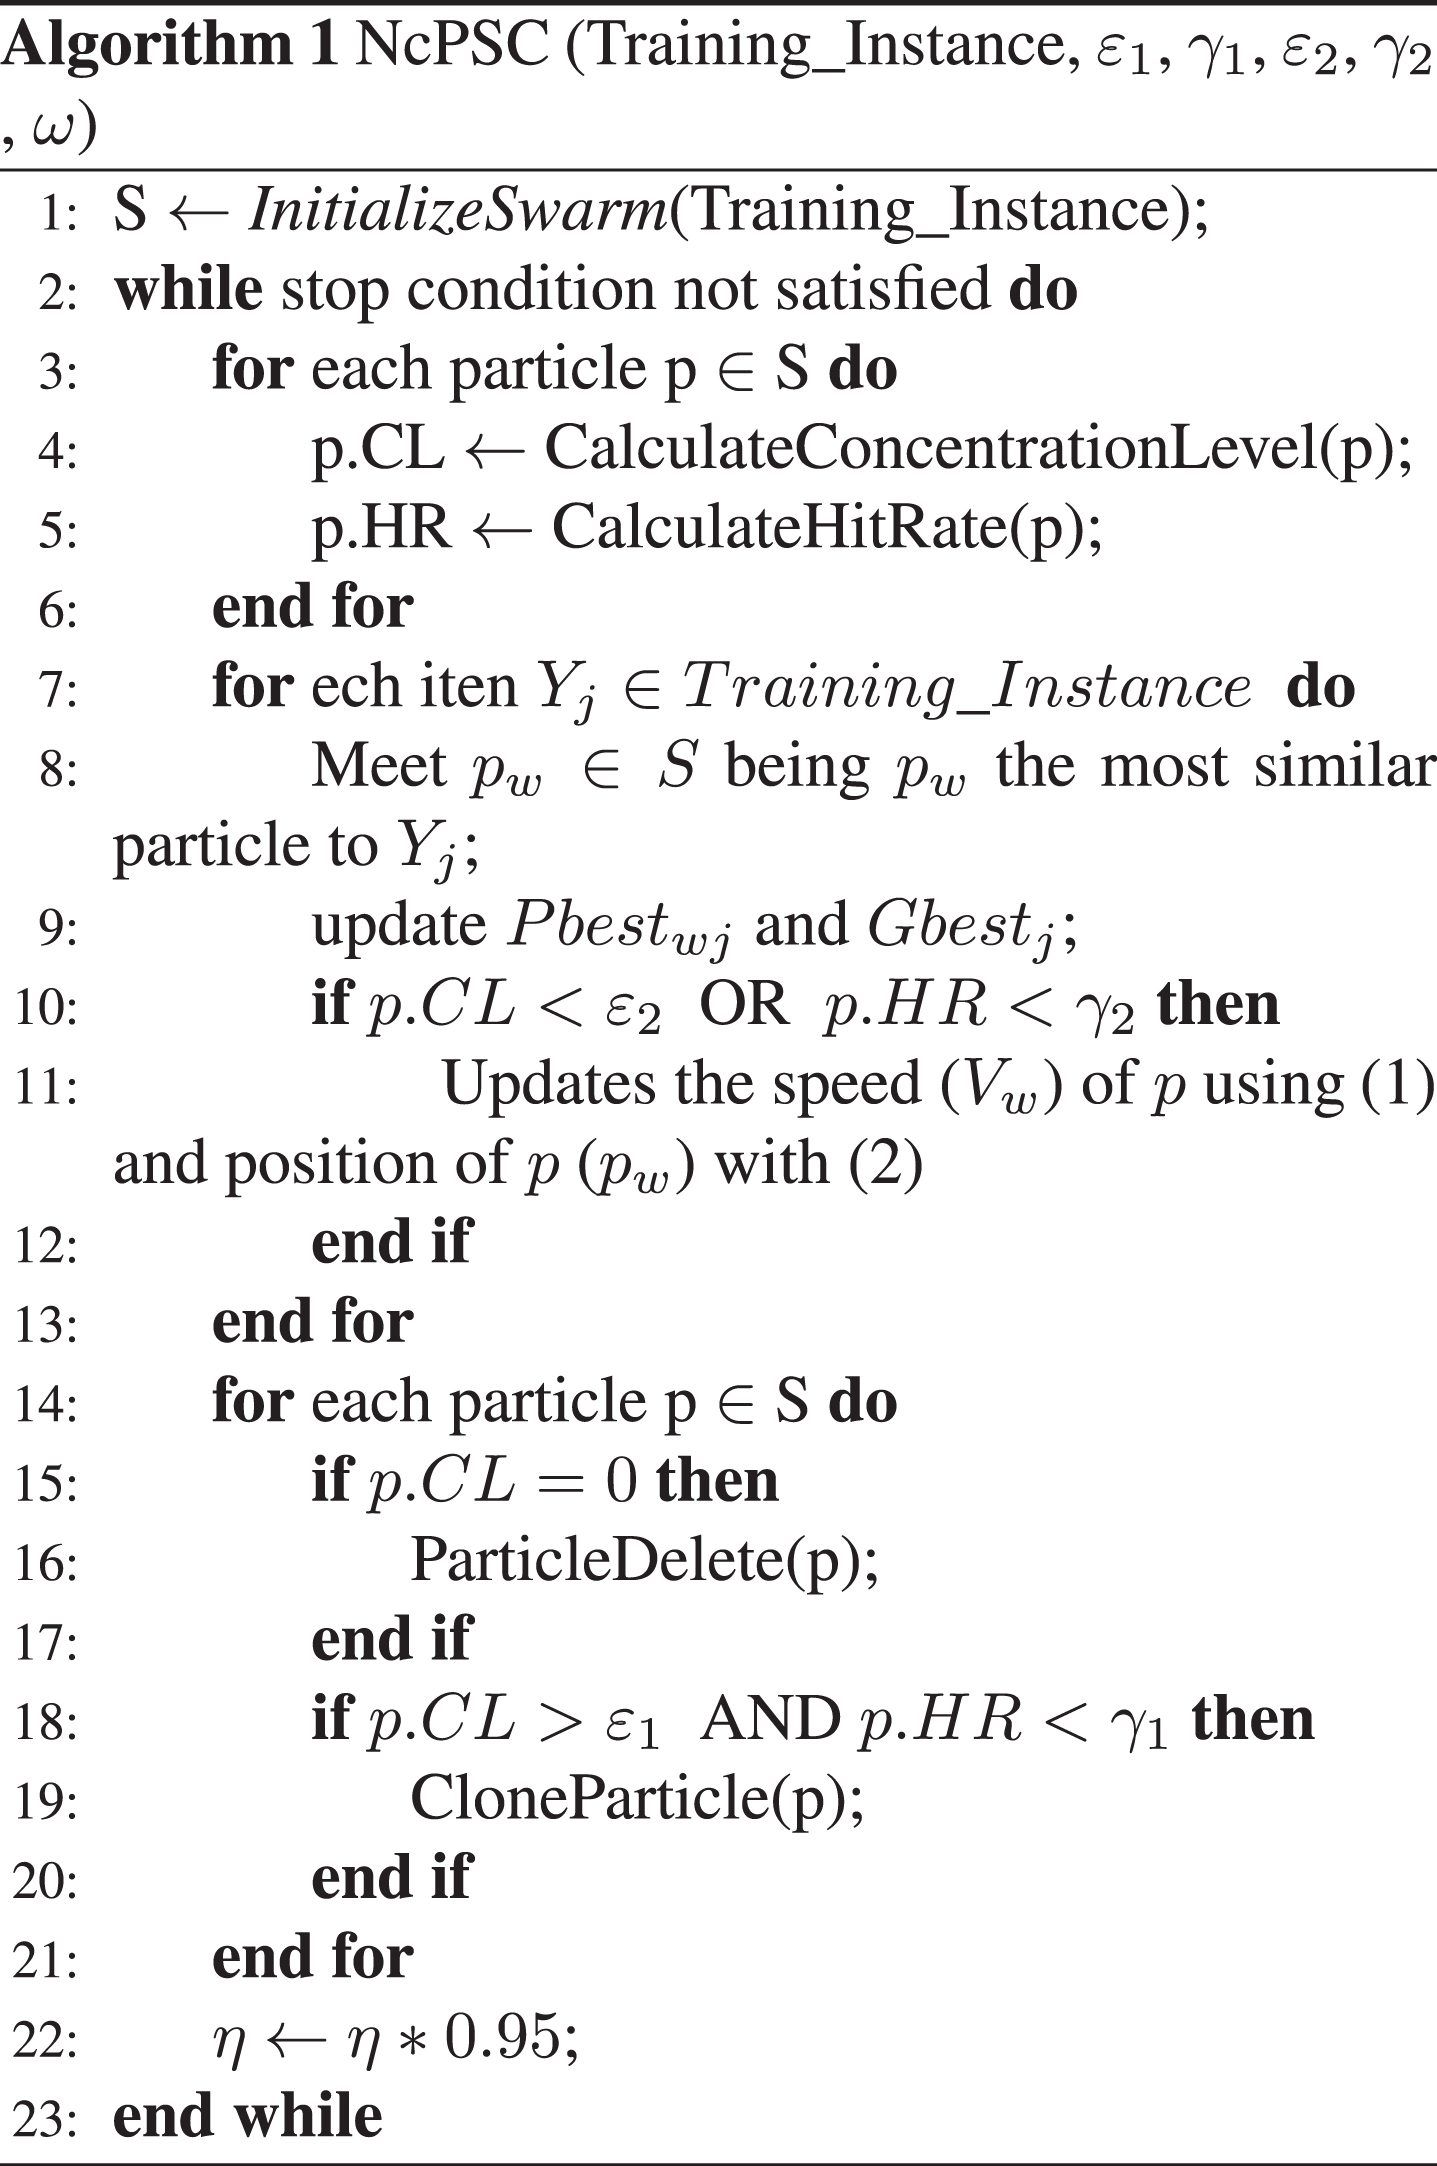
The NcPSC method is described in algorithm 1. With the following properties: ɛ1 and γ1 are cloning thresholds; ɛ2 and γ2 are movement/stagnation thresholds; p . CL is the concentration level of particle p; p . HR is the hit rate of particle p; η is learning rate; The initial swarm is composed by set of centroids found with the Subtractive Clustering(SC) method [7].
The concentration level of a particle p is computed as the ratio between the total of training instances that particle p concentrates (the particle is most similar to the training instances of all particles) and the total of training instances. This value is also used to calculate the hit rate that is obtained by the ratio between the total of training instances belonging to the majority class, among all the classes concentrated by the particle, and the total of training instances associated to p.
The following mechanism is developed by NcPSC for computing the concentration level for all swarm: Initialize the concentration level of swarm with zero (S . CL ← 0) For each training instance do: Found the most similar particle (p
w
) to training instance; Update concentration level of p
w
: p
w
. CL ← p
w
. CL + 1; Associate the current instance to p
w
;
The routine CalculateHitRate (S) is given: For each particle (p
j
∈ S) do: Compute MC← majority class from all instances associated to p
j
; N
p
← Total of instances associated to p
j
; ∥MC
p
∥ ← Total of instances from MC in p
j
; do
Particle stagnation
A particle p is stagnated when p . CL > ɛ2 AND p . HR > γ2. If p has both high hit rate and high concentration level, it will not move in in current iteration. This behaviour reduces chances of particle p explores regions outside the search space [27].
Experiments with artificial data were performed to verify the effect of Particle Stagnation Mechanism (PSM) on problems with unbalanced classes. The arrangement of these data is shown in Fig. 3. The dataset is distributed in 3 classes (Class 1, 2 and 3) with 10, 100 and 100 instances, respectively. The NcPSC was applied to artificial data with PSM and without PSM and the results shown in the Table 1 (p-value < 0.05 considering the Mann Whitney test [22])). The Results show that the PSM contributes to the improvement of classification in problems with unbalanced classes.

Disposition of artificial data with unbalanced classes: classes 1, 2, and 3 have, respectively, 10, 100, and 100 instances.
Result in artificial data
The self-organization mechanism developed by PSC [9] for calculating the velocity of a particle p, causes p to be attracted by the evaluated instance. Therefore regions with high concentration of training instances are more attractive than regions with low concentration of training instances. For example, in Fig. 3, while class 2 has 100 instances, class 1 has only 10 instances and a particle located between the two classes will move to class 2 (class with most instances) since class 1 will present the particle only 10 times while class 2 will be presented 100 times. PSM reduces the influence of the amount of instances on particle movement, because when a particle concentrates instances of a minority class but has a good hit rate it will not be attracted to the majority class.
Figure 4 illustrates the cloning mechanism. When a particle concentrates a reasonable amount of training instances and and it has a low accuracy (<γ1) that particle will be cloned and the new particle undergoes a small change in one of its variables. Figure 4(a) show 2 classes associated to one particle only, so this particle has a low accuracy. Cloning of the particle allows the increase of the accuracy, since part of the data associated to the cloned particle starts to focus on the clone particle. This happens in the illustration showed in Fig. 4, part of the instances that were associated to the cloned particle in a) concentrate in the particle clone in b). Note that the instances associated to the two particles are of different classes.
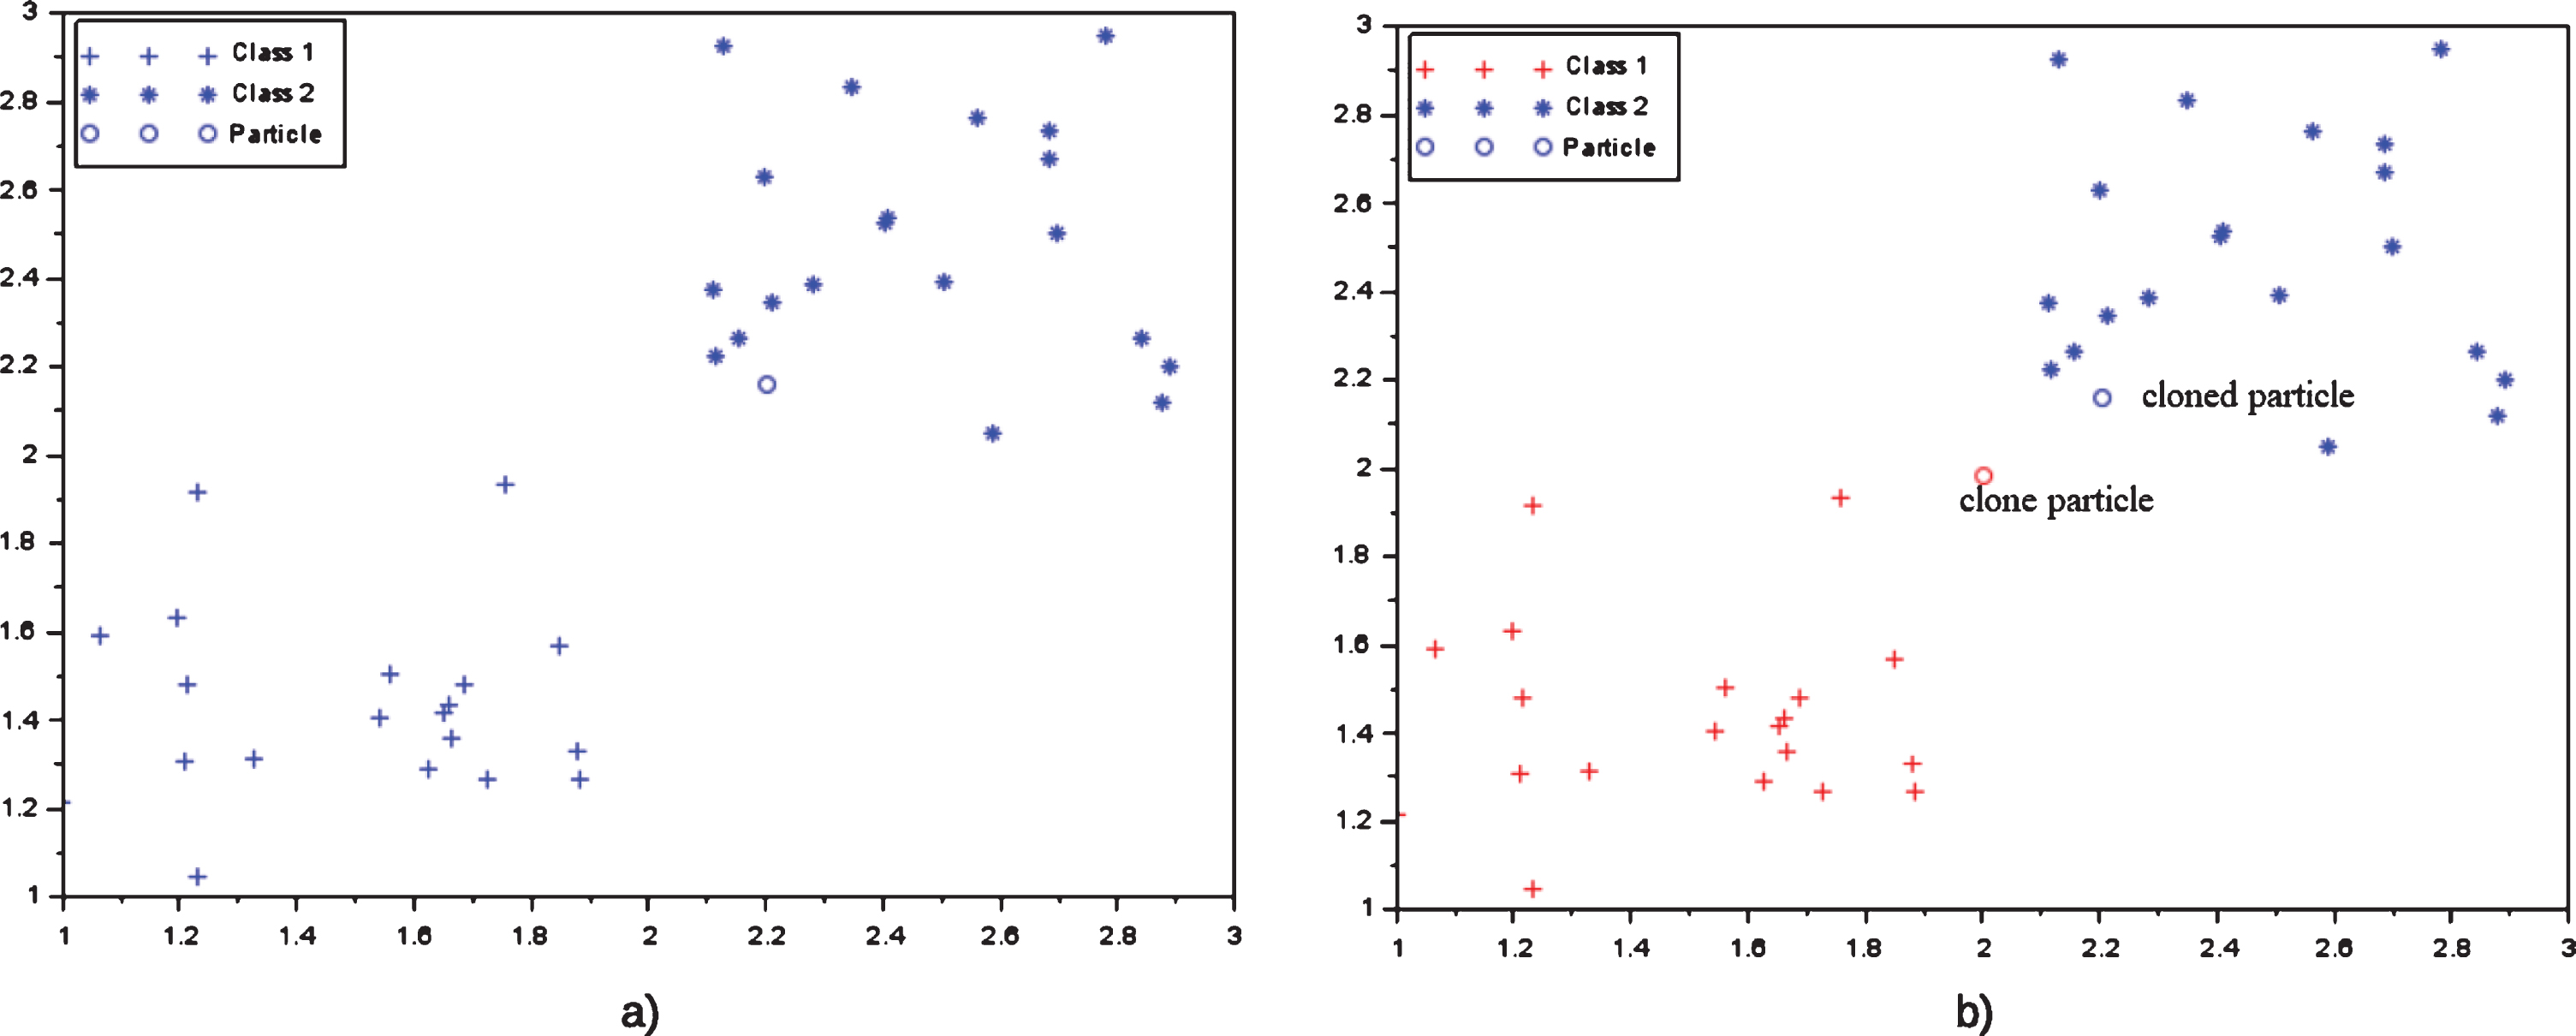
Cloning Scheme: a) Instances of two classes associated to a single particle. b) After Cloning the class instances will focus on the cloned particle and instances of the other class on the clone particle.
This prototype-based classification model and the cloning mechanism allows the classifier best treat problems in which classes are arranged alternately and are non-linearly separable. Figure 5 ilustrates a problem with 3 classes –C1, C2 and C3. Firstly Fig. 5a) shows the arrangement of the data in the 3 classes. It is easy to note, for example, some class 3 instances are between instances of class 1. To get best results, the NcPSC uses 6 particles for classifing classify the classes instances in micro-group format, as detailed in Fig. 5(b). We assume that classes 1 (sitting in bed) and 3 (standing) are not linearly separable –trunk is erect in both –and so we use NcPSC for the classification task.
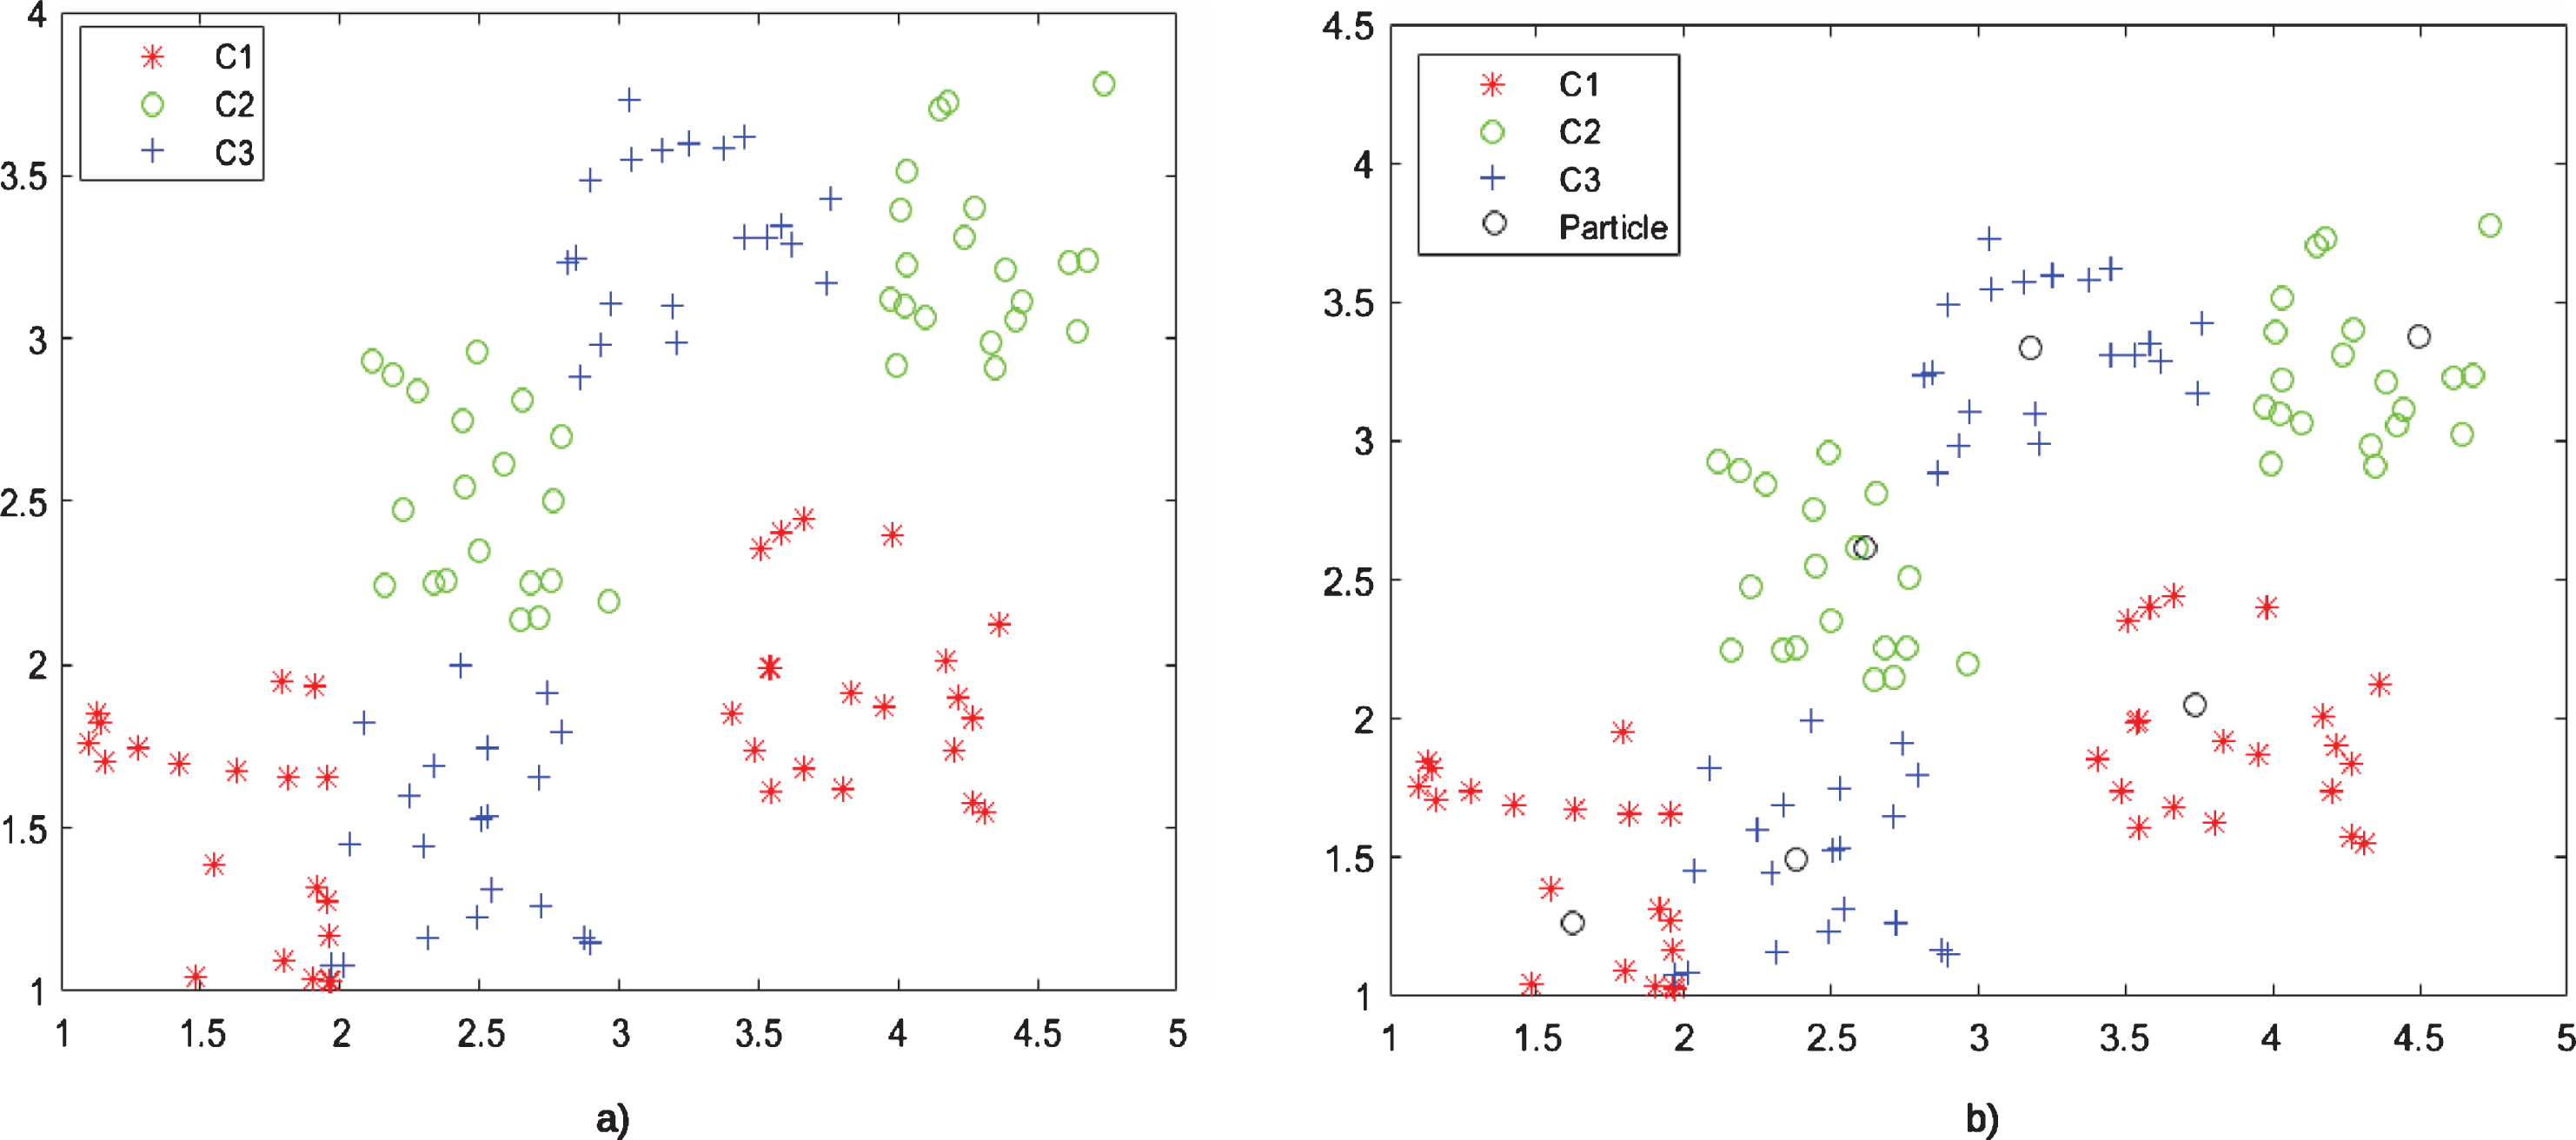
Illustration of a problem with alternating classes and non-linearly separable: a) Data Set Layout; b) Final arrangement of the set of particles and data.
Fuzzy sets are characterized by a membership function able to relate elements of any discourse universe (x) to their respective membership degrees μF (x) to the nebulous set F, which can be described as a set of ordered pairs (as in 3). With the modeling in the form of fuzzy sets, x can belong to more than one set simultaneously allowing the model to capture the degree of uncertainty of the problem. The membership function value of an element in the universe of a given Fuzzy set is a real number in the interval [0,1] and represents how true is the assertion that this element belongs to set.
In this study, we consider each sensor reading set at time t as x
t
with 1 ≤ t ≤ n, x
t
∈ R3 and each class as a fuzzy set represented by FC
i
(1 ≤ i ≤ 3, considering that the proposed problem has 3 classes, namely: 1- sitting in bed, 2 - lying in bed and 3- standing). Membership degree of a reading to a given set FC
i
is given by (4).
In Equation (4), d (x t , p i ) denotes the similarity between instance x t and particle p i (p i ∈ R3) of the C i class more similar to x t . As stated earlier, in the proposed scheme, a class can be represented by more than one particle. While constraint (5) deals with fuzzy sets normality, constraint (6) defines that a x t element must belong to at least one class.
Bed Exit Alert System uses sliding windows composed of μFC
i
(x
t
). As the presented problem has 3 classes, NcPSC also implements 3 sliding windows(W1, W2 and W3) representing, respectively, classes 1, 2 and 3 - all windows with the same size (|W1| = |W2| = |W3|). Firstly NcPSC computes the arithmetic mean of each window (M (W1), M (W2), and (W3)) using (7) and a bed exit alert is issued when max(M (W1), M (W2), M (W3)) = M (W3) - that is, when the arithmetic mean of sliding window W3 is greater than arithmetic mean of the other two classes.
Dataset performed
To perform the experiments it was used 14 datasets extracted from two rooms: room 1 (09 datasets) and room 2 (05 datasets) [31]. Each data set refers to a participant aged 66–86 years with main characteristics listed in Table 2. For each participant, the readings were performed sequentially and the possible values for each class were observed, wich correspond to the label of the activity of that participant and at that instant of time. These labels can be: 1- sitting in bed, 2 - lying in bed and 3- standing. In this study it is used the time feature only to measure the delay of a bed exit detection. In the data set there are other participants activity, however, in these study, used those who had at least 4 consecutive measurements with label of the class that represents the bed exit motion. This is why a window of size 4 was used.
Features used [31]
Features used [31]
Participants were randomly divided between the two rooms adapted for elderly monitoring. In room 1 (RoomSet1) there were 4 antennas positioned as: one antenna was placed in a high support at the level of the ceiling facing bed and the others three were putted in vertical supports facing forward. Room 2 (RoomSet2) was configured with 3 antennas: two antennas were positioned in high ceiling-level stands facing the bed and another slightly further away from the bed and facing the chair [31]. Antennas were strategically located to best fit each room arrangements with constraint of ceiling and wall positioning of antennas.
During data collection, each participant wore a garment with the sensor attached over the sternum, as shown in Figure (1) and the participants were informed of the activities that should be performed and each activity was capitalized by the sensor and labeled. Participants performed activities that included:1) lie in bed; 2) sitting in bed; 3) getting out of bed; 4) sitting in the chair; 5) get out of the chair; and 6) going from A to B (A and B represent the bed, chair or door) for 60 to 90 minutes [37].
Two datasets corresponding to each room were evaluated. Table 3 describes differences between both datasets. One of the main challenges of this study is that the data sets used are very unbalanced. For example, in room 1, the reading percentages of classes 1, 2 and 3 are, respectively, 33.47, 61.23, 5.30. In room 2, the percentages are, respectively, 19.20, 74.77 and 6.02. This makes the classification task difficult. Another challenge mentioned in [29] is the difficulty to discriminate the class 1 from class 3 (sitting in bed and standing) since in both the position of the participant’s trunk is erect.
RoomSet1 AND RoomSet2 GENERAL INFORMATION
The efficiency of the presented approach was measured using precision, recall and delay values. Precision measures the rate of True Positives (TP) and in the context of this work, it indicates a correctly triggered alert - we consider TP an alarm triggered at time t when the activity read in [t - w, t] is class 3, w being the size of the window. The precision was calculated in (8) where False Positive (FP) represents the total of incorrectly triggered alerts - the alert was triggered but it should not fire at that moment. The recall was computed in (9) and the False Negative (FN) represents the total of alerts missed - alerts that should be triggered at a given instant but it did not occur. In this study, recall is important because these losses reduce the chances of intervention and possibility of reduction of falls. The delay for triggering an alert is the time elapsed between the instant the alert should be triggered (when ocurs Bed Exit Motion) and the instant the alert is triggered. A high value delay decreases the chances of intervention on the part of the nurse or caregiver and consequently the activity of prevention of falls.
Finally, was used the f-score (Eq. 10) to calculate the amount of FN and FP.
The experiments were carried out in two distinct ways: First, for each participant the data sets were randomly divided into training sets and test sets (both with same length) as performed in [37]. The precision and recall computed for participants in room 1 and 2 are shown respectively on Tables 4 and 5. We used 5-fold cross validation in second experiment and its results in terms of precision, recall, f-score and delay values are presented in Table 6. In this configuration, 3 folds were used for training the other two for validation and testing, respectively. In the third experiment the participant of each room with largest number of observations in class 3 was used to train the NcPSC. Then, was used the other participants, separately, to test the model. This experiment was performed in this way since in a practical situation, the using a single patient to train the model may be more viable avoiding discomfort to others patients. The results in terms of precision, recall and f-score are presented in Table 7. The results in the two rooms were analysed separately as data were collected differently in each room.
Tables 4 and 5 show the results for the first experiment. As shown in Table 4, our approach produced good precision and recall values for Bed Exit when compared to approach presented in [37]. In the same way, in room 2, present in Table 5, it can see that both are very close. However, these results show a greater heterogeneity of the results of the proposed approach. The overall recall values from rooms 1 and 2 are farther apart in the baseline study. The results of room 1 show that proposed method has lower alarm loss (better recall).
Comparison of proposed approach with baseline study proposed in [37] in precision and recall using room 1
Comparison of proposed approach with baseline study proposed in [37] in precision and recall using room 2
A comparison between our methodology and one designed in [29] are presented in Table 6. Firstly, for room 1, recall, precision and delay values produced by NcPSC are better than values presented in [29]. This result is statistically significant (based on an independent t-test) given its p-value (< 0.001).
For room 2, recall, precision and delay values of NcPSC approach are below the approach proposed in [29] in the values of precision, recall, f-score and has a higher delay. But not statistically significant (p.value > 0.05). In both rooms, the proposed approach got good recall. The recall measures the rate of lost alerts. That is, the alert should trigger but this did not occur. In this case, a high recall allows greater possibility of intervention on the part of the caregiver or nurse. This lower loss of alerts associated with a smaller delay can greatly increase the chances of correct intervention and thus, decrease the risk of falls.
Comparison of precision, recall,f-score and delay values with in [29]
For third experiment, the comparison between our approach and others [29, 37] for room 1 are presented in Table 7. All studies used the same data set in their experiments. Once [36] used young adults in their experiments, we didn’t analise it. The results from Table 7 show that only the proposed approach obtained recall and precision values above 80% considering only room 1. Whereas in room 1 there is only one antenna configured facing the bed and in room 2 there are two, the configuration of the antenna in room 1 is more susceptible to signal lossing due to sensor occlusion compared to the configuration of room 2 [29, 31]. The results obtained by NcPSC algorithm for room 1 show that this approach presents a lower sensitivity to signal lossing due to occlusion of the sensors.
General comparison in the room 1
Efficiency of the approach proposed in [37] depends on correct postural transition detected by a classification method and the unavailability of sufficient sensor observations, especially during postural transitions or incorrect classifications, may hinder alert issuances increasing the number of missed alerts (FN). In all other studies [29, 33], a single misclassification may be sufficient to confuse the system resulting in false alerts. This study implements a window of membership values for each class of the problem, dealing with uncertainties in classification phase. In this context, although a class is predicted incorrectly using the proposed windows mechanism, an alert may be issued correctly, since alerting depends on all window values. This fact is illustrated, for example, in Fig. 6, which presents two classes: 1 (sitting in the bed) and 3 (standing). A bed exit alert should occur when the system reports a class 3 instance. For proposed approach this occurs using windows of size 4. In Fig. 6, it can be seen that from 4 instances, 2 were classified incorrectly, that is, the system should label instance (x t ) as class 3 but it was labeled as class 1. Still, an alert will be issued when t = 4 (window end). The alert is issued since the average value of window 3 is greater than the average of window 1 (Window 3 = [0.46, 0.63, 0.50, 0.40], average value 0.50 and Window 1 = [0.47, 0.30, 0.39, 0.57], average value 0.43). Although two instances were misclassified (t=1 and t=4), the alarm was issued correctly. Thus, the approach presents is robust regarding unavailable sensor observations and classification errors, as in room 1, for example.
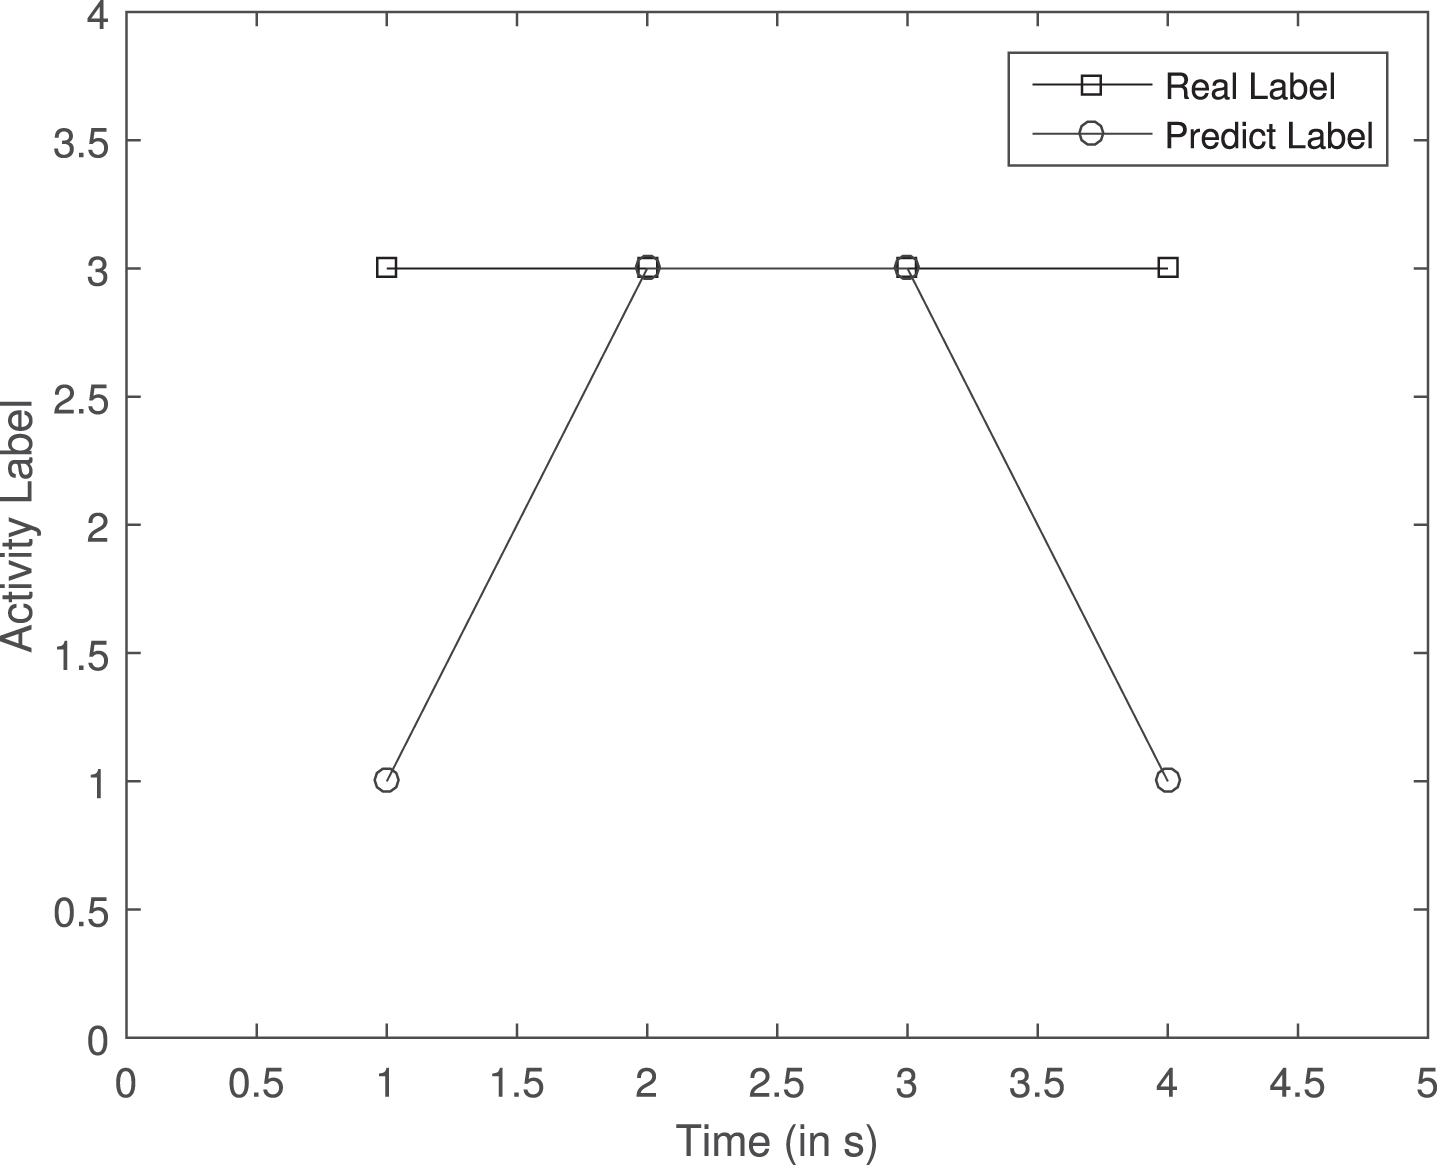
Illustrative scheme for bed exit detection and alert.
The delay is the mean of difference in time variable between the last and the first observation of a window considered as bed exit movement (containing only activity 3). It has a small value because the windows length is small (4 readings). So, increasing windows length would also increase the waiting time. In some cases there are up to 4 readings in a second, so for these cases, this difference is less than 1 second.
Finally, the main advantages of the proposed approach is discussed: Our approach allows greater chance of intervention in possible falls and consequently a greater chance of reducing such falls because it has a lower alert loss (good value of recall) and smaller delay. Studies conducted in [29] and [37] use the information from the RFID infrastructure and signals from sensors to perform the prediction and achieve satisfactory performance. NcPSC implements a simple mechanism for bed-exit prediction based on only signals from sensors and obtained similar results. Our approach uses labeled prototypes (labeled particles) as micro groups which reduces the misclassification in problems with class overlaping, as shown in Fig. 5. In the two rooms there is no clear separation between classes 1 (sitting in bed) and 3 (standing) because in both positions the body is erect [29]. Overlapping classes make data separation difficult and consequently increase classification errors. In this case, NcPSC better discriminated classes by using 1 or more prototypes to represent the same class, as ilustrated in Fig. 5(b). When using RFID sensors, the method is inexpensive and allow seniors to move freely and comfortably [37]. This type of sensor requires less maintenance effort because it is not placed directly on the patient’s bed [29] and enables simultaneous monitoring of multiple elderly patients which reduces their financial costs. Finally, this approach is non-invasive, which makes it possible to increase acceptance by patients and their families.
This work presents an approach for detecting and issuing bed exit alerts. The efficiency of the approach was verified in a problem with elderly between 66 and 86 years. These properly issued alerts can help caregivers and nurses to make interventions in a timely manner reducing falls. The presented approach uses RFID signals and a machine learning technique associated with Fuzzy Sets. Thus, classification errors that occur due to unbalance of the data set in the target class and read errors in the sensors increase the number of missed alarms. Therefore, the NcPSC method performed classification tasks on signals from the RFID sensors in order to minimize classification errors. It was also used a time window composed of membership values in order to minimize the effects of these errors.
The results showed that in room 1, where there is the greatest loss of signals, the present approach obtained best recall and precision values associated to a delay when compared to other approaches of specialized literature. In this sense, the proposed approach can be considered satisfactory in environments with many interferences and consequently many sensor signal losses.
A limitation of our approach is the way it considers a false alarm. Let w be window size and NE3 the total of elements belonging to class 3. A complete window of size w has all elements belonging to class 3 (w = NE3) while an incomplete window have 0 < NE3 < w. In room 1 there are 195 complete and 54 incomplete windows while in room 2 there are 35 complete and 49 incomplete windows. As the proposed scheme considers a real movement of bed exit to occur when there a complete window of class 3 (all values are class 3), incomplete windows contribute to issuance of false alerts (FP). For example, an incomplete window (W = [1, 1, 3, 3]) might have Window 1 = [0.39, 0.53, 0.3, 0.2] and Window 3 = [0.3, 0.23, 0.67, 0.59] the average value of Window 3 (0.45) is greater that the average value of Window 1 (0.35), in this context, an alarm will be issued, but as the system considers a real alarm only a full window this emission will be considered an FP.
Another limitation of the present study is the positioning of the antennas which, in many situations, may change the collection of sensor observations, increasing the delay and the number of incomplete windows, consequently increasing the number of False Positives. Future studies may focus on optimizing the efficient positioning of the antennas in order to reduce occlusions and false alert emissions.
In this study, as in others, the number of false alarms (FP) is high, this may make the approach use unviable, because a FP value represents a increase in system cost. In future studies, machine learning methods should investigate additional sources of information to extract robust resources or use robust strategies to discriminate similar activities. In addition, the short duration of experiments doesn’t represent the duration of a full day in a hospital. Therefore, long-term trials, including daytime and nighttime, should be considered with a larger sample of hospitalized elderly participants to assess the acceptability of the device after using the sensor for long periods of time.