
Abstract
Automated visual inspection is becoming an important field of computer vision in many industries. The real-time inspection of flat surface products is a task full of challenges in industrial aspects that requires fast and accurate algorithms for detection and localisation of defects. Structural, statistical and filter-based approaches, such as Gabor Filter Banks, Log-Gabor filter and Wavelets, have high computational complexity.
This paper introduces a fast and accurate model for inspection and localization of industrial flat surface products: Neighborhood Preserving Perceptual Fidelity Aware Mean Squared Error (NP-PAMSE). The Extreme Learning Machine (ELM) is used for classification. ELM is found to be the perfect classifier for detecting defects. The proposed model resulted in defect detection accuracy of 99.86%, with 98.16% sensitivity, and 99.90% specificity.
These results show that the proposed model outperforms many existing defect detection approaches. The discriminant power displays the efficiency of ELM in differentiation between normal and abnormal surfaces.
Keywords
Introduction
Automation of defect detection in industrial flat surface products like textiles, paper, plastic sheets, lumber wood, etc. is a challenging task. Computer vision helps automation of the inspection process and has many advantages such as the inspection spead, cost and quality. A new trend in industry aims at building a digital twin [1] for the production machine to enhance product quality, product marketing and to simplify preventive maintence and enhance future versions of the production machines.
Achieving the above goals requires efficient machine vision algorithms for better defect detection.
This paper introduces a highly efficient defect detection and localization approach which relies on a measure of image Perceptual Fidelity Aware Mean Squared Error (PAMSE) which is used uptil now for Image Quality Assessment [2]. To apply PAMSE in the area of defect detection and localization; a novel algorithm has be developed to ensure efficient performance. A neighborhood preserving scanning mechanism is used to guarantee detection of any defect and localize it. Comparative analysis of the proposed approach indicates the advantage of NP-PAMSE over single block based approaches.
Related work
Automated visual inspection utilizes machine vision techniques for inspecting defects of industry and has received interest for the last years, particularly for inspecting of textured surfaces [3]. Studies on quality control and inspection of texture have important theoretical and practical value. Therefore, many techniques of texture analysis arise in this aspect. Generally, texture analysis approaches can be classified into the following four categories dependent on the image processing techniques that are used [4]:
Statistical approaches
These approaches employ the gray-scale distributions of image regions to designate texture properties. Statistical approaches are valuable particularly in cases of textures from nature, for example wood and ceramic. Gray-level co-occurrence matrix [5] and local descriptor-based approaches are representative statistical texture analysis methods.
Structural approaches
These approaches are specifically appropriate for textures with clear structural features. Properties of primary texture are directly affected by the visual structure effect and the pattern of the texture. Generally, structural approaches are applied to textures with repetitive patterns like fabrics and bricks [4].
Model-based approaches
These approaches characterize patterns of texture by modeling special distributions or other features with specific models. For example Gao et al. [6] presented an algorithm for spatial-frequency feature extraction utilizing smooth Itakura-Saito non-negative matrix factorization. This algorithm displayed better performance. Analogous methodologies aren’t just related to certain models with greater flexibility.
Filter-based approaches
These approaches are effective in describing textures in a transformed domain utilizing spatial transformations, filters, or filter banks. These approaches are broadly applied for texture analysis, description of texture and texture inspection. Fourier analysis [7], Wavelet transformation [8], and Gabor transform [9] are frequently utilized in analyzing textures.
The Fourier analysis/transformation is the traditional approach for analyzing of textile fabrics. Though, this approach is employed together with other approached for definite issues [10]. For example Schneider and Merhof [11] showed an automatic approach for detecting twill and plain textile fabric defects by merging fuzzy clustering, investigation of Fourier transform and matching of template. This approach is able to handle weaves, supplies, random image rotations and densities with no need to previous knowledge about the fabric. The approach utilizes information resulting from Fourier spectrum of fabric and merge them with features of local periodicities to construct a diagram, in which the trajectory of single yarns within the fabric can be approximated that enables assessing accuracy of the weave analysis. The approach showed to be robust with detection accuracy of 97%. Another unsupervised approach is used for periodic pattern textile cloth inspection by combining wavelet shrinkage and the analysis of Fourier coefficients was presented in [12]. The main strong point of this approach is that it is unnecessary to use reference image.
Wavelet transform had more interest in the field of the detection of fabric defects due to its prefect local time–frequency features [8, 13]. Wavelet transform is alike to sub-band decomposition. Wavelet decomposition is achieved by a pyramidal algorithm that is used to compute wavelet coefficients. The two-dimensional (2D) wavelet transform is perceived as one-dimensional wavelet transform serially implemented with the vertical and horizontal axes [8].
Wavelet transform methods act good in outstanding edges defects, but unwell in flat surface defects with smooth gray-scale variances. In [14] an automated machine vision system is enhanced to inspect fabrics automatically and to automate the classification processes of the defects. The morphological operations, the two times thresholding binarization and transformation of wavelet coefficients are the base of the algorithm of detecting defects. The feed-forward neural network and the matrix of the gray level co-occurrence are the base for the approach of classifying the defects. Some types of commonly occurring defects were classified and detected, such as soiled yarn hole, lacking of wrap, lacking of weft and flowing of yarn. The detection accuracy of the fabric for the regions of the defect-free and the defectives was 93.4% and the accuracy of defect classification is 96.3%.
In [15], a novel automatic inspection system based on smart visual sensors is presented to detect defects on a warp knitting machine. It has the advantage of being of small size, low cost, and high reliability. An improved direct thresholding method based on a wavelet transform has been proposed to deal with the challenges. Satisfactory performance on the warp knitting machine has been achieved through a combination of both Wavelet Coefficients and a mathematical morphology filter. The detection rate is 98%.
Gabor filter is a linear filter utilized for analyzing textures. It is appropriate for emulating the biological properties of the eyes of human being and were applied in detecting defects in fabric. Many researches prove that Gabor filter has an ideal localization in two domains (frequency and space) through various dimensions and directions [3, 16–18].
Recently, with the advancement of learning technology, techniques which use deep neural networks are intensively used in the field of inspecting defects in industry. Renet et al. [19] presented a supervised convolutional neural network (CNN) architecture for classifying patching of image using transfer learning. So that pixel-wise prediction is achieved with the classifier that is trained over input images. This proposed model displays efficiency in inspecting and discovering defects of wood. Weimer et al. [20] and Park et al. [21] presented a novel deep CNN architecture, which obviously increase the accuracy of recognizing defects automatically. In Li et al. [22], a Fisher criterion-based stacked denoising autoencoder (AE) system is proposed for detecting defects of textile.
In [23], a comprehensive and systematic literature review of Fabric defect detection systems and methods has conducted a survey of fabric defect detection approaches. It has been found that these approaches are classified into seven categories: Structural, statistical, spectral, model-based, learning, hybrid and comparison. Deduction of the best approach depends on many factors such as the fabric database used, the nature of fabric, the lighting conditions, image resolution, features extracted, classifier used, parameters, etc. Therefore, it is not fair/not objective to conduct comparisons without a reference standard for comparison. Therefore, our future work will focus on finding a benchmark as a ground for fair comparison and the develop a digital twin for enhancing the textile industry based on an Industry 4.0 approach. The approach presented here is novel to the defect detection field and will contribute to the advancement of textile industry. We cannot claim it generality for all types of fabrics.
Neighborhood-preserving PAMSE model
The architecture of this model is presented in Fig. 1. The proposed model has two main components: the feature extractor which depends on the Perceptual Fidelity Aware Mean Squared Error (PAMSE) vector with eight neighborhoods and the Extreme Learning Machine (ELM) for defect classification.

Defect detection system architecture.
The proposed algorithm depends on computing the PAMSE among the sliding window and its eight-neighboring windows in a 3×3 neighborhood, as presented in Fig. 1.
The proposed algorithm depends on a sliding window, in this scenario a 3×3 blocks (Fig. 2) consisting of 16×16 pixels for each block. New nine blocks are created along with every move of the window.
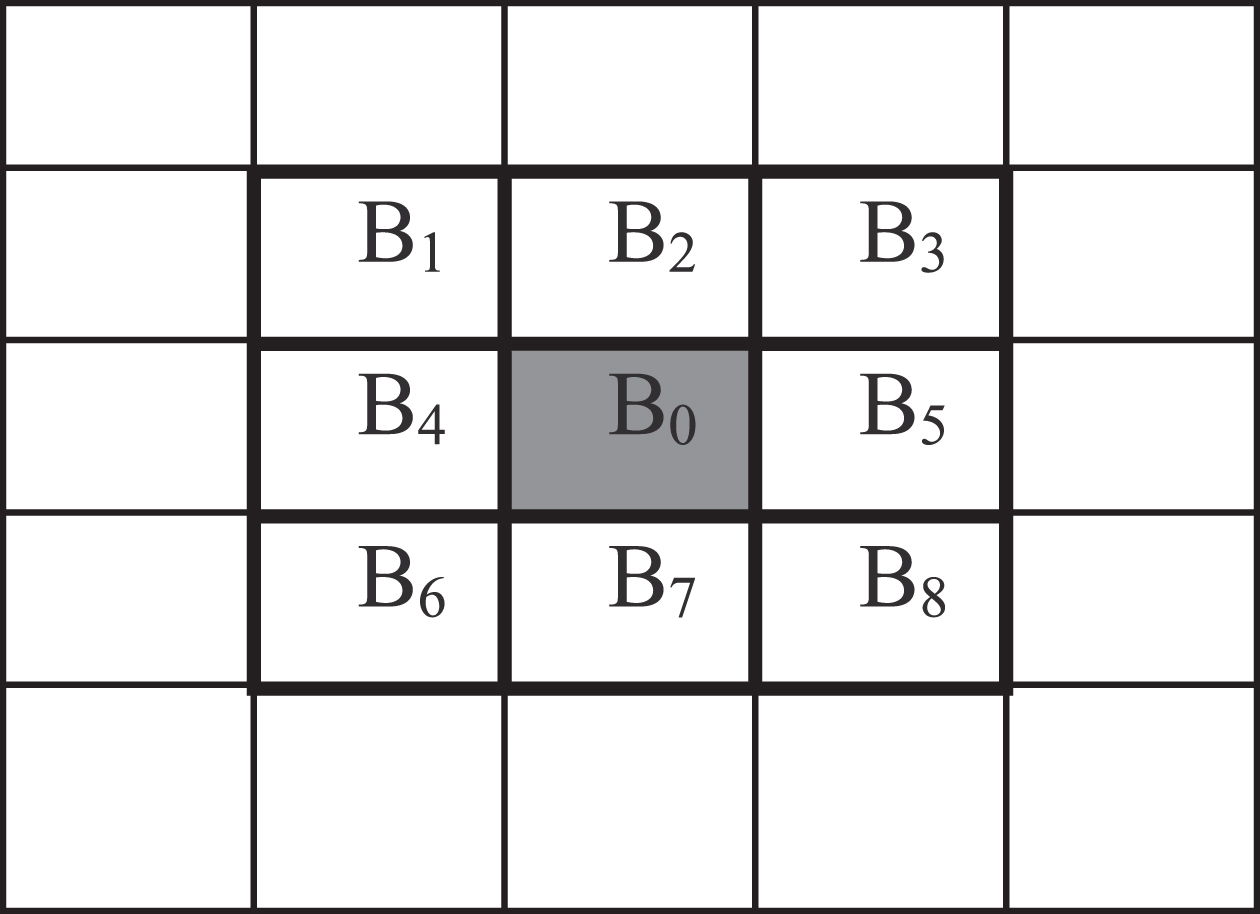
A single sliding window with 8 neighboring.
PAMSEs are computed among the block in the center and the eight neighbor blocks Pi = PAMSE (B0,Bi), where B0 is central block and Bi is the ith block, i = 1 ... .8. PAMSE results in a block quality assessment index (BQAI) by using certain structure extractors, through comparing a central block with its 8 neighbors after Gaussian smooth filtering, which is much simpler to calculate but achieves rather better IQA performance than SSIM. The PAMSE can have great potentials in defect detection applications.
In [2], PAMSE was proposed as a simple yet very effective framework, for image quality assessment (IQA). The difference –and Laplacian operators are used to extract the structure error, so that the MSE between Gaussian smoothed reference and distorted images, SMSE measure the Perceptual fidelity Aware MSE (PAMSE). PAMSE is very simple to implement, highly efficient, very effective, and is valid distance metrics and is among the best ones for Image Quality Assessment tasks, works much better than the well-known Structural Similarity Index.
ELM has a single hidden layer feed-forward neural network utilized in regression and classification. The ELM is able to adaptively set the hidden layer node number and arbitrarily allocate for input weights and hidden layer biases. The output layer weights are achieved via the least square process. The overall learning process is accomplished through a single pass without iteration.
ELM is an easily utilized single hidden layer feed-forward neural network, while conventional neural network learning algorithm (as Backpropagation algorithm) requires lots of training parameters, and lead to local optimum solution. Furthermore, ELM only requires setting the number of hidden layer nodes, and doesn’t require adjusting network input weights and hidden biases, and generates a unique optimum solution, with benefits of fast learning and generalization performance [24]. ELM overcomes slow training and over-fitting problems with the traditional neural network learning algorithm.
ELM is effective in numerous applications due to its superior abilities, robustness, and controllability and fast learning with more simplicity of its design [24]. Those advantages are more valuable for real-time applications, such as detecting defect.
ELM consist of three layers and the first layer nodes are utilized for feeding vector of input features into hidden layer. Both the size of the input layer and the feature set are the same. The input vector×contains the coefficients of PAMSE of the current block with its eight neighbors: X = {x1, x2, x3, … … , …, x8} which represent the eight BQAI’s. Figure 3 shows structure of Extreme Learning Machine.
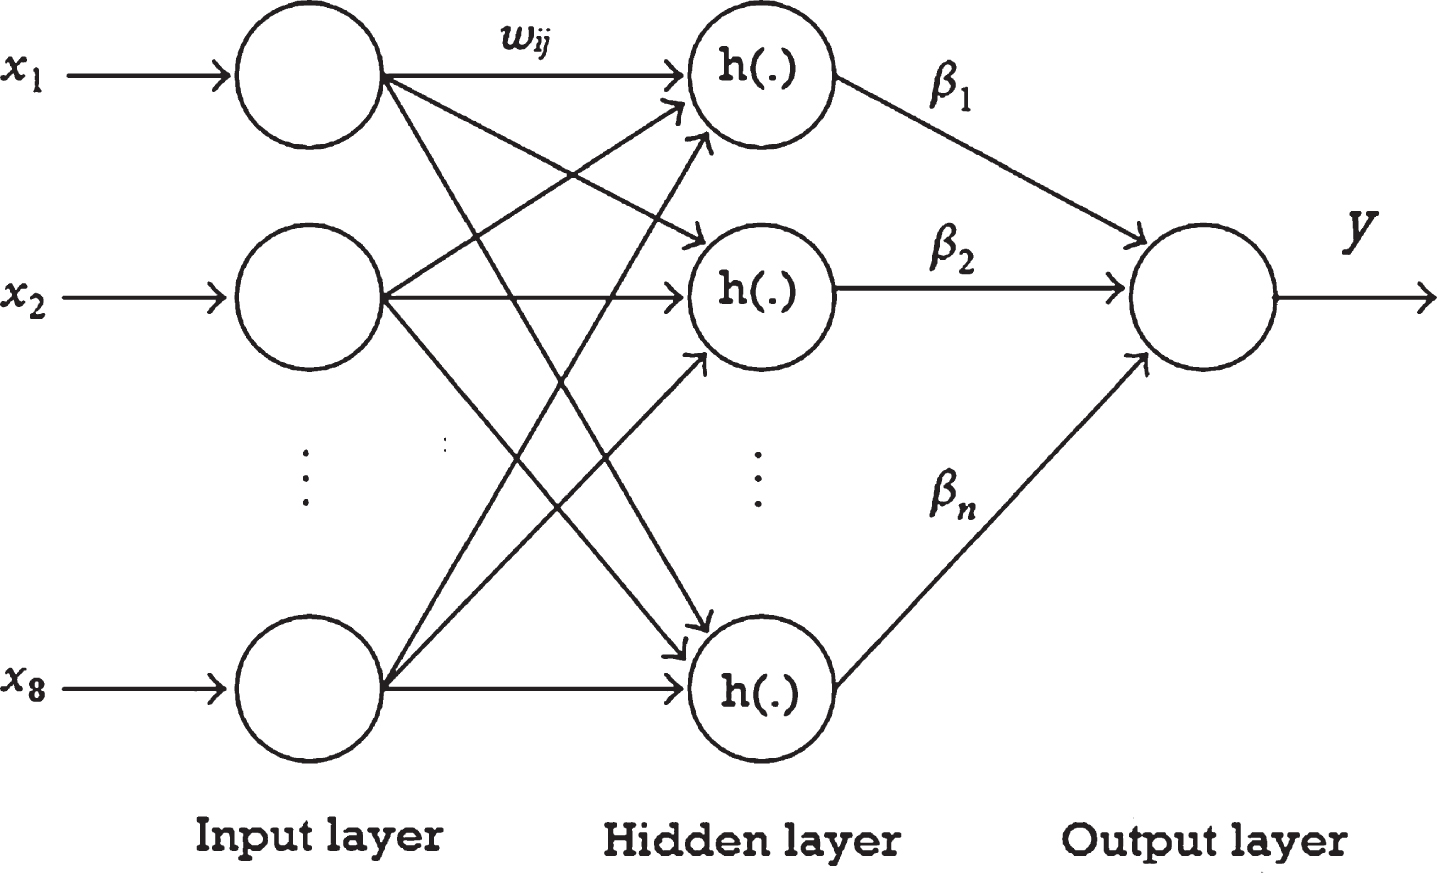
Structure of Extreme Learning Machine.
The output weights of ELM identify the value 1 for normal surface and the value 0 for abnormal
surface.
For C classes, the class labels are identified as y
k
∈ {1, 1 -} (1 ≤ k ≤ C). Therefore, a constructed row vector y = [y1, , , y
k
, , , , y
k
] designates the class to which a sample belongs for example, if y
k
= 1 and the other element in y are -1 then the sample belongs to kth class. Therefore, the training samples and matching labels are denoted as
Where, h(.) is a non-linear activation function,
The percentage of correct detection (PCD) is in general utilized in evaluating the performance of the presented approaches. Though, there is a variety of measures for assessing the classifiers performance such as:
All of the previously mentioned measures are normally stated as percentages. FN, FA. TA and TN terms mentioned in these equations are abbreviation of False Normal, False Abnormal, True Abnormal and True Normal respectively. By using the confusion matrix of detecting defects, these terms can be easily calculated [26].
Sokolova et al. [27] have reported that the measurement of accuracy doesn’t differentiate among the different classes correct labels number. The performance of classifiers for different classes are separately assessment by specificity and sensitivity. It has also been reported [27] that greater accuracy doesn’t guarantee the better performance of algorithm and the performance of algorithm gets an evaluation balance by giving the measures combinations. Discriminant Power (DP) given by Sokolova et al. [27] and Youden’sIndex, are used to assess the performance of the proposal model:
Youden’s Index evaluates the performance of classifiers to a better degree regarding the two classes. The abnormal positive class has a superior performance when the P + positive value is greater. The normal negative class has a superior performance when the P-negative value is greater. The Discriminant Power assesses how efficient a classifier distinguishes among the surfaces of abnormal and normal. The performance of classifier is weak if DP < 1, limited if DP < 2, fair if DP < 3, and efficient in other cases [27].
Database of TILDA
We made the experiments utilizing a big data set of fabrics textured images from the TILDA database [28] to assess the proposed model. The textile fabrics images were obtained in gray-scale with a resolution of 768×512 pixels (obtained from an image 1380 images with 16×16). Every sample space is scanned by the sliding window that has width (wv) and height (wh).The window size while scanning is wh×wv pixels. The image is being scanned by the window from the top-left corner until the bottom-right corner.
Table 7 gives a comparison of model performance for NP-PAMSE, neighborhood-maintaining minimum ratio (NMMR) [34], neighborhood-preserving cross-correlation coefficients (NP-CCFs) [29] and Log-Gabor (LG) [30].
Figure 4 shows the performance comparison of NP-PAMSE with different models Performed on a LENOVOG50-80 Laptop with an Intel(R) Core(TM) i3-4005UCPU@1.70 GHz(4CPUs) in a Matlab programming environment R2015a.
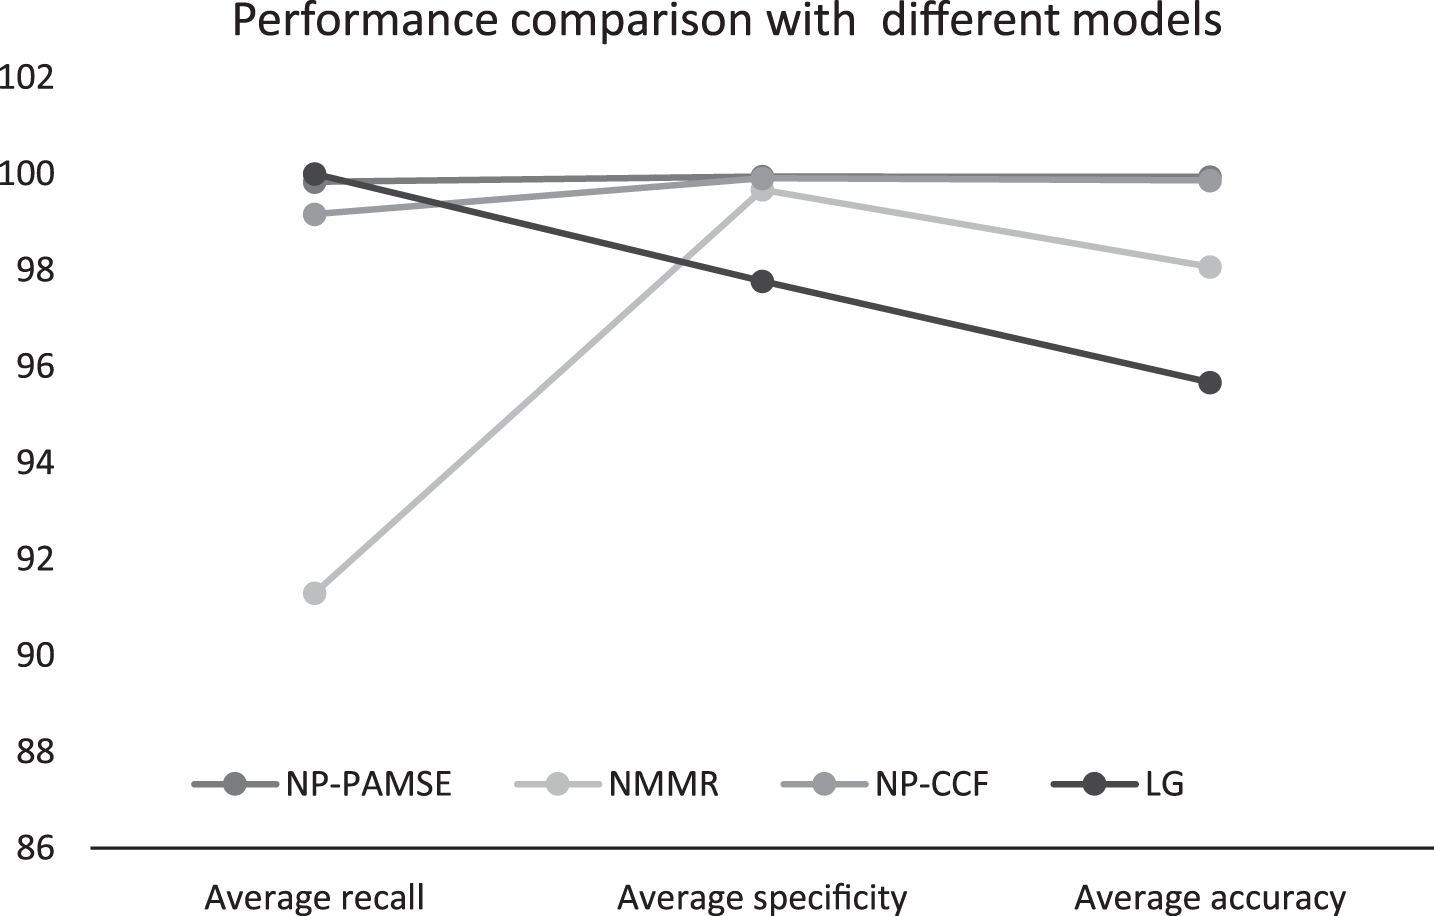
Performance comparison of NP-PAMSE with different models Performed on a LENOVO G50-80 Laptop with an Intel(R) Core(TM) i3-4005U CPU @ 1.70 GHz (4CPUs) in a Matlab programming environment R2015a.
Tables 8, 9 show the performance of PAMSE and NP-PAMSE for different patch size respectively. The patch size 16×16 in PAMSE gives the best performance results, but the better performance results for all patch size given within NP-PAMSE as shown in Table 10.
Figure 5 shows that the patch size 16×16 results in the best performance for the tested set of textile samples in PAMSE.
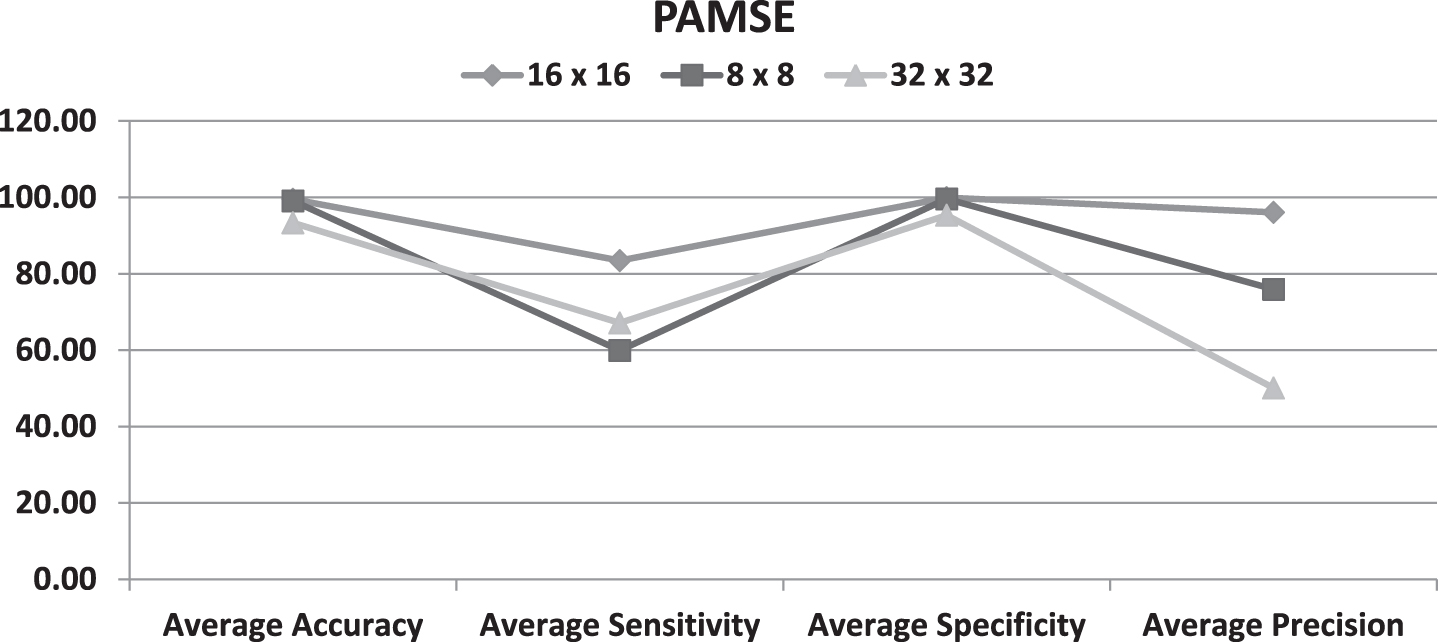
Effect of Patch Size on Defect Detection Performance for PAMSE.
Figure 6 shows that all patch size results in the best performance for the tested set of textile samples in PAMSE.
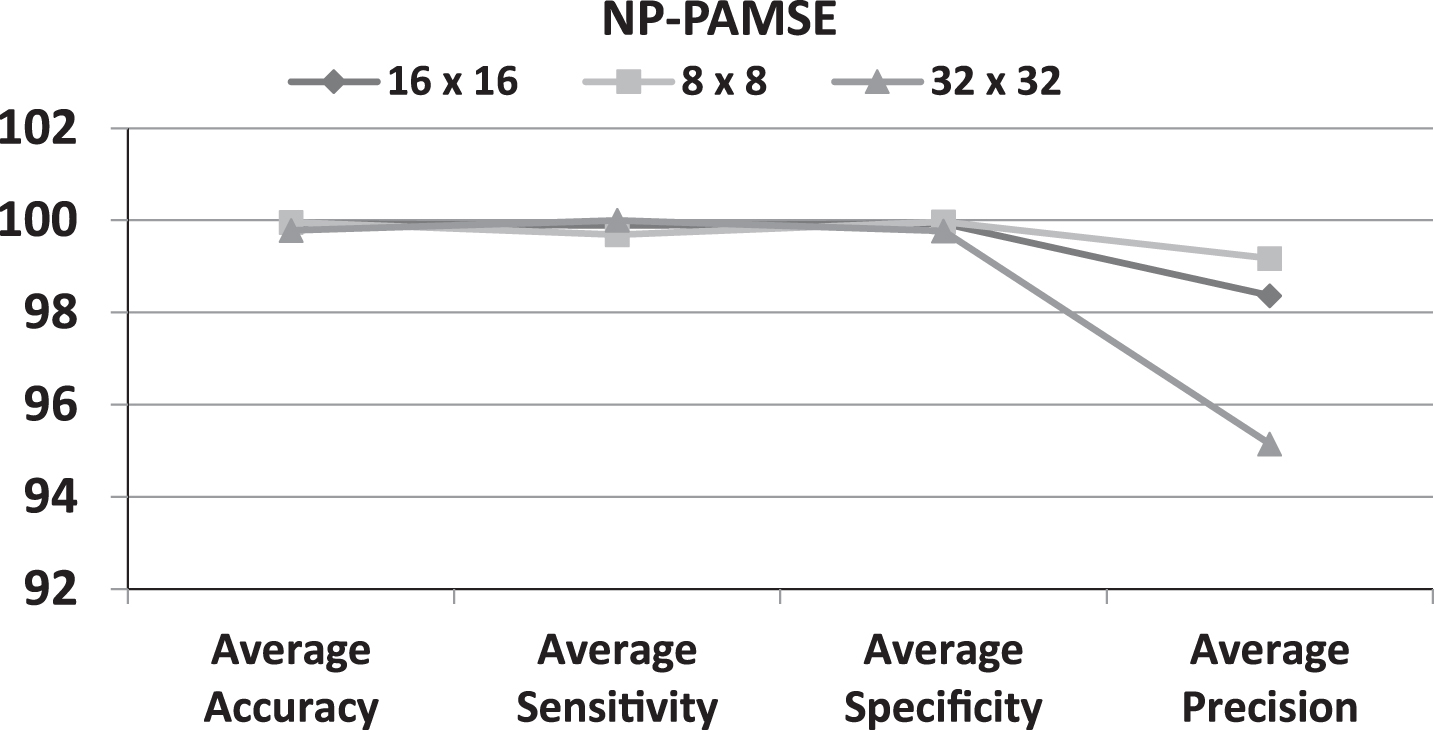
Effect of Patch Size on Defect Detection Performance for PAMSE.
Figures 7 and 8 shows the effect of block size on defect detection and localization for both PAMSE and NP-PAMSE.
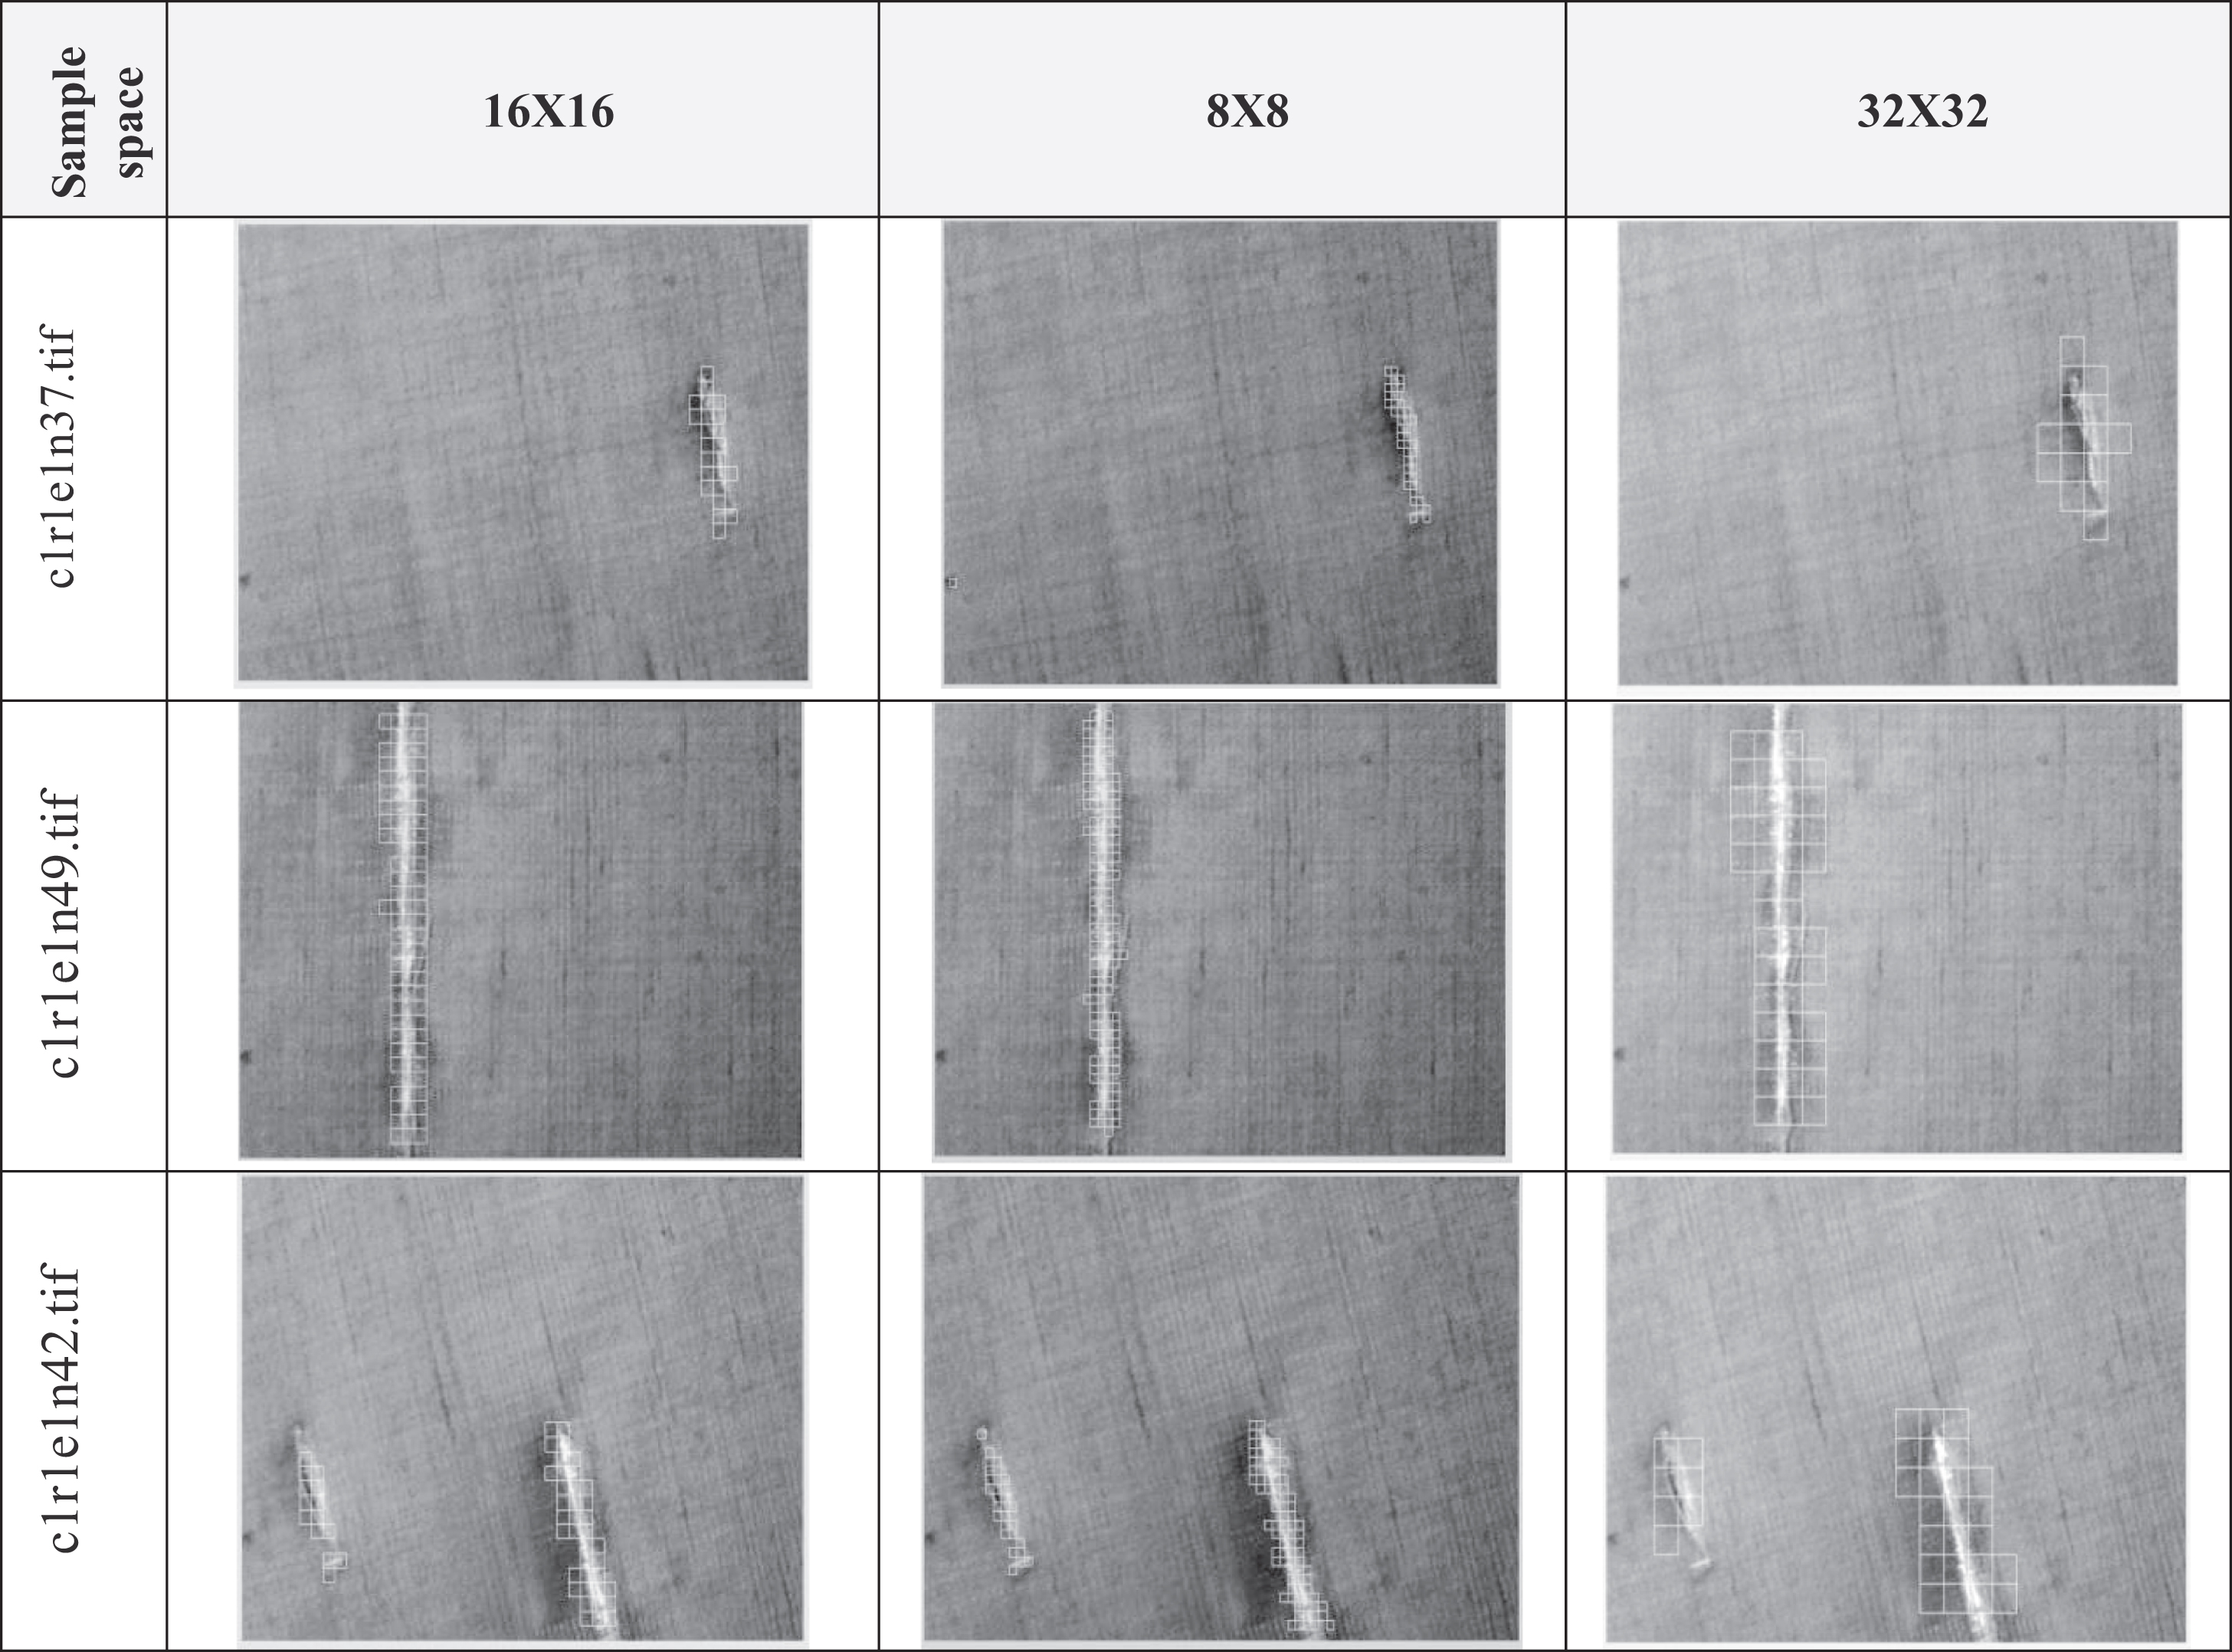
Effect of Patch Size on Defect Detection Performance in case of NP-PAMSE.

Effect of Patch Size on Defect Detection Performance in case of PAMSE.
Table 1 displays the results of 11 samples (images) from class 1 of TILDA database. The sign (e) in the sample space code shows the class of defect, from code 1 to code 7, the code is added as the following e1, e2...etc.,the codes are as the following (1: texture cuts and holes, 2: represents the stains, 3: represents the defects in structure, 4: represents foreign bodies, 5: represents the fabric folds, 6: represents the change in lighting conditions, 7: represents the affine distortions of the captured image) [26]. The images were obtained at gray level with a resolution of 768×512 pixels.
Results of detecting defects sample space of textile by NP-PAMSE & PAMSE-ELM
Results of detecting defects sample space of textile by NP-PAMSE & PAMSE-ELM

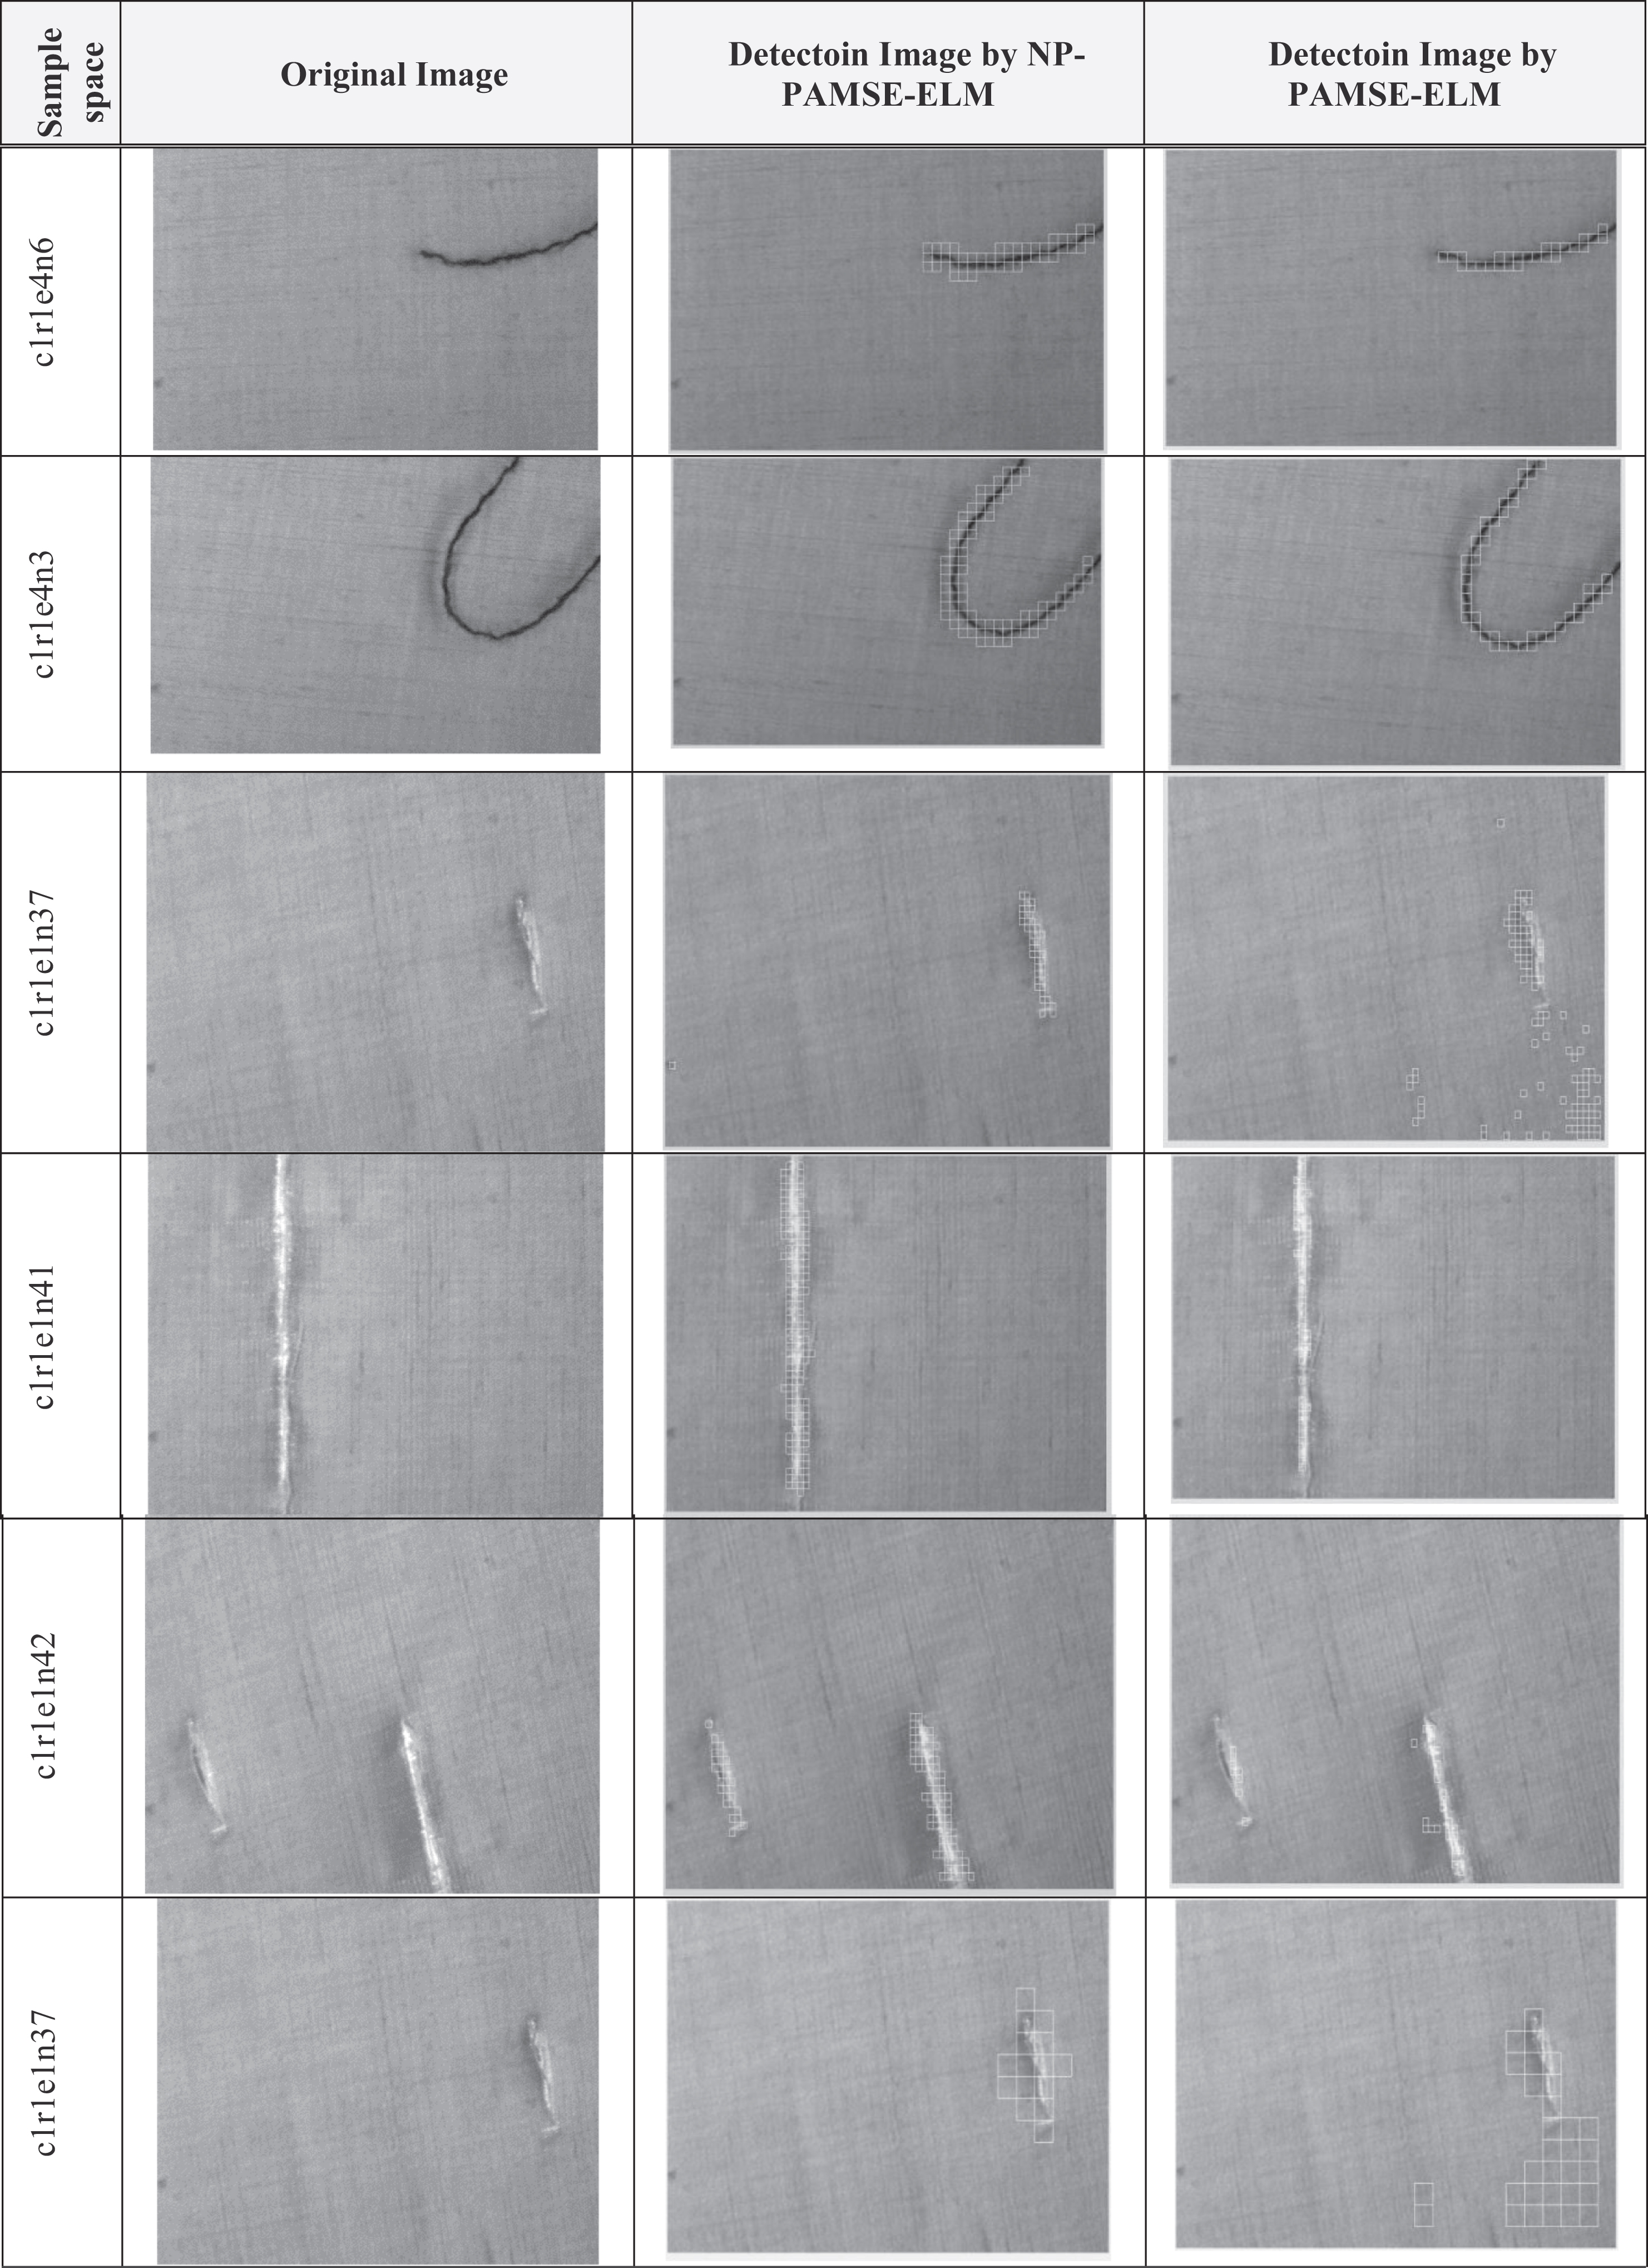
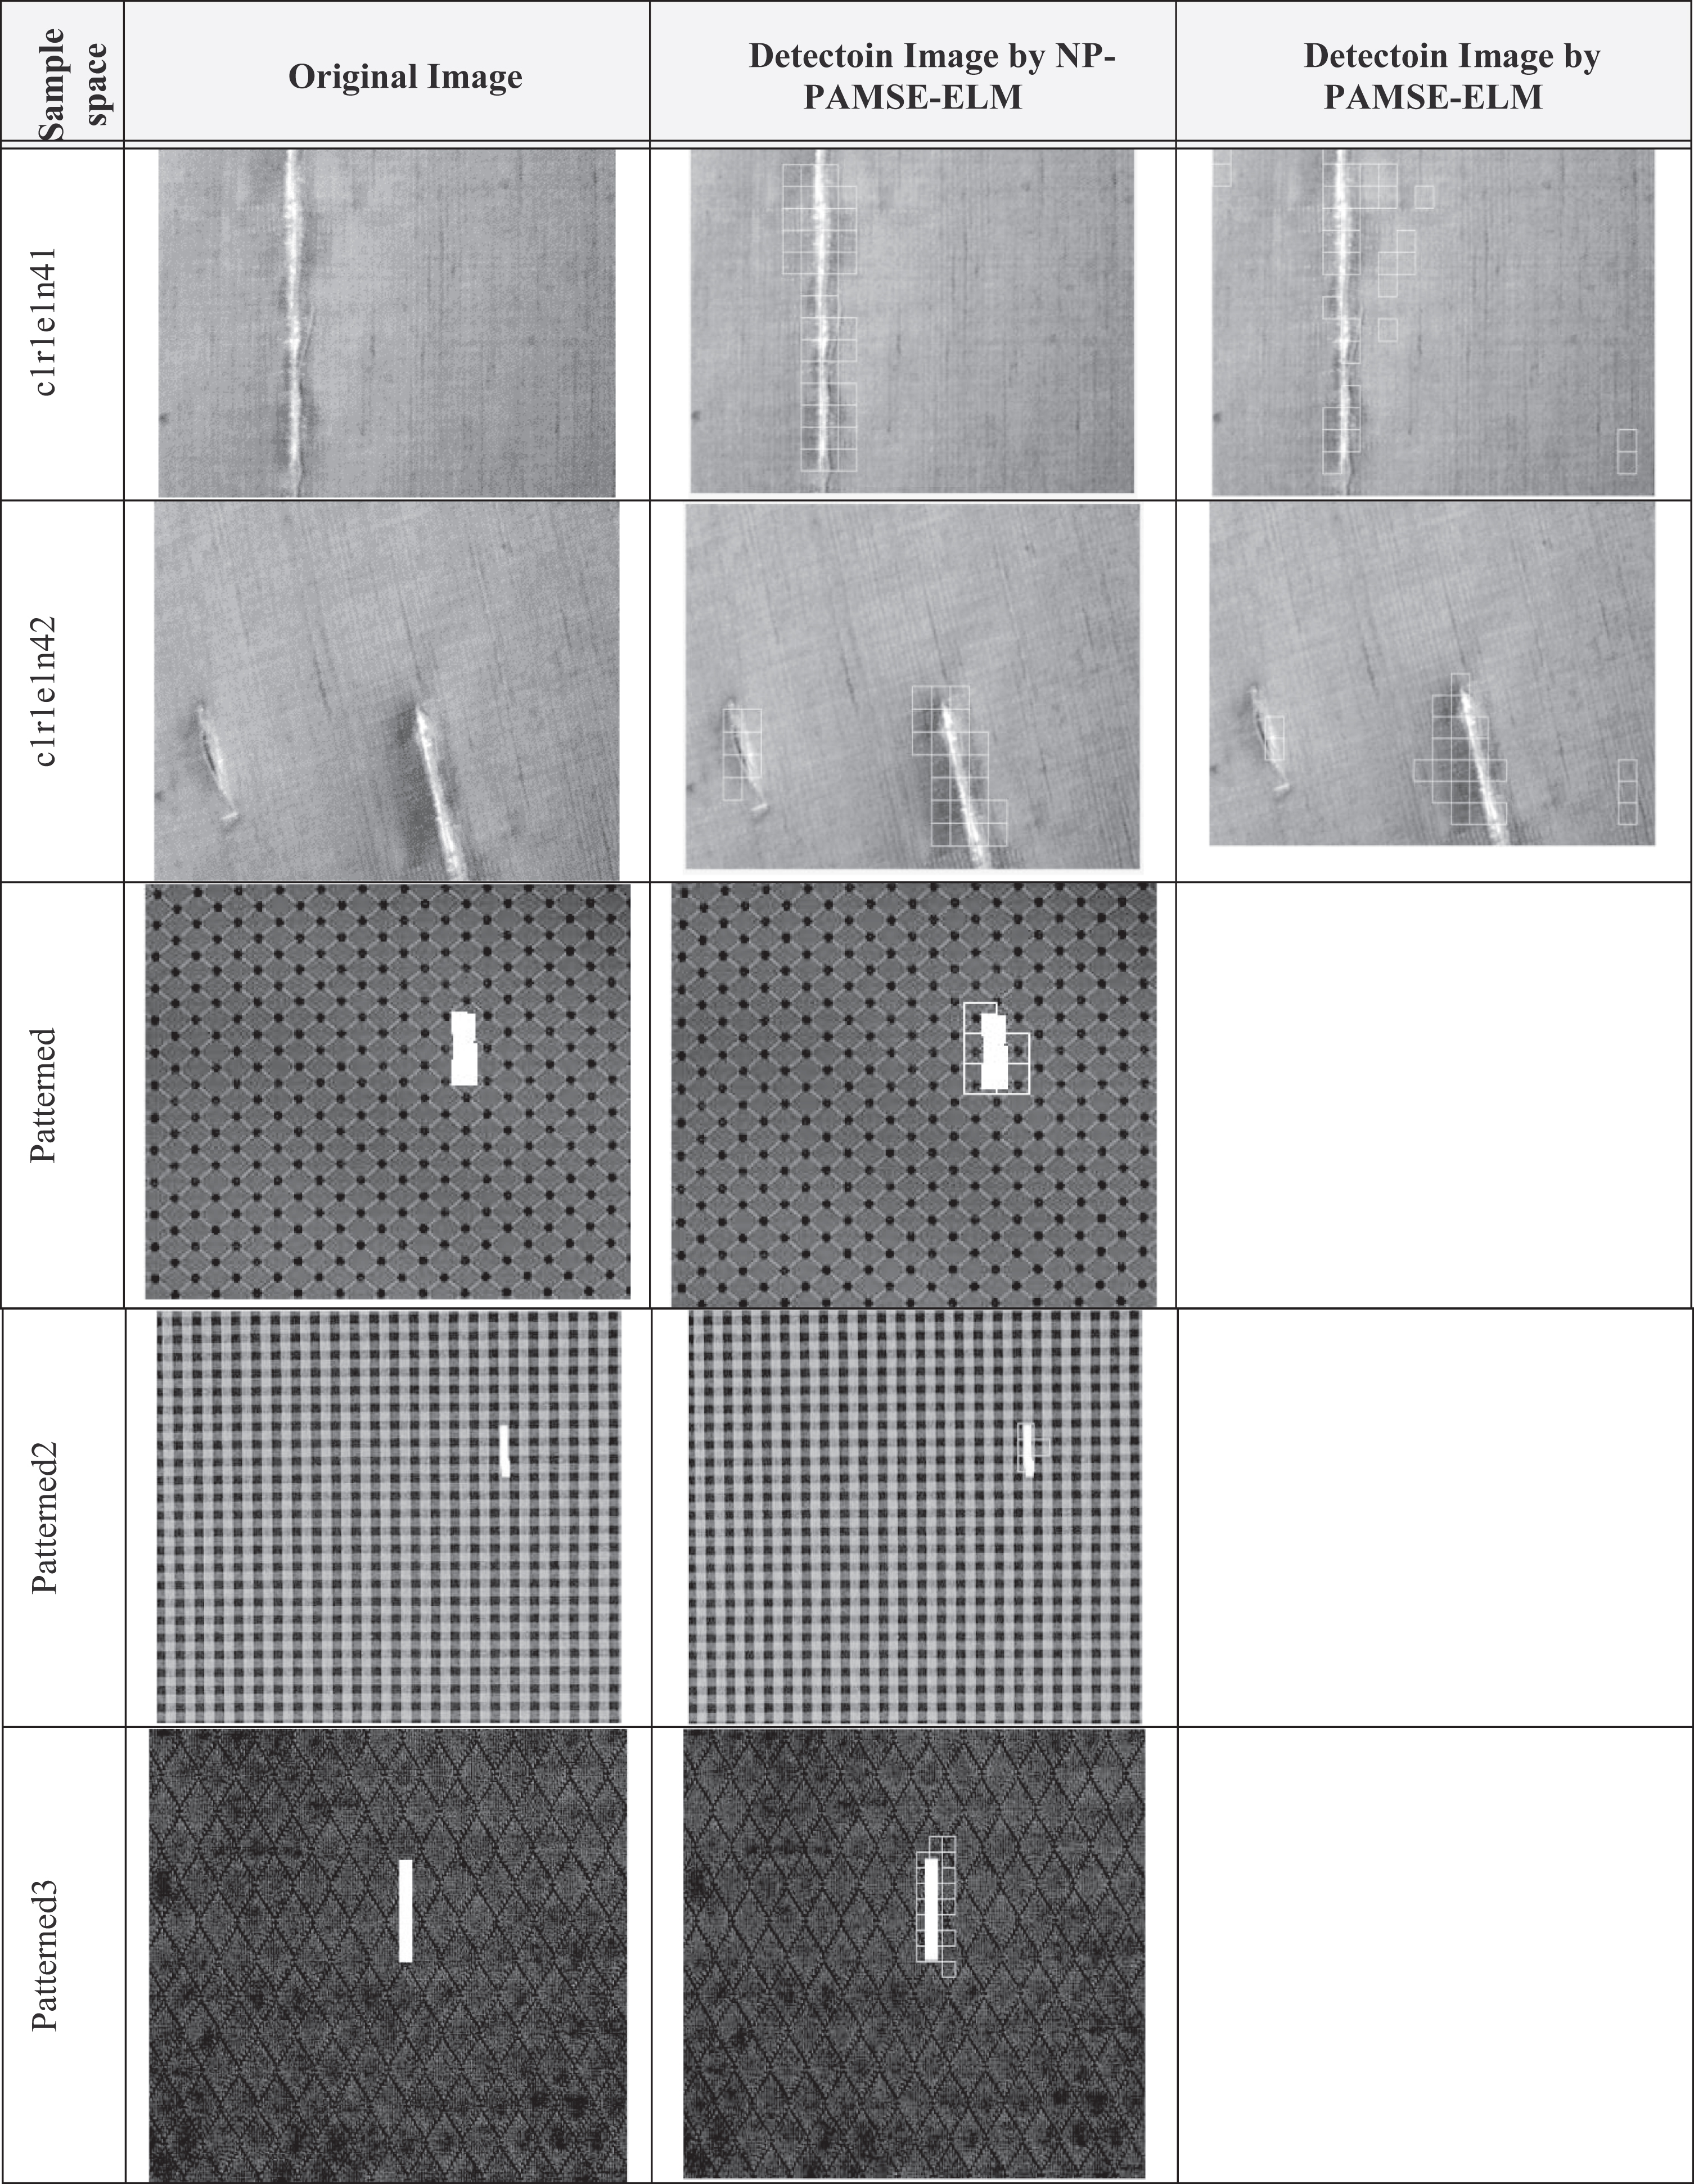
Tables 2, 3 show the performance of PAMSE and NP-PAMSE respectively, the performance of PAMSE was not efficient at some type of defects. The better performance is shown by NP-PAMSE as displayed in Table 4.
Performance indicators for PAMSE-ELM
Performance indicators for NP-PAMSE-ELM
Comparison of Performance Indicators for PAMSE-ELM &NP-PAMSE-ELM
Table 5 shows the comparison between system performance of NP-PAMSE using ELM and SVM. ELM shows the best and fast performance compared to the SVM classifier. The F1 score of ELM is 0.98, while SVM is 0.76.The average of training time for ELM is 0.088, while the SVM is 0.42.
Comparison between system performance of NP-PAMSE using ELM and SVM
Table 6 demonstrates the comparison between the proposed approaches and the recently published approaches, which are using the same standard database “TILDA”. The proposed system results indicate better performance than other approaches.
Comparison between our work and recently published works
Table 7 demonstrates comparison among the proposed NP-PAMSE model and other models based on log-Gabor (LG), neighborhood-preserving cross-correlation coefficients (NP-CCF) and neighborhood-maintaining minimum ratio (NMMR) [12, 34].This proposal model achieves higher speed than other models and similar performance. The running time of the NP-PAMSE detecting defects model is extremely fast compared to other models, because it has low computation complexity, and the training phase is done extremely fast by utilizing ELM to distinguish between the normal –and the defective surfaces.
Performance comparison of different models
Effect of Patch Size on Defect Detection Performance for PAMSE
Effect of Patch Size on Defect Detection Performance for NP-PAMSE
This paper, introduced a novel NP-PAMSE for automated defect detection in textiles. Perceptual Fidelity Aware Mean Squared Error approach is used for feature extraction and the Extreme Learning Machine (ELM) is used for classification. This model depends on computing of the PAMSE vector among the located block and its eight neighboring blocks in a 3×3 neighborhood window. The scanning window in this model helps to detect and localize defects accurately. The model’s detection performance has been analyzed depending on tests performed on a large set of textile fabric samples taken from TILDA database. ELM has been found to be very appropriate for detecting defects. In the NP-PAMSE model the accuracy of detecting defects has reached 99.86%, with recall/sensitivity 98.16% and specificity 99.90%. These results demonstrate that the NP-PAMSE model outperforms many existing defect detection techniques. The discriminant power demonstrates the efficiency of the ELM in distinguishing among normal- and abnormal surfaces. A major advantage of the NP-PAMSE is fast defect detection compared to recent published approaches.
Futere work
The proposed technique is fast and accurate in defect detection and localization, so in the future we will try to use it to construct a digital twin system for textile production.