
Abstract
This work aimed to develop a data glove for the real-time translation of Turkish sign language. In addition, a novel Fuzzy Logic Assisted ELM method (FLA-ELM) for hand gesture classification is proposed. In order to acquire motion information from the gloves, 12 flexibility sensors, two inertial sensors, and 10 Hall sensors were employed. The NVIDIA Jetson Nano, a small pocketable minicomputer, was used to run the recognition software. A total of 34 signal information was gathered from the sensors, and feature matrices were generated in the form of time series for each word. In addition, an algorithm based on Euclidean distance has been developed to detect end-points between adjacent words in a sentence. In addition to the proposed method, CNN and classical ANN methods, whose model was created by us, were used in sign language recognition experiments, and the results were compared. For each classified word, samples were collected from 25 different signers, and 3000 sample data were obtained for 120 words. Furthermore, the dataset’s size was reduced using PCA, and the results of the newly created datasets were compared to the reference results. In the performance tests, single words and three-word sentences were translated with an accuracy of up to 96.8% and a minimum 2.4 ms processing time.
Introduction
Hearing and speech-impaired people can communicate using sign language comprising certain hand, finger, wrist, and arm movements. Numerous studies on sign language recognition have been conducted in various languages. To truly assist deaf/mute people and create a sustainable system, the developed equipment should be used in real-time to convert translated words into sound. According to the literature, various types of cameras are primarily used for hand and body gesture recognition. However, in real-time use, these systems are limited by equipment transportation, installation, and environmental difficulties (light and weather conditions, for example). Data gloves are also used in sign language recognition studies. They are difficult to produce because they must be comfortable to wear, the majority of connections must be wireless, and sensors must be carefully placed. When the studies of both types were examined, it was observed that the majority of the studies only performed letter and number recognition, whereas word and sentence recognition studies were less frequent.
In this paper, a new fuzzy logic-assisted ELM-based classification method is proposed. The number of hidden layer neurons is dynamically adjusted with this method to minimize training errors. In the basic ELM, the number of neurons in the hidden layer does not change, and the output weights are calculated without iteration. The proposed method uses a technique similar to fuzzy logic control to iteratively update the hidden layer neuron numbers until the training error converges to zero. In addition, a data glove design and application that can produce fast and accurate results in the communication of deaf/mute people was developed. A total of 34 sensors for both hands were used in the design to increase the accuracy of the results. A total of 120 short and long words and their three-word sentences were classified using Fuzzy Logic Assisted Extreme Learning Machines (FLA-ELM), Convolutional Neural Networks (CNN), and classical Artificial Neural Network (ANN) techniques. A new end-point detection method has been developed to support sentence classification. Since the sensors were sewn from the inside, they did not prevent hand movements. In addition, the minicomputer system (NVIDIA Jetson Nano) that will process the collected data is pocket-sized, and all connections are wireless.
All studies can be classified as static or dynamic sign-based techniques. Static signs are simply movements made up of palm and finger movements combined. It consists of stationary hand and finger shapes with no time component. These approaches do not deal with hand and arm trajectories and usually express letters and numbers [1]. Image processing-based approaches or sensor data collected from data gloves are used to recognize these signs. Because of advancements in imaging technology, dynamic signal-based methods are preferred. In the dynamic sign-based approach, the data of hands’ starting and ending positions, hand trajectories, and finger movements are collected by cameras or sensors. These methods have been classified into two categories in the literature: image-based and sensor-based. In image-based techniques, single, stereo, and Kinect-style cameras [2] are employed. Colored gloves [3] and wristbands [4] were also utilized in some studies to improve the clarity of hand gestures. In sensor-based approaches, inertial sensors (Inertial Measurement Units-IMU), EMG, flex, electromagnetic, and radar-like sensors are used. Image-based techniques are classified into two types [5]: appearance-based [6] and model-based [7]. Feature extraction is one of the most important steps for improving appearance-based sign recognition performance. The image sequences’ features are extracted and compared to the referenced features. 2D or 3D models of hand gestures are created and compared with reference models in model-based methods. In [8], the authors developed a multi-scale contour-based 3D model for hand movements, including segmentation and sign recognition operations. Using correlation and mutual information methods for similarity measures in recognition procedures, they achieved success rates of up to 96.4 percent. In the study conducted in [9], transition-movement models (TMM) were used to determine the transitions between adjacent signs. After removing the transition parts, the signals were clustered using the improved k-means method for the remaining part, and a recognition success of 94.3% was obtained.
The most commonly used technique in sensor-based approaches is data gloves. In sign language recognition studies with data gloves, the twist and tilt angles of the fingers and the position and the trajectory of the hands during the movement should be determined. Unlike vision-based approaches, this technique allows for creating 3D motion modeling with depth information. In this technique, the signers must wear a glove with various sensors. Flex sensors are used to measure the twisting of the fingers and palm, while gyro meters and accelerometers are employed to detect hand and arms’ rotation and translation. In [10], the authors conducted a data glove study in which letters and numbers were attempted to be recognized in Pakistani sign language using flex, gyro, and accelerometers, with a success rate of 93.4 percent. In addition to vision-based and sensor-based research, studies have also been carried out to perform sign recognition by analyzing RF signals that hit the hands and return. 87.5 % accuracy was obtained in [11] using a single RF signal source. The Leap Motion Controller (LMC) plays a significant role in sensor-based techniques. The LMC is an optical and infrared sensor-equipped electronic device released by the Leap Motion Company in 2013. Human hand and finger motions can be measured at 200 fps using this equipment [12]. This device can generate temporal data, which is crucial for recognizing a hand gesture. In addition to sign language recognition, it is used in research fields including medical diagnostics, identification recognition [13], robotics, etc. [14]. When the literature is examined, it is discovered that LMC is widely employed in sign language recognition studies. It was employed with a meta-learning approach in [14] and ELM-based approaches in [15] for Turkish sign language recognition and with SVM in [16] for American sign language recognition.
There are two challenges in sign language recognition applications: environmental and methodical. The necessity of transporting the equipment (e.g., cameras, computer systems, and electronic equipment) to the installation location, extensive setup times, and measurement challenges are all environmental challenges in vision-based systems. Wearability and comfort problems are coming first in sensor-based systems. The most important methodological challenge in recognizing continuous hand gestures is that transitions between adjacent signs are difficult to detect due to their non-standard nature. In addition, hand gesture signals are not of the same size temporally, so they cannot be easily aligned with reference signals. They differ significantly from person to person temporally and spatially. This problem is known as end-point zone (EPZ) detection. When the literature is reviewed, it is discovered that much research is aimed at recognizing a single sign at a time; therefore, end-point localization is unnecessary [7,17,18, 7,17,18]. In some studies where EPZs were analyzed, a threshold value was calculated for repetitive signals, and signal segments below the threshold were accepted as end-points [19]. Models of repetitive transition movements were developed in [8], and end-point recognition was achieved by comparing them to real-time data. In [9], a transition movement model for transition movements was built and segmented using the k-means clustering algorithm.
The recognition phase follows the segmentation phase. Learning-based or vector-distance-based approaches can be applied to recognize static hand gestures. Classification of the collected data is performed using methods such as SVM [20], NN [6], ELM [14,15,21, 14,15,21], CNN [22], Recurrent Neural Networks (RNN) [23], and Euclidean Distance [24]. Dynamic hand gestures are more difficult to recognize because even the length of signal samples of the same word can vary from person to person. This challenge necessitates the use of time-domain alignment algorithms that are specifically designed for signal comparison purposes. Dynamic Time Warping (DTW) [25] and Hidden Markov Model (HMM) [26] are the most often utilized approaches for the time-domain alignment of dynamic gesture signals. Varying signal lengths in the temporal domain are also a problem for learning-based methods. Since equal-sized inputs are required when training neural networks, when the signal sizes differ, it is necessary to equalize the input sizes using techniques such as interpolation. Sentence recognition is also one of the challenging processes. End-points must be correctly identified in the transition from one word to the next for successful sentence recognition. Therefore, fewer studies have been conducted compared to studies on letter, number, and word recognition. The sections of this paper are as follows: In section 2, the structure of the data glove, data acquisition, and classification were discussed, and the results were analyzed in section 3.
Proposed methodology
The presented technique incorporates data gathering, feature extraction, and classification processes. These steps are described in detail in the subsections below.
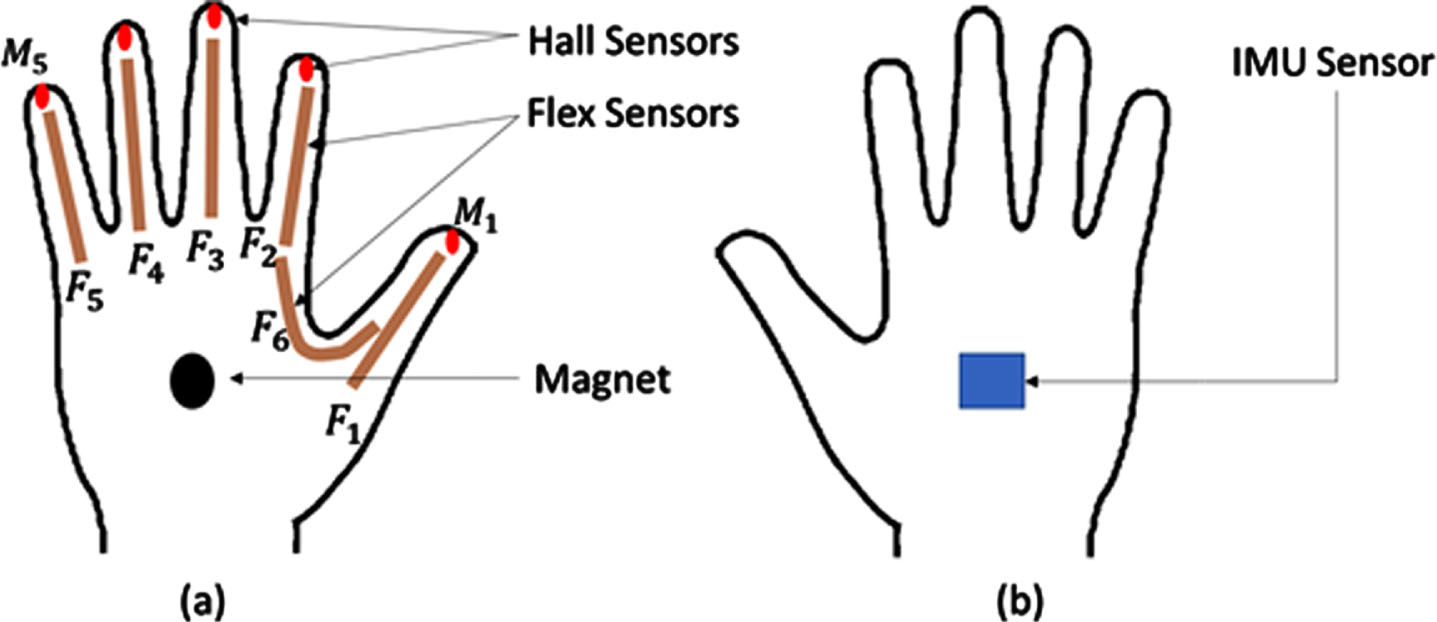
(a) Bottom view, (b) top view of right data glove.
As a result, the sensors to be employed in the glove and their placement are critical. Flex sensors were used to measure the amount of finger joint twisting. For each data glove, six were used. An additional flex sensor was used to detect if the thumb and index finger were adjacent. Hall sensors and magnets are used to detect signs touched on the palm with fingertips. Five hall sensors and one magnet were used for each data glove. The IMU (gyro and accelerometer) was employed to measure hand rotation angles and their trajectories during the movement. Each data glove has its own IMU sensor.
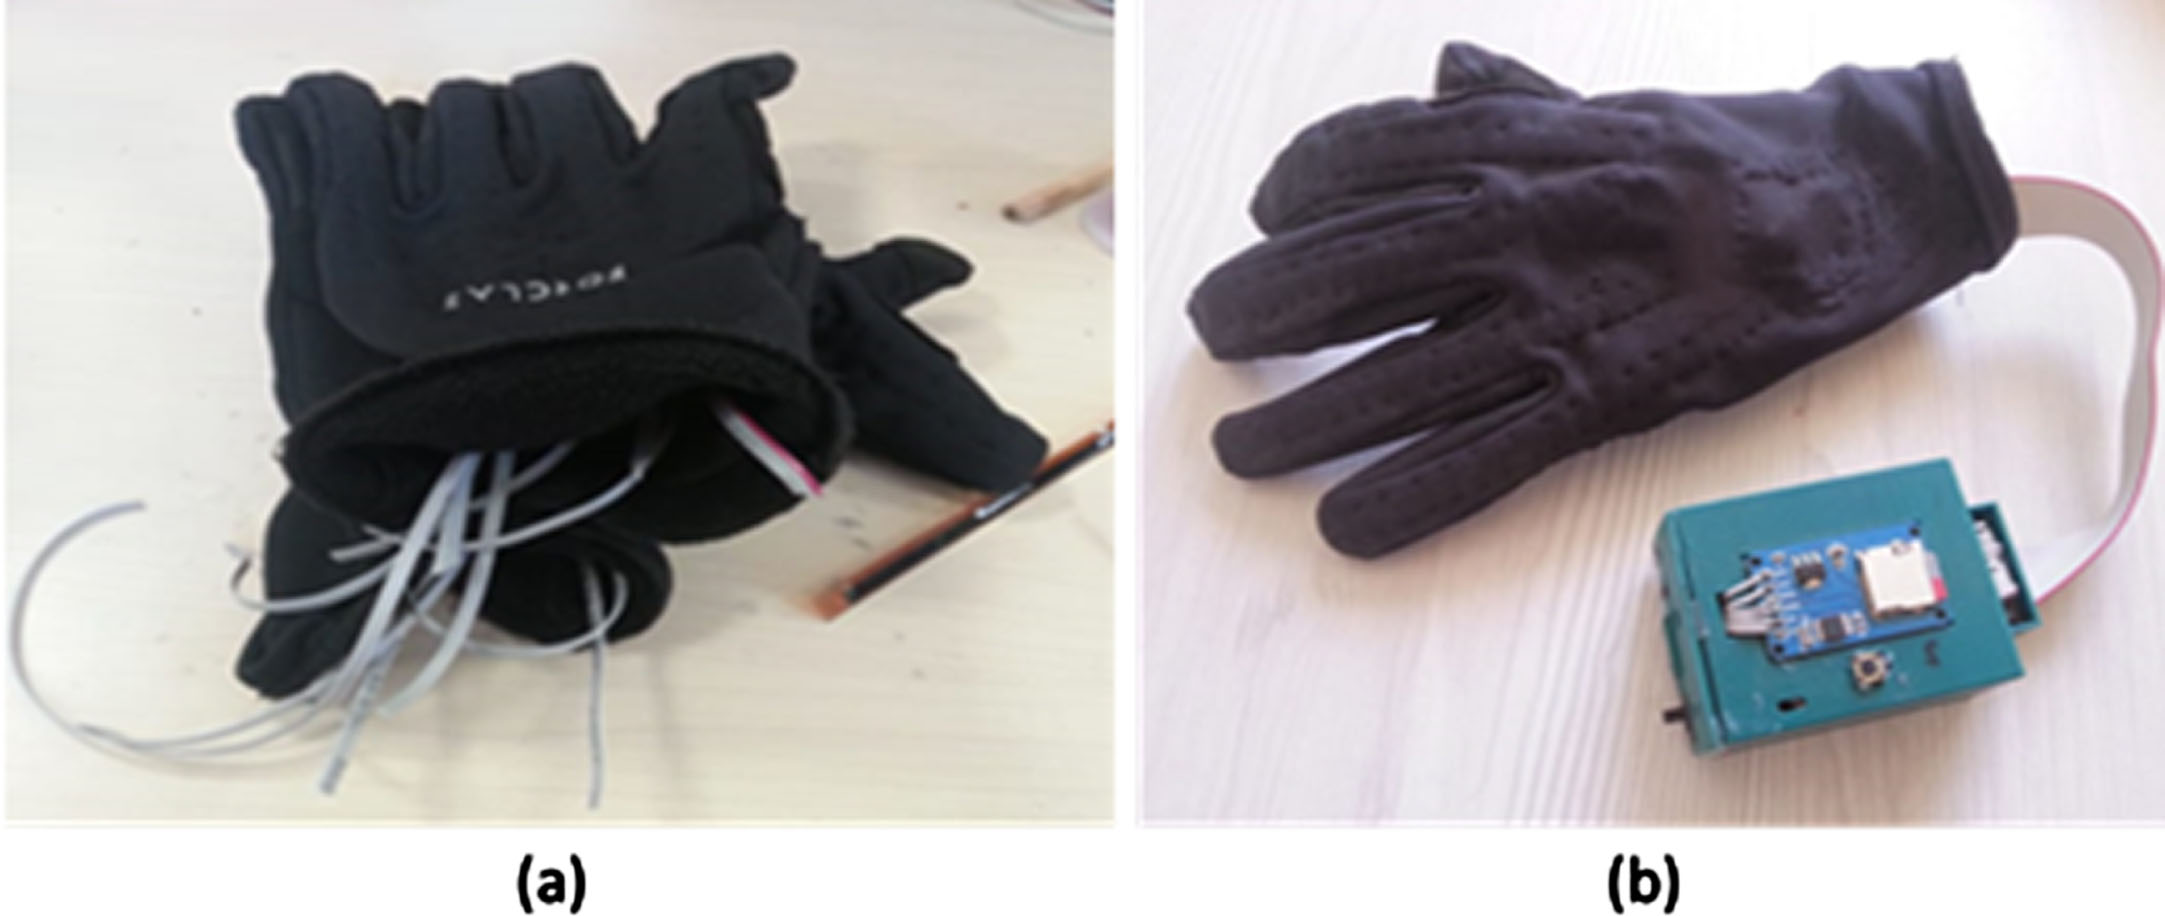
(a) Initial data glove, (b) final data glove with the hardware box.
However, it does not have enough pins to capture 17 analog signals from one hand. A 16-channel MUX was used to address this problem, and all signals were converted to digital. The 2.4 GHz Bluetooth module is used to send digital inputs to the minicomputer NVIDIA Jetson Nano. The right glove data is sent first, followed by the left glove data during data transmission. A printed circuit board (PCB) is produced for the equipment and placed in a box that can be worn on the wrist. Additionally, the predicted words are read out using the minicomputer’s speaker.
1- The data obtained per word was initially normalized for ANN-based classifiers. In order to equalize the input sizes, all input vectors were set to 1×1360 for each word by performing cubic interpolation [27]. Hand gesture signals are mostly a curve. Therefore, the data size can be increased or decreased by finding the intermediate values in the data array by cubic interpolation (3rd-degree polynomial). If we consider the equation of the signal as y = a0 + a1t + a2t2 + a3t3 at a given time interval, it is necessary to calculate the coefficients a0, a1, a2 and a3 to find the value of the signal at any time t
x
. If the values previously obtained at t1, t2, t3 and t4 are y1, y2, y3 and y4, the polynomial coefficients can be calculated as shown in Equations 1 and 2.
The polynomial coefficients can be computed, and the intermediate value at the time t x can be calculated by solving the equation. This guarantees that the hand gesture data sampled is always 34×40 (1×1360, reshaped).
When using CNN to classify words, the sensor data acquired for each word was converted into grayscale pixels, which were then used in the classification process. Although there are 34 columns of data in this set, the number of rows varies depending on how long the hand gesture takes. In the experiments using 150 words, it was determined that the average signal duration was 1.1 seconds, and the sensors could be sampled an average of 40 times during this period. For cases when the number of rows is different from 40, all of the data is scaled using bicubic interpolation [28] to a size of 40×34
It is essential to detect the transition between two adjacent signs in order to perform accurate classification in continuous sign language recognition. Therefore, a new approach for decomposing adjacent signs was developed in our research. At the end of a hand movement, the sensors’ signals remain stationary. A sudden change happens when the new word’s hand motion is initiated. According to our algorithm, the moment of this sudden change is the end-point of the first word. We computed the variance in successive sensor signals at transition points and referred to it as the variation index. We calculated a threshold value based on the average of the various indexes for all classified words as a result of the experiments. When the vectorial distance between consecutive sensor data from the right and left data gloves exceeds this threshold value, it is assumed that the first word’s hand movement has ended, i.e., the end-point has been detected. The following word’s sensor data starts to gather after this procedure. The calculation of the variation index is shown in Equations 3–6.
In this situation, all of the data obtained for a word is transferred as word data to the classification phase, and data gathering for the new word begins. Figure 3 depicts the image-transformed 3-word hand gestures data gathered from both hands’ sensors. The figure shows end-points, EPZs, single-word and three-word sentence data.

Image-transformed data of hand gestures of a 3-word sentence.
ELM is a machine learning method based on a feedforward neural network [29]. It consists of three layers: an input layer, a hidden layer, and an output layer. The ELM architecture used in the study is given in Fig. 4. ELM has the advantages of fast learning speed and better generalization performance over the traditional single hidden-layer feedforward neural network [30]. As a result, the ELM method has been widely applied in various fields. There is no need to adjust the training process because ELM generates the connection weights and neuron thresholds of the input layer and hidden layer randomly. The best solution can only be obtained by adjusting the number of neurons in the hidden layer [31]. It is a high-speed method because iteratively gradient-based backpropagation is not necessary. The Moore-Penrose generalized inverse is used to calculate its weights.

Designed FLA-ELM architecture.
In the above architecture, where L is the number of hidden layer neurons (3000 were used in the initial state), g () is the activation function (radial basis function was used in this study), w is the weight of the input layer, Word denotes the actual output of the network, Δ denotes the number of dynamically adjusted neurons, and b is the bias:
In short, we can write H . β = Word matrix. In this case, matrix H is the output matrix of the hidden layer, and it can be arranged as in Equation 8.
In the ELM algorithm, H is determined uniquely by the input weight and the hidden layer thresholds, chosen randomly before training and kept constant throughout. Thus, to solve the output weights given by Equation 9, the training of the ELM network can be converted into a linear system optimization problem. The output weights
Finally, β matrix can be calculated as shown in Equation 10.
The Moore-Penrose generalized inverse matrix of the output matrix H is denoted by H+ and T denotes the transpose of a matrix. To obtain the best solution using the ELM method, simply change the number of neurons in the hidden layer. However, random assignment of input weights occasionally results in deviations in β weights, reducing generalization ability. To avoid this situation, FLA-ELM was proposed in this study. In the FLA-ELM method, first, the number of initial neurons (L), the number of neurons to be added or removed (Δ), and the acceptable error range (ER) are assigned. In the basic ELM method, calculating the β weights only once are sufficient. In FLA-ELM, the number of neurons in the hidden layer is dynamically changed. The number of neurons is adjusted based on the error (ɛ) and the derivative of the error (dɛ) value. The error is the absolute sum of the differences between the desired
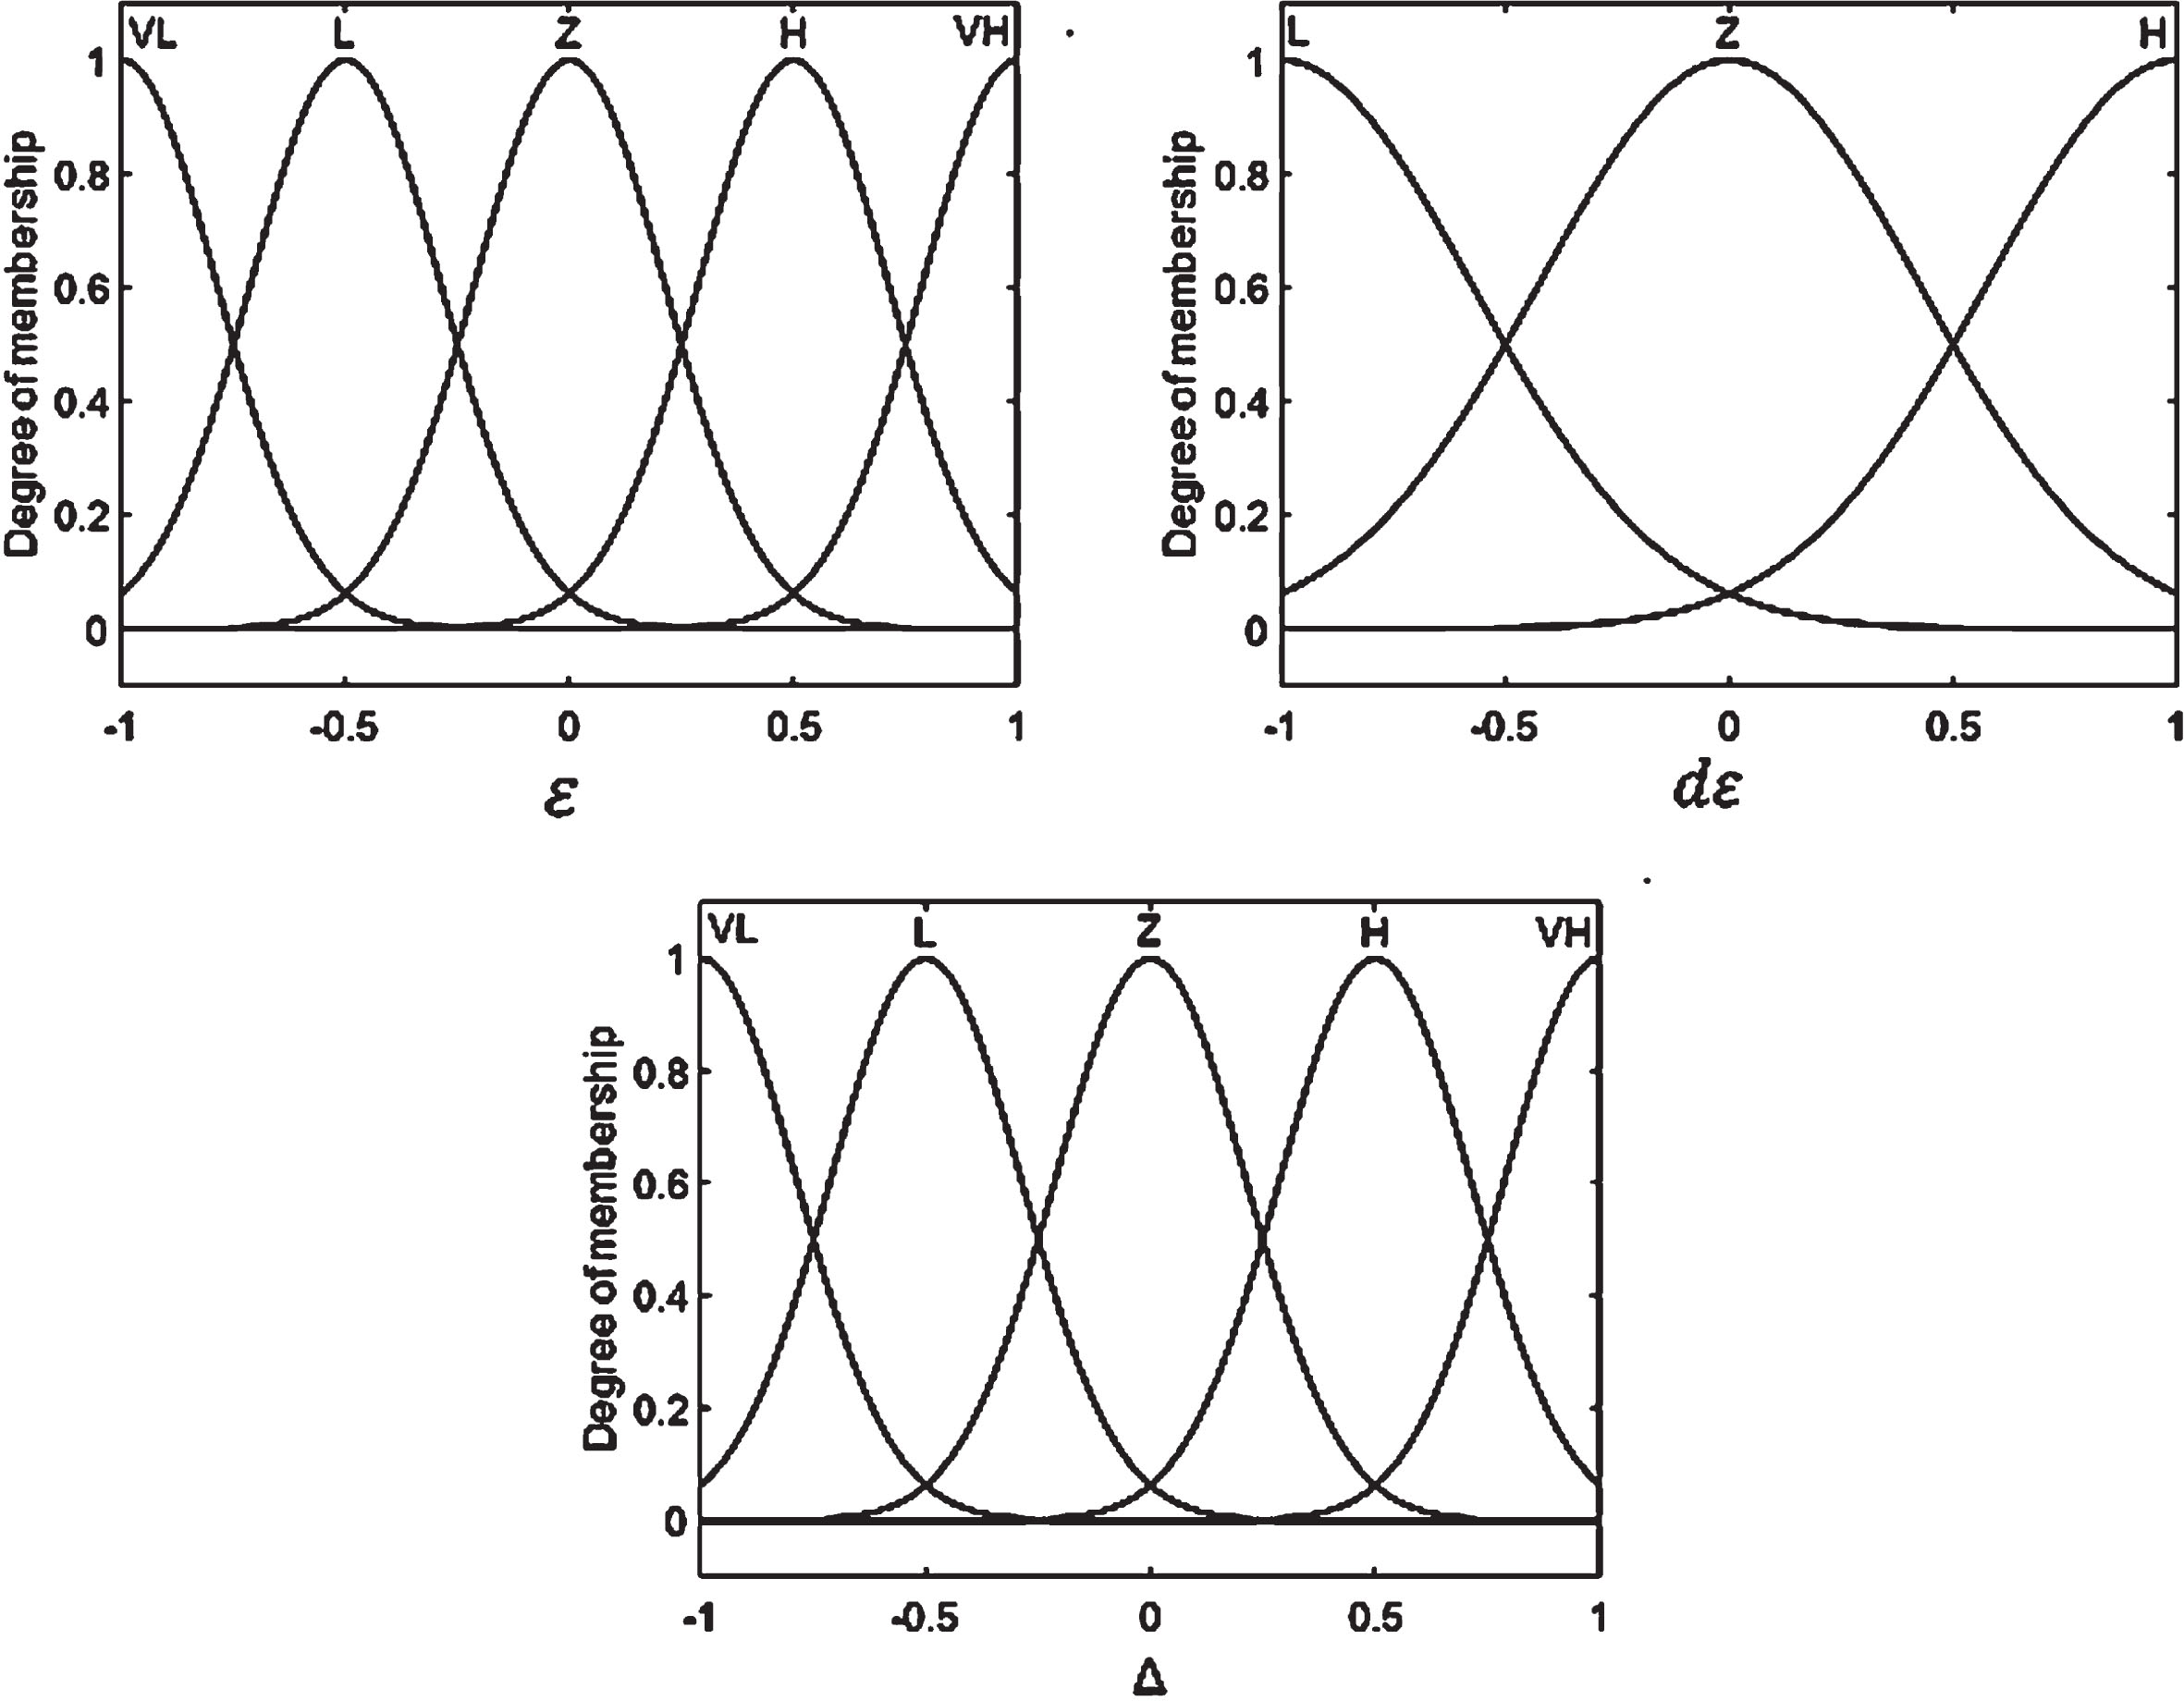
Fuzzy sets configuration.
In this system, For ɛ and Δ, 5 Gaussian membership functions were used, and 3 for dɛ. For implication and aggregation, prod() and sum() functions were selected, respectively. Two of the 25 rules prepared to generate the output are shown below as examples. IF ɛ is NH and dɛ is PH, THEN Δ is Z IF ɛ is PL and dɛ is NH, THEN Δ is NL
In Fig. 4 it is represented by the cluster labels NH: Negative High, NL: Negative Low, Z: Zero, PL: Positive Low, and PH: Positive High. To reduce ɛ, this method iteratively repeats the β weight calculation by adding or removing Δ neurons from the hidden layer. When the ɛ falls within the ER range, the optimization is over. The FIS system was integrated into the main system using a lookup table. The simplified algorithm of the method is given in Fig. 6.
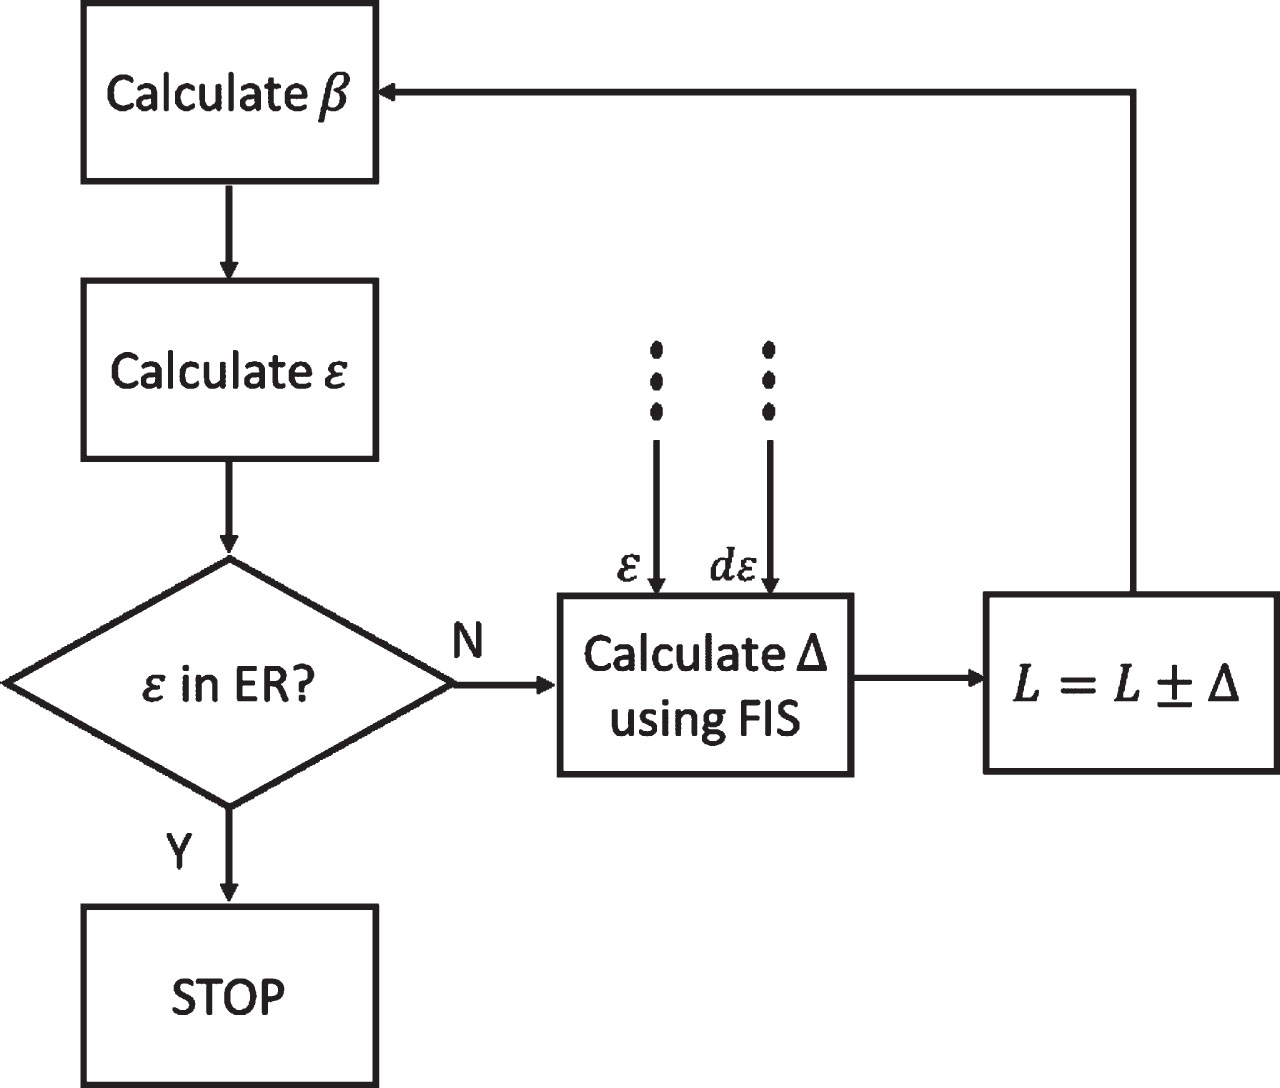
The algorithm used to dynamically change the sizes of the hidden layer.
CNN is a class of deep learning. It emerged with the development of multi-layer perceptron (MLP) architecture. The difference between the two networks is several variations in CNN’s layer architecture, such as Convolution Layer, Pooling Layer, and Fully Connected Layer. In summary, CNNs consist of multiple trainable segments placed one after another. The training procedure in CNN begins with applying input data and continues with calculating weights layer by layer. The outputs of the fully connected layer are compared to the desired outputs, and the calculated error is propagated to all weights using a backpropagation algorithm. The weights are updated after each iteration to minimize the error. The input data for CNNs can be any signal, including image, audio, or video. CNN is a fundamental image classification method. It has become increasingly popular in recent years as the speed and capacity of computer systems have increased significantly. The convolution process extracts the features of the entire picture using square matrices called filters. The quantity and quality of these filters are critical. Because the accuracy of the object recognition process largely depends on selecting appropriate features. Features are numerical data that carry information about an image. An image has various pixel structures, including edges, corners, gradients, and shapes. Filters highlight these structures and enable the differentiation of images. The greater the filter sizes and numbers, the more detail may be recovered from the image, but the computational cost must be considered. A CNN requires a huge number of labeled data for training, and the learning process is extremely time-consuming. With all this, CNN can recognize one object in a single image but cannot detect multiple objects in a single image. In this study, word data was normalized and transformed into images. Sensor data were recorded as positive or negative decimal numbers. After the sensor data is gathered and converted into word data, it is normalized and then converted into an 8-bit unsigned integer (uint8) format. Thus, each 34×40 word data is converted into pixels consisting of various gray levels, and CNN was used to recognize it.
ANN based classification
ANN is a type of information processing system similar to biological neural networks. The ANN was trained using supervised learning methods. The more correctly selected and decoded inputs in supervised learning, the more influential the relationship between outputs and inputs [32]. The ANN was composed of the following components: neurons that provide information flow, the connection model between different neuron layers, the weight of the connections, and the activation function. The word data obtained for a hand gesture was standardized as a 40×34 matrix and reshaped to 1360×1 to become an ANN input. This ANN is an MLP network with two hidden layers consisting of 10 neurons. Levenberg-Marquardt and Scaled Conjugate Gradient methods were used as backpropagation algorithms. The Levenberg-Marquardt method was chosen because it produces significantly better performance and processing speed results. In the network, the training rate is 0.01, hyperbolic tangent () is used as the transfer function of the input and hidden layers, purelin () function is used as the output layer transfer function and mean squared error (mse) is used as the loss function.
Experimental results
In this study, FLA-ELM, ANN, and CNN networks were used to classify 120 of the most often-used words in Turkish sign language. Fifty signers were divided into two groups of 25 to gather sign samples, and each group member was requested to gesture 60 different words. As a result of sampling 25 samples from 120 different words, a total of 3000 sample data was obtained. 80% of the samples were used for training ANN and CNN, 10% for validation, and 10% for testing. The selected 120 words are divided into two subgroups short-term signs and long-term signs. For example, since the hand movement time of the word “you” is about 0.2 seconds, it is included in the group of short-term signs. However, since the hand movement time of the word “friend” is about 0.9 seconds, it is included in the group of long-term words. The threshold value between long and short-term signals was determined as 0.5 s. Thus, short and long-term signals could be evaluated separately in performance tests. As mentioned before, the word data of short and long-term signals are fixed to 34×40 dimensions. Therefore, in terms of data size, the signs in both groups are equal to each other. Hand movement times were obtained by averaging the signers’ timings. 3-word sentences are groups of words selected from a sample pool of 120 words, ordered consecutively without any meaning. They were categorized as short and long sentences. Short sentences consist of three short words and long sentences consist of three long words. They were used to measure the ability of the proposed method for consecutive recognition and end-point detection. Some sample words and sentences are given in Table 1.
A few sample words and sentences
A few sample words and sentences
3-word sentences were classified after they were converted to three single words as a result of end-point detection. Therefore, no particular classification model for three-word sentences has been developed. The primary problem here is detecting the end points accurately and capturing the consecutive word. Some experimental studies have been conducted to observe whether the hand gesture signals produced by different signers for the same words can be generalized. The input’s power spectral densities (PSDs) were computed in these experiments to observe how the hand gesture signals for identical words varied with different signers. PSD indicates the frequency ranges in which time-series signals are more prominent than at other frequencies. Figure 7 shows the PSD graphics of the words “Go”, “Nice”, “Home”, “Father”, “Mother” and “Friend” performed by three different signers.
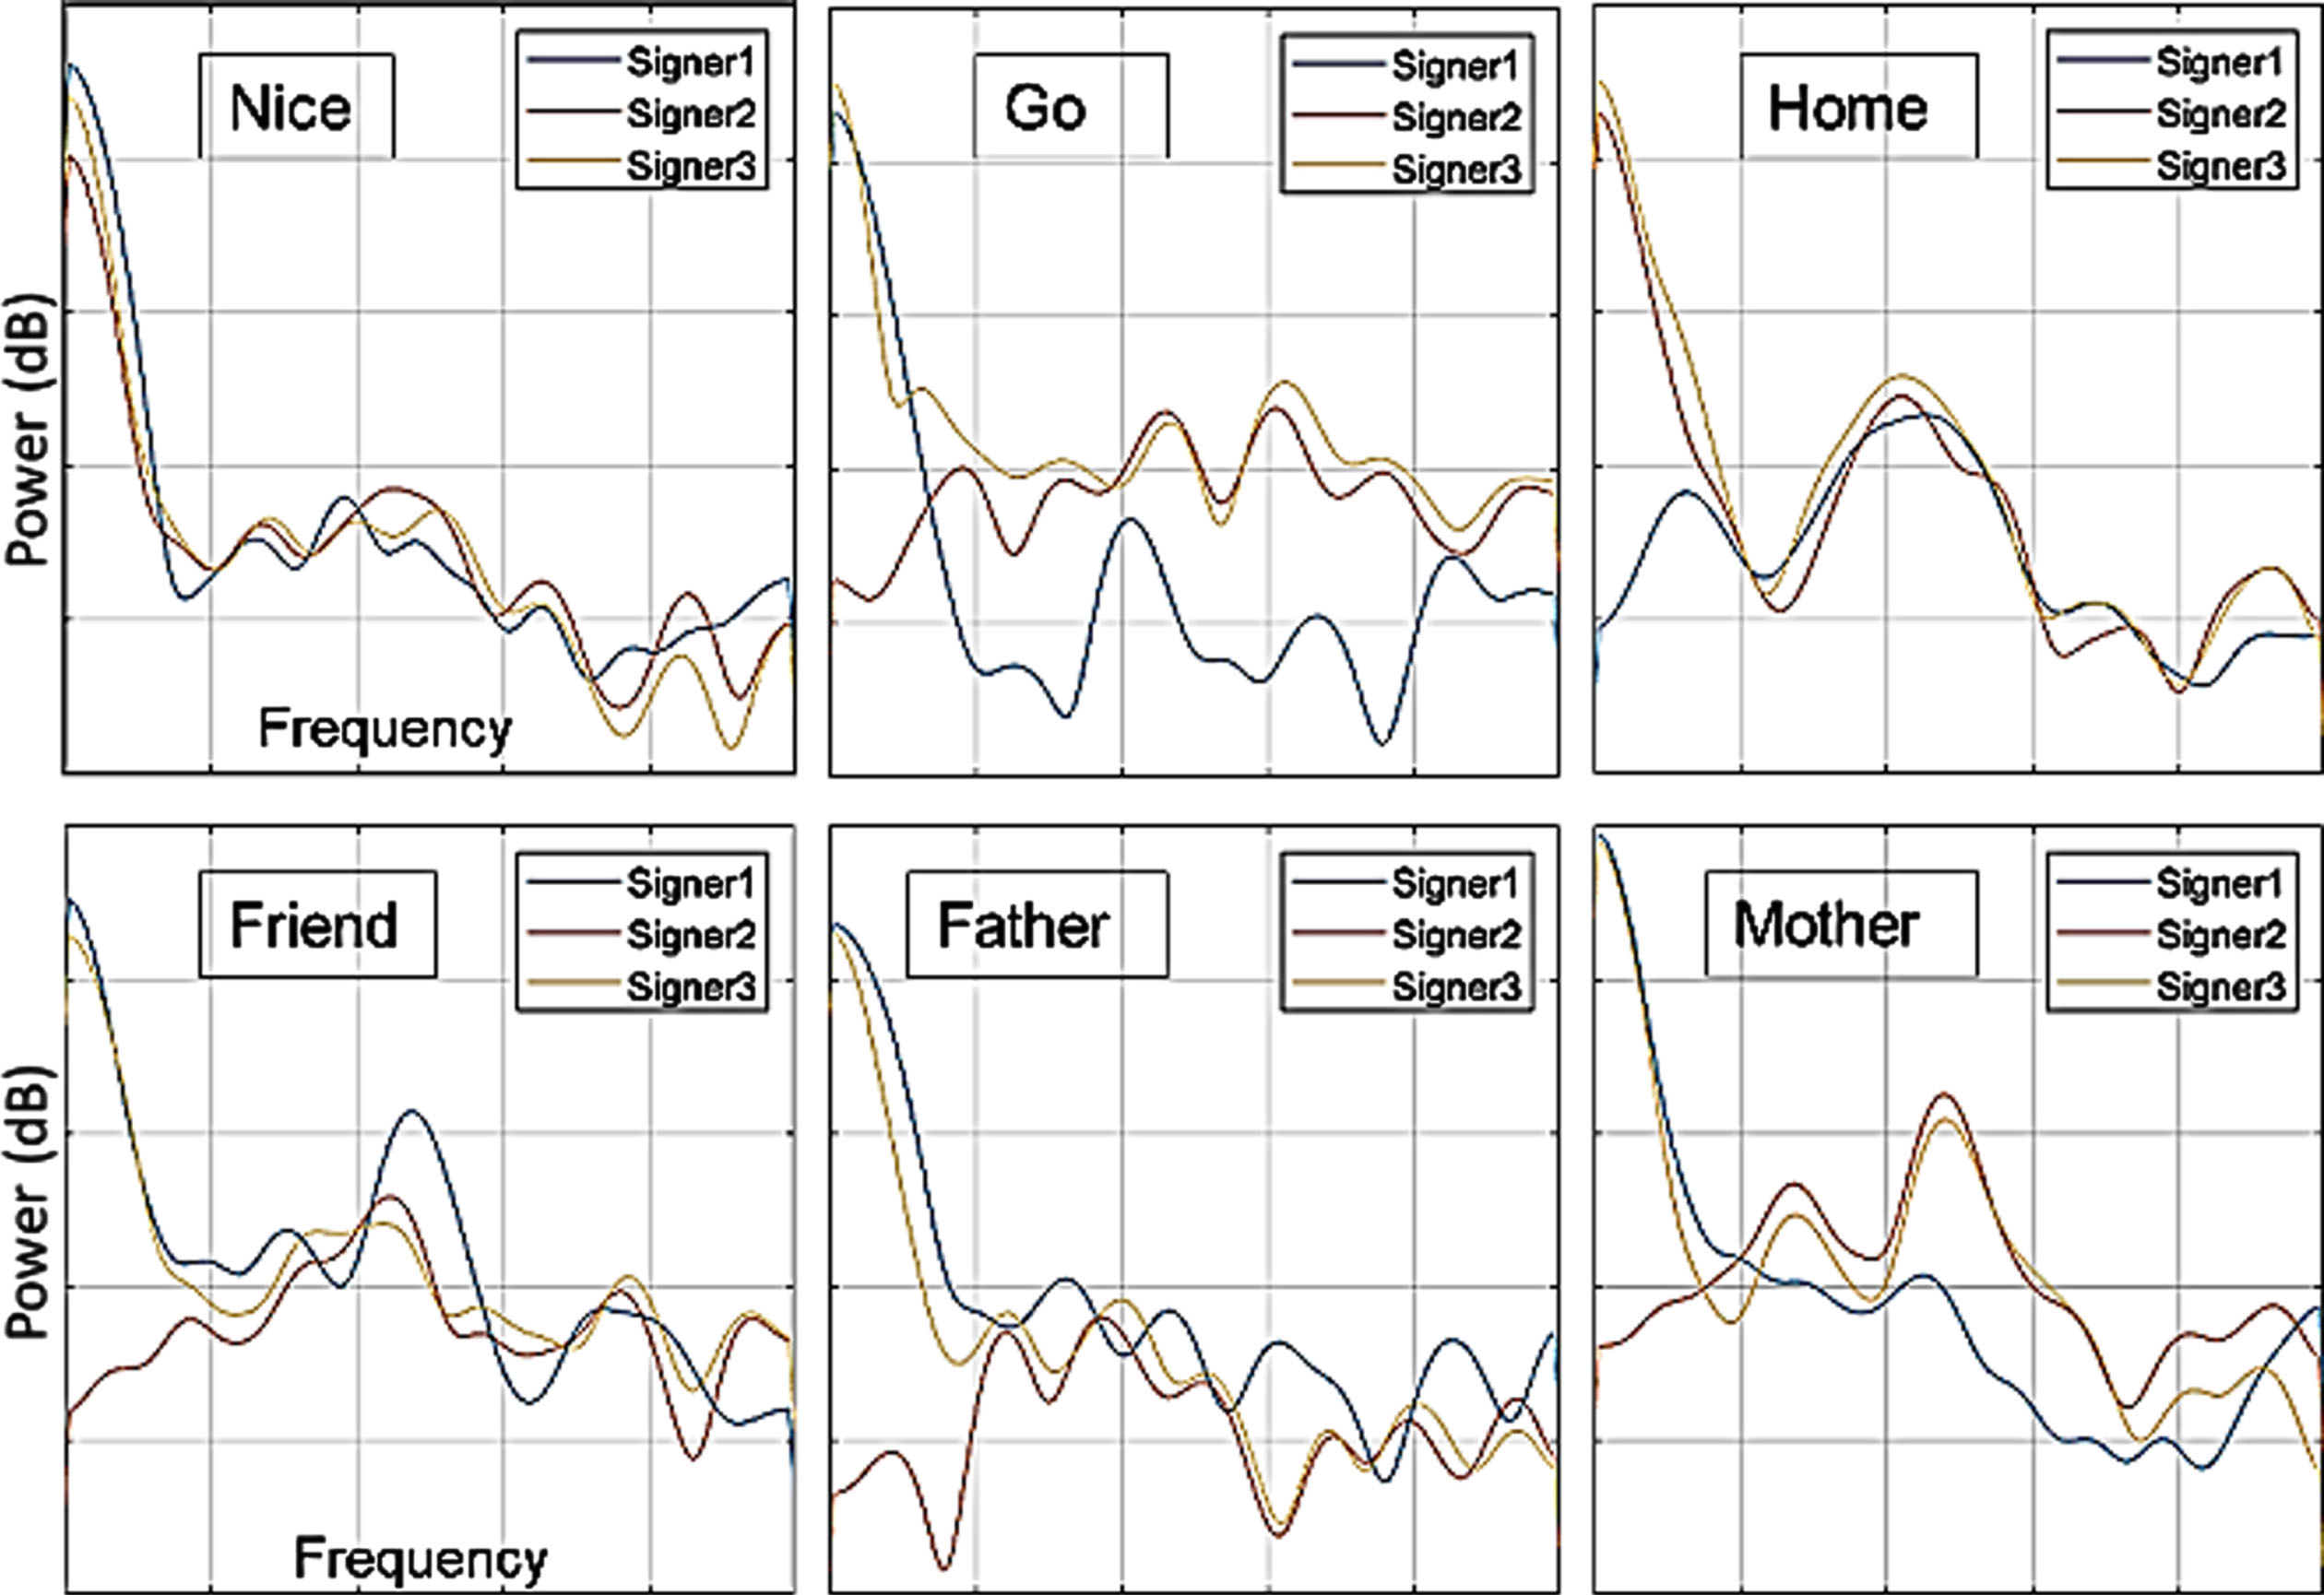
PSD graphics of the words “Go”, “Nice”, “Home”, “Father”, “Mother” and “Friend”.
The graphs show that the signals have similar characteristics. As a result, the constructed FLA-ELM, CNN, and ANN networks were able to generalize the input data reliably.
In FLA-ELM and classical ANN models, 34×40 word data were converted into 1×1360 input vectors in the first phase. In the ANN, the training rate is 0.01, hyperbolic tangent () is used as the transfer function of the input and hidden layers, purelin () function is used as the output layer transfer function and mean squared error (mse) is used as the loss function. In the FLA-ELM method, the designed FIS system obtained the most successful results when Δ = +1764. In this case, the total number of hidden layer neurons was L = 4764. L = 3000 neurons were used in the ELM-only experiments, which was determined initially. In CNN, a 3-convolution layer network was employed in the experimental studies, which has fewer layers than the known models and has a relatively fast training period. In CNN’s training, 3000 images transformed from word data were employed for 120 words. Ten 3×3 filters were utilized in the convolution layers, ReLU was used as the activation function, and max pooling was used in the pooling layer. In the ANN and CNN training processes, a 10% portion (12 words – test dataset) of the entire dataset was reserved and not used in the training activities. The remaining dataset was trained 100 times iteratively using developed software, and the weight/bias values generated after each training were tested on the [test + validation] dataset. The hyperparameters of the network with the lowest error were recorded. As a result, using this best network, accuracy values were calculated and tabulated using the whole dataset (training + validation + testing). Table 2 shows the single-word and multiple-word performances of the methods.
Accuracy performance of models
Accuracy performance of models
The table shows that single words have higher accuracy than multiple words. This result was obtained because no end-points were calculated in the classification process of single words. It is also important to note that long words have a greater accuracy rate in ANN for single words. The analysis determined that the accuracy was higher because more salient features could be extracted from long words. A small difference was observed between the accuracies of the CNN and the ANN classification. Except for single long words, the FLA-ELM method produced the best results. When the results of the single ELM are examined, it is clear that the proposed method effectively optimizes the ELM results. In CNN and FLA-ELM classification, shorter words and sentences are classified more accurately than long ones. However, FLA-ELM’s performance is better considering the accuracy rates.
It is necessary to measure the time consumption of the methodologies in order to conduct a comprehensive comparison. In real-time applications, any delays in translating hand gestures into voices would break off the synchronization of signs and sounds. Therefore, time consumption is a key performance parameter in this research. Especially in big data, all the features may not be needed to learn the relationship between output and input because some features can be more effective in learning than others. Data sizes and processing times can be reduced by detecting high-impact features and removing lower-impact features from the data set. Reduced dataset sizes help recognition processes in two ways. It first reduces training times and then reduces real-time processing times. However, as data sizes are reduced, the accuracy value may decrease. The features of the dataset that have the least impact on the result should be removed to minimize the decrease in accuracy. This was achieved through the use of Principal Component Analysis (PCA). PCA is a well-known unsupervised statistical attribute reduction approach. The goal of PCA is to extract the most significant information while retaining the most distinctive characteristics of the original data in the created PCA subspace. PCA benefits many high-dimensional multivariate data applications, such as face and character recognition [33]. We created two new datasets as a result of the PCA we performed on our original dataset. There were 25 (PCA1) most important features in the first dataset and 15 (PCA2) in the second. When the derived data sets were examined, it was observed that the most important features were the data of inertial sensors, followed by flex sensors. In addition, it was discovered that the features obtained from the sensors in the right hand were detected more significantly than those in the left hand. This is because the signers from whom the samples were collected were mostly right-handed, and there were hand gestures performed with only one hand in the classified words. Time consumption measurements were taken by performing hand gestures, generating word data, and classifying using timers in the software. Word data generation starts a negligible time after hand gesturing ends and runs simultaneously with hand gesturing for most of the process. Classification starts as soon as word data generation ends. Table 3 shows the results of the tests conducted to examine the effect of reducing the data set size on accuracy and classification time consumption.
Accuracy and time consumption obtained as a result of PCA
Accuracy and time consumption obtained as a result of PCA
When the table is examined, it is discovered that FLA-ELM has the highest accuracy and the shortest processing time. The ANN method required more time to process both short and long words/sentences. This is because the number of weights and the connection complexity are higher than other methods. In addition, the accuracy of all classifications decreased as a result of data set reduction. As the dataset size gets smaller, the time consumption reduces due to the decrease in the number of neurons in the NN architectures. In the experiments performed on the data set reduced with PCA1, the processing times decreased in the range of about (6.7–14.3%), while the accuracy decreased in the range of (0.75–1). In PCA2, processing times are reduced by about (20–35%) and accuracy by (6–10%). This decrease in accuracy shows that the data set obtained with PCA2 is far from efficient. Therefore, PCA1 was preferred in real-time studies.
This study aims to develop a portable data glove that translates Turkish sign language to voice for hearing and/or speech-impaired people. Sensor signals from the data glove were transformed into digital data (word data) and classified concurrently with hand movements. A total of 120 words and sentences consisting of these words were successfully classified using ANN and CNN methods. In experimental studies, 120 words were divided into short and long-term words. In order to assess the system’s continuity, sentences including three consecutive short/long words were classified, and performance measures were taken. A Euclidean distance-based approach has been developed for end-point detection, which is the most challenging phase in continuous gesture recognition. When the literature is examined, it is discovered that most studies with data gloves use letter and number recognition, with only a few studies using word recognition. Table 4 shows the characteristics of the studies examined.
Results for accuracy and total process time consumption for a sample of research in the literature
When we examine the accuracies in our study, it has been observed that although CNN is more accurate, it consumes roughly 5–9 percent more time than ANN. According to findings, the conversion of each word data into images increases the processing time in CNN. This increase, however, is within acceptable limits. The CNN approach achieved a 97 percent accuracy rate for classifications of single words. The processing times were quite close since the short and long-term words were interpolated to the same dimensions. It is noticed that the accuracy of continuous gesture recognition reduces due to end-point detection. Because the transitions between the two hand movements vary significantly amongst individuals, it has been observed that neural networks have less success generalizing these transitions. Although ANNs and CNNs quickly learned hand gestures with certain trajectories, the learning rate was reduced because the trajectories of the transitions between the two signs were unclear and varied significantly across individuals. While there was no significant difference in processing times between short and long words, there was a comparable difference between short and long sentences. The most important limitations experienced in this study are the training of signers who do not know Turkish Sign Language in data collection and the use of extra filters to clean the noise signals from the sensors compressed into a narrow space. In the continuation of this study, neural network-based methods will be developed for end-point detection, and improvements will be made for the more accurate translation of longer sentences.
Footnotes
Acknowledgments
This research was supported by Afyon Kocatepe University, Scientific Research Projects Council with Project Number 19.FEN.BİL.33