
Abstract
The quality of manufactured products plays a very important role in increasing consumer satisfaction. One approach to improving outgoing lot quality is applying screening method. In this paper, a multiple deferred state sampling plan is presented for a unilateral-univariate normal process with imprecise process quality in the presence of the rectifying inspection. To assess the performance of the proposed plan, a mathematical model is derived for calculating the fuzzy average total inspection (
Keywords
Introduction
Acceptance sampling plans have been common quality control methods applied in industry to test whether a submitted lot should be accepted or not. They are divided to attribute and variable plans. A main benefit of the variable plans is that they usually provide more information about the manufacturing production than attribute schemes. Each sampling plan has some parameters. The plan parameters are usually determined so that its operating characteristic curve passes through two points (AQL, 1 - α) and (LQL, β). AQL and LQL are acceptance quality level and limiting quality level of the lot with acceptance probabilities 1 - α and β, respectively (see Montgomery [25]).
Most plans often employ the running lot information on sentencing a submitted lot. Unfortunately, such schemes mainly require large sample size to satisfy both consumer and producer. In order to prevail the pointed disadvantage, conditional plans were extended that are designed based on the current, past or future lots information. Dependent state sampling plan was studied by Mogg and Wortham [23] in which the past lots information is utilized to decide about the submitted lot. Wortham and Baker [32] introduced a plan named multiple deferred state (MDS) attribute sampling plan in which they apply various consecutive forthcoming lots information. Later, Balamurali and Jun [11] developed MDS attribute plan to the state where quality characteristics are variable. The variable MDS plan based on the process yield index was presented by Wu et al. [34] in which the conventional variable single sampling plan is considered as a reference plan. Wu et al. [35] studied MDS sampling plan by variable as the specification limits are two-sided. Sentilkumar et al. [27] proposed bayesian repetitive deferred sampling plan in which the succeeding lots information are used under repetitive group sampling plan. Also, Yan et al. [37] used the coefficient of variation of the quality characteristic to design MDS sampling plan. The optimal MDS sampling plan was studied under a Gamma-Poisson model by Balamurali et al. [10]. They showed that their proposed plan has a minimum average sample number for decision. Aslam et al. [9] represented MDS plan by considering the process loss function. Wu et al. [36] developed MDS plan based on a capability index as specification limit is unilateral. Aslam et al. [8] designed a plan based on MDS concept for linear profiles. Ahmadi Nadi et al. [6] introduced a modified variable repetitive group sampling plan including MDS idea by using overal yield of manufacturing process. Further studies about MDS sampling plan can be found in Vaerst [31], Soundararajan and Vijayaraghavan [28] and Govindaraju and Subramani [20].
The proportion of nonconforming items (p) is generally assumed to be precise in classic plans. But in practice, there are many cases in which p is not estimated accurately. In this case, the sampling plans should be planned based on fuzzy logic. Chakraborty [16] addressed a class of single sampling plan based on fuzzy optimization. Also, Divya [17] studied about quality interval acceptance single sampling plan when p is not crisp by applying poisson distribution. Baloui Jamkhaneh et al. [12] discussed the fuzzy attribute single sampling plan. They showed that their proposed plan is well-defined. Fuzzy double sampling plan (FDSP) investigated by Afshari et al. [3] for variable quality characteristic with upper specification limit. Tong and Wang [30] considered an acceptance sampling plan as the quality characteristic is vague. A new sequential sampling plan based on sequential probability ratio test was introduced by Baloui Jamkhaneh and Sadeghpour Gildeh [14]. Fuzzy MDS (FMDS) sampling plan by attribute has been studied by Afshari et al. [4]. Later, Afshari and Sadeghpour Gildeh [1] have extended FMDS attribute plan to the state where the interested quality characteristic is variable, and they also introduced variable fuzzy single sampling plan (FSSP) to compare their proposed schemes. Also, FMDS attribute plan was considered in the presence of misclassification errors by Afshari et al. [5].
Rectifying inspection is one of the approaches to refine the quality level of lot during the inspection. In one way of rectifying inspection, if the lot is rejected, 100% inspecting is applied and all the observed nonconforming items are substituted with conforming ones. On the other hand, if the lot is accepted, the defective items in the sample will be replaced with conforming units. Rectifying attribute single sampling plan was determined by Guenther [21] under minimising average total inspection (ATI). Dodge and Roming [18] presented a method to select a single sampling plan indexed through the average outgoing quality limit (AOQL) by minimising the ATI. Measure of AOQL was studied under the operation of MDS plan in a fuzzy environment by Afshari and Sadeghpour Gildeh [2]. They introduced a method to calculate the mentioned measure as defective proportion is imprecise. Razmkhah et al. [26] used the ranked set sampling method to design rectifying double acceptance sampling. A new meaning of maximum allowable average outgoing quality (AOQ) was introduced by Suresh and Ramkumar [29] in rectifying single sampling plan. Wu [33] presented an algorithm in which the likelihood function is applied to estimate the AOQ in rectifying inspection. Baloui Jamkhaneh and Sadeghpour Gildeh [13] discussed about rectifying double sampling plan in a fuzzy environment. The concept of attribute rectifying bayesian MDS sampling scheme under weighted poisson model was presented by Latha and Subbiah [22] in the presence of Gamma prior. In order to make more details about rectifying inspection see Montgomery [25] and Duncan [19].
As discussed above, the appealing feature of the concept of MDS method motivated us to develop this concept in the presence of rectifying inspection as the process quality is reported an imprecise value. So, in this paper, we present rectifying FMDS plan on making a judgment about manufacturing productions when the interesting quality characteristic follows normal distribution with upper specification limit. The proposed plan is discussed in two cases known and unknown standard deviation. Moreover, to asses the introduced plan, ATI measure is considered and derived a mathematical expression for the ATI based on the fuzzy numbers arithmetic. Also the advantages of the proposed plan are studied over the existing plans.
The outlines of this paper are as follows. In the next section, we recall traditional MDS variable sampling plan. The rectifying FMDS variable sampling plan is offered in Section 3. Section 4 deals with an important measure fuzzy ATI of the proposed plan. In Section 5, advantages of the proposed plan are discussed. To show the application of the proposed plan, an industrial example is provided in Section 6. Some conclusions are summarized in Section 7. In this paper, the R software (version x64 3.3.0) is used to compute and plot the graphs wherever is needed. A part of this paper has been presented in 6th Iranian Joint Congress on Fuzzy and Intelligent Systems (CFIS) (Afshari and Sadeghpour Gildeh [2]), and this research article is a development version of it.
Traditional MDS variable sampling plan
In this section, MDS sampling plan is recalled when the usual inspection is done. The following assumptions should be valid to use variable MDS sampling plan (Soundararajan and Vijayaraghavan [28]): The serial lots must be produced by a continuing process. Lots need to have a constant proportion of defective items. The quality characteristic of interest follows a normal distribution.
Assume that the quality characteristic has the upper specification limit U and follows a normal distribution with unknown mean μ and known standard deviation σ. Then the operating method in the known standard deviation MDS (KSD-MDS) variable sampling plan is as follows:
Let, p be the fraction nonconforming in a lot, is expressed as
Whenever the standard deviation is unknown, the sample standard deviation S is applied for σ. In this situation, the operating approach is alike to known standard deviation case, and the symbols V s , k rs , k as , m s and n s are used for V σ , k rσ , k aσ , m σ and n σ , respectively. According to Duncan [19] and Balamurali and Jun [11], the lot acceptance probability for the unknown standard deviation MDS (USD-MDS) plan is given by
Here we present rectifying FMDS variable sampling plan in the presence of screening approach as p is imprecise. Assume that the size of each incoming lot to the inspection activity is equal to N with the same parameter
So, the proposed rectifying KSD-FMDS plan is determined by four parameters, namely k rσ , k aσ , m σ and n σ .
According to (1) and applying Buckley’s approach (Buckley [15]), the α-cut of lot acceptance fuzzy probability in rectifying KSD-FMDS is given by
By knowing that
Assume the rectifying KSD-FMDS plan with parameters m
σ
= 1, n
σ
= 41, k
rσ
= 1.98 and k
aσ
= 2.19. Also, let
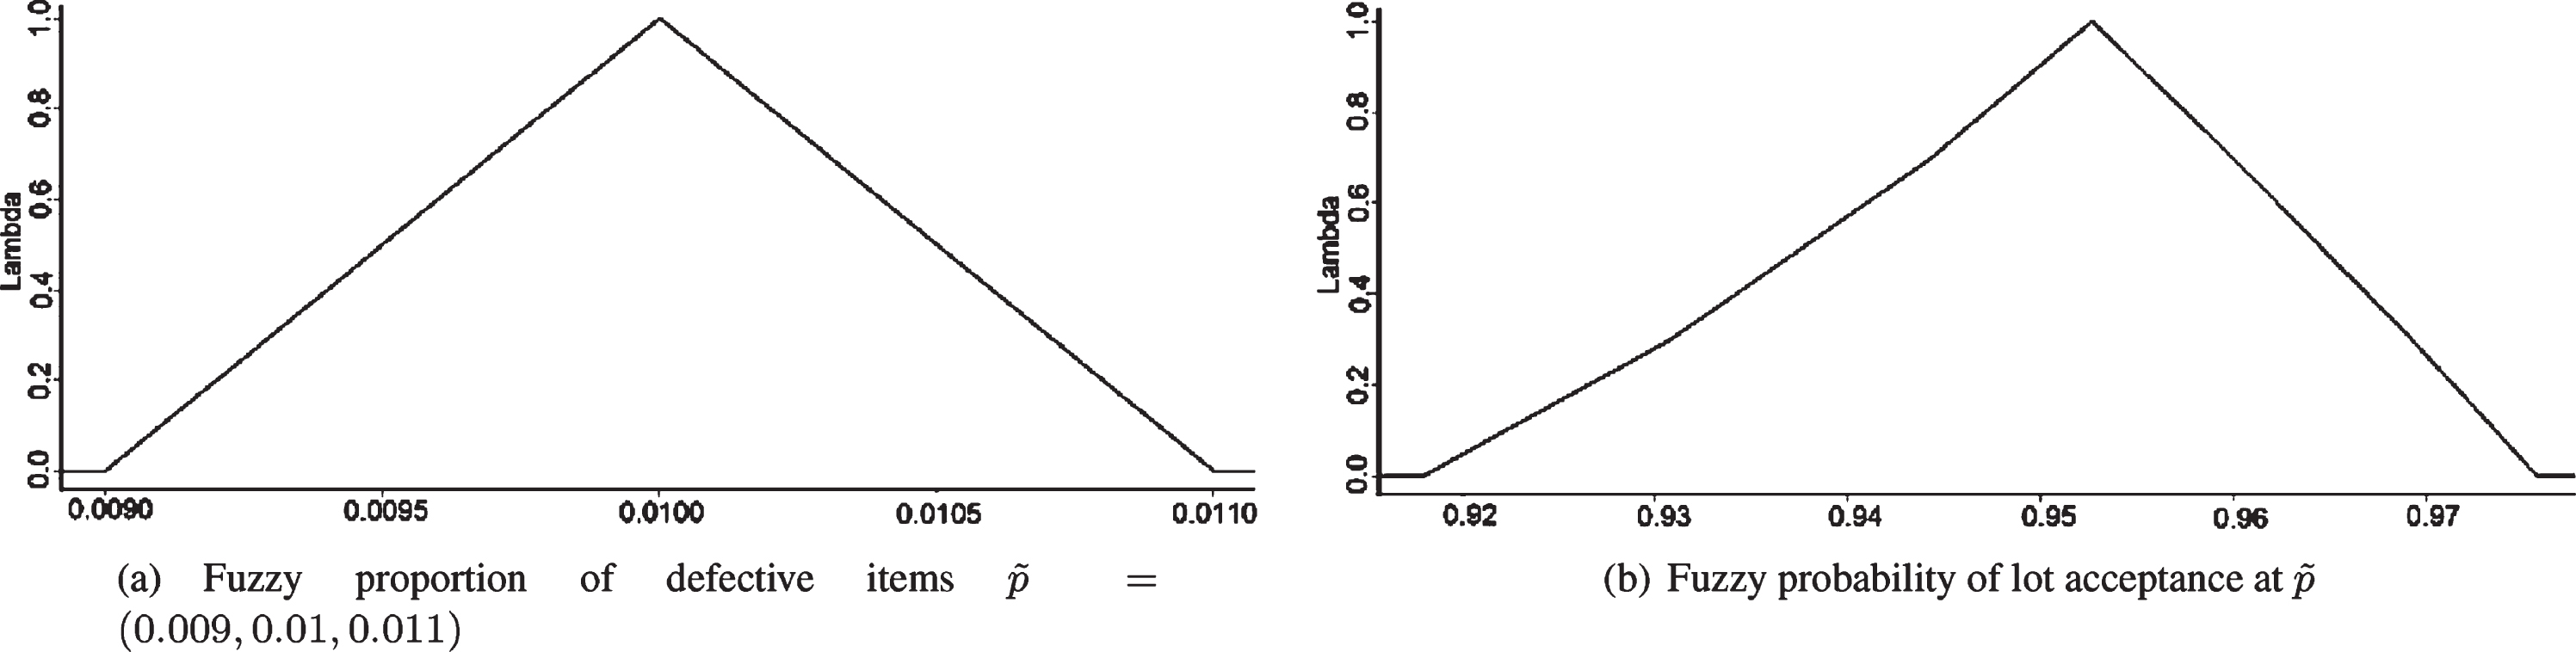
Plots of membership functions of
Consider rectifying KSD-FMDS plan as given in Example 1. We want to plot the operating characteristic (OC) curve of this plan. The OC curve plots the probability of lot acceptance against the proportion of defective items (Montgomery [25]). In order to plot the OC curve of rectifying KSD-FMDS plan,

FOC band of rectifying KSD-FMDS plan for some values of α.
Average total inspection (ATI) is an important criterion to evaluate the performance of the rectifying plans. So in this section, we consider this measure to find a regular model for calculating it in two known and unknown standard deviation cases for the proposed plan. We show that since the proportion of nonconforming items is considered to be vague, the ATI is imprecise. So it should be named fuzzy ATI which is shown by symbol
At first, one way of ordering fuzzy numbers is recalled as the following defenition (see Momeni and Sadeghpour Gildeh [24]):
It is necessary to mention that the major limitation of the proposed rectifying FMDS plan is the waiting line which may be created to determine the disposition of future lots. That is, when the submitted lot is not accepted or rejected unconditionally, one must wait until disposition of m future lots among i future products are determined. The value of i is defined as an agreement between the consumer and the manufacturer. Therefore, it is necessary to consider this issue in the following discussions.
Here consider the following symbols.
A: Event of unconditional acceptance of a lot,
R: Event of unconditional rejection of a lot,
D: Event of deferring disposition,
W: Variable denoting the number of lots that a deferred lot has to wait before determining their disposition (length of waiting time)
P A : Probability that a lot is unconditionally accepted,
P R : Probability that a lot is unconditionally rejected,
P D : Probability that a lot disposition is deferred,
TI: The symbol to display the total inspection,
TI(j): The symbol to display TI at the jth moment,
ATI(j): The symbol to display ATI at the jth moment.
In the following theorem, we derive a general formula to calculate
Proof. See Appendix A.1.■
The procedure to find a regular formula for computing
Assume the following plans with their corresponding parameters: KSD-FMDS plan: m σ = 2, n σ = 22, k rσ = 1.88, k aσ = 2.09, USD-FMDS plan: m s = 2, n s = 66, k rs = 1.93, k as = 2.10.
Let N and i be equal to 10000 and 4, respectively. Suppose that the proportion of defective items is a fuzzy number
Figure 3 displays membership function plots of
Membership function plots of
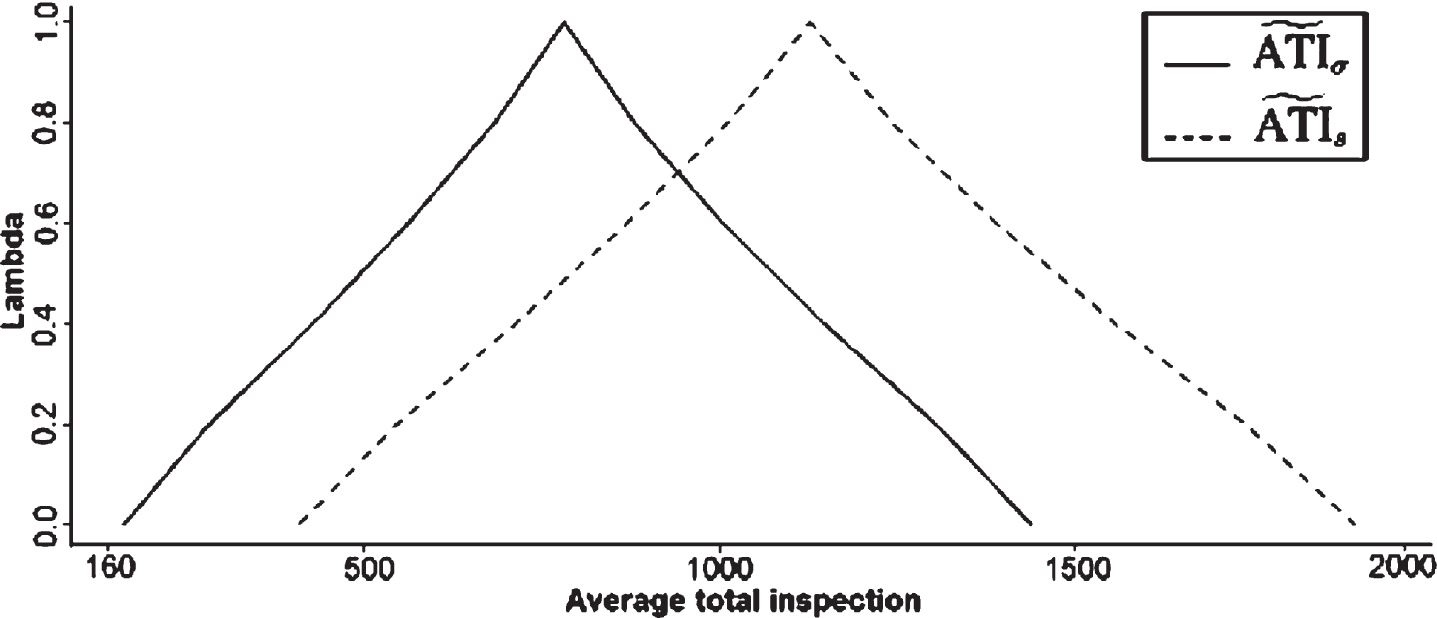
By using Theorem 4.1, relation (8) and writing a computer program in R software, the values of
Similar to what explained to plot the FOC band,
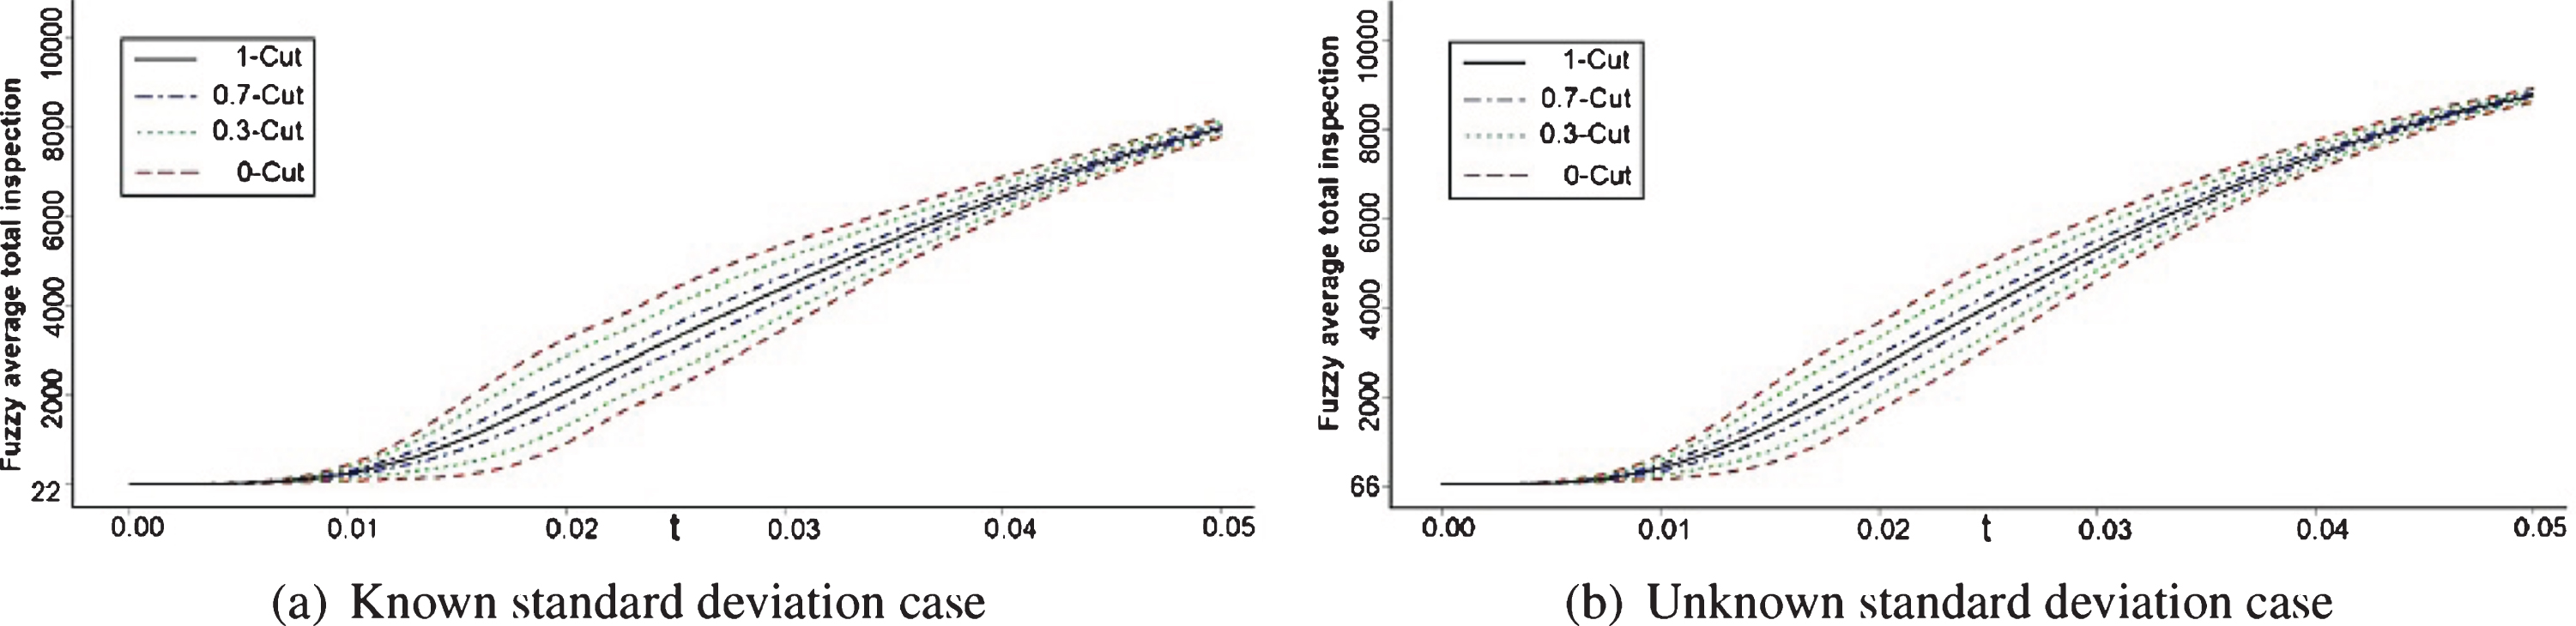
Plots of
The ATI function, which displays the relationship between entering quality and the number of items required to be inspected, is widely used as a criterion to referee between sampling plans. In this section, a comparative discussion is conducted between the proposed plan, existing FSSP (introduced in Afshari and Sadeghpour Gildeh [1]) and existing FDSP (introduced in Afshari et al. [3]) based on

FOC bands of the proposed plan, FSSP and FDSP.
In this section, we display how to apply the proposed plan in a real world. To do this, we use the introduced plan to make a decision about acceptance or rejection of the colour STN (super-twisted nematic) displays studied by Aslam et al. [7]. Since the standard deviation is unknown, we take the proposed rectifying USD-FMDS to make a decision about the lot of productions. Colour STN displays are created by mixing the traditional monochrome and colour filters where each pixel is divided into R, G and B sub-pixels. In this study, the quality characteristic is the membrane thickness of each pixel. The upper specification limit of quality characteristic is U = 12500A°. Suppose that one would like to decide about the mentioned manufacturing products under the agreed conditions as the values of
To apply the proposed plan a sample of size 90 is taken from the submitted lot and obtained
Finally, it is worth to compare the needed values of
FSSP plan: n s = 136, k as = 2.07, FDSP plan: n s = 98, k rs = 2.02, k as = 2.2.
Figure 6 shows the If incoming quality is good, then the amount of the average total inspection is close to the related sample size under the operation of all three plans. Since as the process quality is good, the probability of lot acceptance increases, then a sampling inspection is only done. So that, one can see that the value of ATI is approximately equal to 90, 98 and 136 in the proposed plan, FDSP and FSSP, respectively, as the incoming quality is good. By decreasing the process quality, the value of the The value of
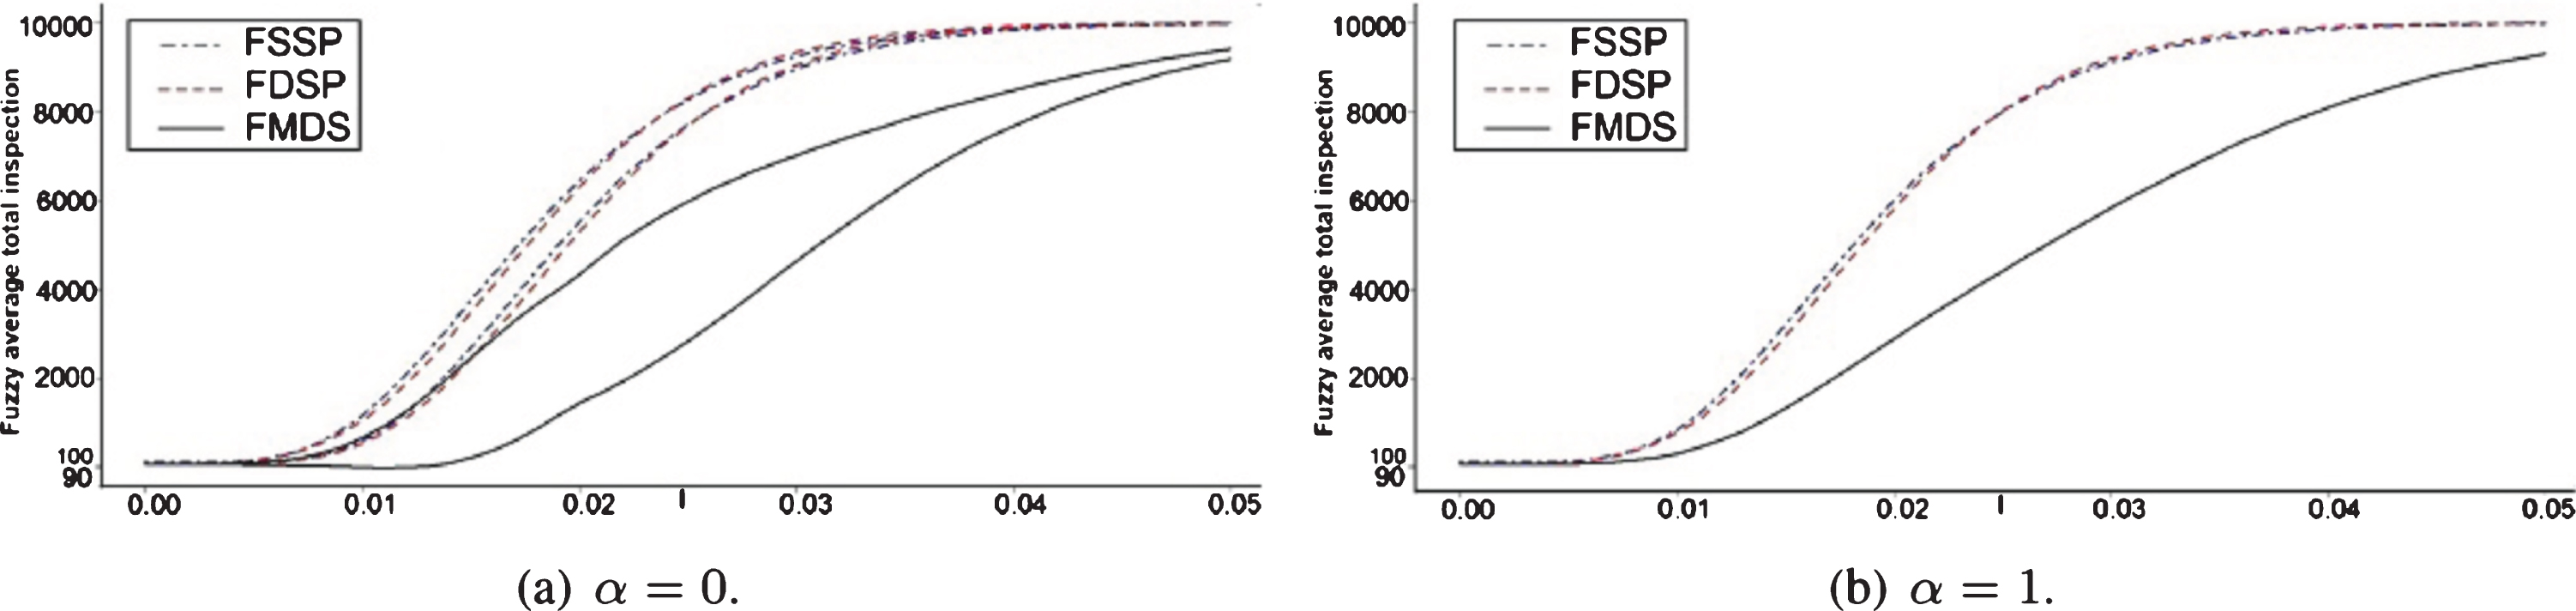
As a result, the proposed scheme is more economical than existing plans due to saving the lot inspection time and cost.
In this paper, a rectifying fuzzy multiple deferred state variable sampling plan was proposed for the univariate normal process whose quality is uncertain. To evaluate the efficiency of the proposed plan, we discussed the average total inspection (ATI) under the operation of the introduced plan and concluded mathematical formula to calculate ATI in both known and unknown standard deviation cases. To investigate and display the use of the obtained model in a real world, an industrial example was demonstrated. Also we discussed the advantages of the proposed plan in comparison with the existing plans which use only the current information of process for making a decision about the manufacturing productions in a fuzzy environment. The obtained results showed that applying the proposed scheme is economical and time saving to inspect the manufacturing products. Development of the proposed plan based on multivariate quality characteristics as well as based on process capability indices can be considered in the future research. Furthermore, developing of other types of MDS-based plans such as modified and overall-yield-based repetitive group sampling plans can be beneficial for future directions.
Footnotes
Appendix
Acknowledgment
We would like to thank the reviewers for their useful comments and suggestions, which have considerably improved the paper. This research was supported by a grant from Ferdowsi University of Mashhad, Iran; No. 2/51994.