
Abstract
City sprawl and rapid increase of petroleum-fueled passenger vehicles has attracted a lot of attention due to concerns of resource energy scarcity and associated environmental damage. This paper uses the transition theory of socio-technical system from the multi-level perspective to analyze the internal mechanism of urban transportation’s transition process and find the most sustainable measures to promote transition. A set of evaluation indicators are constructed for the urban transportation sustainability transition from macro landscape, meso regime and micro niche. Then these indicators are applied to 13 cities in Jiangsu Province and calculate scores of each using triangular fuzzy logic method. The results show that: most cities are in the ‘medium’ stage of transportation transition, while only 4 cities in the ‘relatively poor’ stage. Development of micro niche plays vital role in promoting the transition of urban transportation towards sustainability. Adequate infrastructure support and detailed implementation policies should be developed to protect the steady growth of innovation niches.
Introduction
With the rapid increase of petroleum-fueled vehicles, urban transportation problems, such as air pollution, high energy consumption, congestion, traffic accidents, scarcity of land and resources, have attracted the attention of the wide public in the whole world. Take China as an example, passenger vehicles have shown an annual growth of about 20 million since 2012. Facing such severe social and environmental problems, the priority is to realize the low-carbon transition of urban transportation, which means the sustainable development of urban transportation. That is, to achieve low consumption and low emission in the environment aspect, to attain the construction of transportation infrastructure according to the urban development level in the economy aspect, and to diversify the allocation and distribution of transportation resources in the social aspect. Based on the evaluation results, policies and measures for sustainable development of transportation are formulated. Studying the transition evaluation of transportation is of great practical significance for identifying the fundamental indicators affecting the transition, promoting the sustainability transition of urban transportation and providing effective reference and guidance for transportation planning of relevant government departments.
Due to the increase in scarcity of resources, serious environmental deterioration and global warming, the research of the sustainable transition of socio-technical system has increased rapidly in recent years. In the transition study process of socio-technical system, many theoretical frameworks have been formed such as the multi-level perspective analysis, transition management, and strategic niche management. Based on the sustainable transportation theory and literature review, many scholars have constructed the corresponding indicator system from three aspects of environment, economy and society [10, 22], but there is less research on urban transportation sustainability evaluation from the perspective of transition. The multi-level perspective is the study framework of radical technological change and diffusion. It emphasizes the social interaction and dynamic function in the system change [8]. Geels conceptualized the socio-technical system into three levels: macro landscape, medium regime and micro niche. Among them, the macro landscape level is the exogenous environment of the socio-technical system. The meso level includes three interrelated elements: network of the participants and the social groups, formal rules to guide the activities of the actors, material and technical elements, and the radical innovation is incubated and surged in niche level [7].
Taking the prefecture level cities in Jiangsu as an example, this study starts from the multi-level perspective of socio-technical system transition. Based on the principle of indicator selection and a large number of literature review, the present paper will build a general indicator system suitable for the transition performance evaluation of urban transportation in China with a new angle, and use the triangular fuzzy logic method to quantify the qualitative indicator, so as to improve the objectivity of performance evaluation. In this paper, urban transportation system refers to the traffic involved in the city. The research object is public travel traffic, including public transport and private transport. Public transport is composed of bus, rail transit, and public bicycle.
Our main contribution is to analyze the internal mechanism of urban transportation’s transition process based on the multi-level perspective theory of transition study, and combined with the established transition indicators to ensure that the indicators selection is based on sufficient theoretical analysis. And then a set of evaluation indicators are established from a new perspective, which are applied to 13 cities. Collected data are divided by interval bisection, which increases the objectivity of data processing. In addition, sensitivity analysis of indicators is added on the basis of existing fuzzy logic method.
The paper is structured as follows. Section 2 gives the literature review on the evaluation indicators and methods of urban transportation, the introduction and application of fuzzy logic methods. Section 3 introduces six steps to study the sustainability transition evaluation of urban transportation. Section 4 illustrates the internal mechanism of urban transportation’s transition and gives the empirical study by a set of general transition indicators. Section 5 analyzes the results of comprehensive score and indicator evaluation by fuzzy logic method. Final section concludes with a review of our findings.
Literature review
One of the key components of the sustainable transportation planning is to develop a system of evaluation criteria to assess the performance of the transportation according to appropriate development indicators [4]. Scholars have studied numerous green and low carbon evaluation indicators for urban transportation systems. Bongardt et al. proposed that a complete set of sustainable urban transportation indicators must describe the performance of the transportation system in the aspects of social equity, economic welfare and environmental integrity, and it must be able to capture and explain the subtle changes in sustainable transportation [4]. In addition, Haghshenas et al. and Castillo et al. proposed that the availability and reliability of the necessary data is an important criterion for selecting indicators [9, 10]. Macedoa et al. considered the culture dimension based on environmental, social and economic part of previous study, and put forward a new proposal to evaluate urban sustainability mobility [14].
At present, there are two main issues in the construction of evaluation indicators of urban transportation. The evaluation method and evaluation indicators are various, such as cluster analysis [5], principal component analysis/factor analysis (PCA/FA) [13], strengths weaknesses opportunities threats (SWOT) analysis [21], analytic hierarchy process (AHP) [12] and so on, but in some way they are applicable to some cities and can’t be unified, which is mainly because specific urban characteristics are taken into account when indicators are built. Further, the objectivity of evaluation methods needs to be improved which mainly because of the existence of qualitative indicators. The higher subjective evaluation will lead to the inaccuracy of the results and can’t provide effective reference and guidance for relevant government departments in urban transportation planning.
Compared with the classical method, fuzzy logic method has great expertise in the objective analysis of qualitative indicators. In addition, the influence of each specific indicator on the performance evaluation results can be measured, which is the most significant element for this paper to choose fuzzy logic method. Fuzzy logic is an effective solution to the problem of uncertainty and inaccuracy. This method has been widely used in renewable energy system [17], manufacturing [1], and livestock production dynamic system [18] and so on. By using the fuzzy logic method, Dhunny evaluated the optimal location of wind, solar and hybrid solar-wind farms [2].
Fuzzy logic model consists of three parts: fuzzification, inference mechanism and defuzzification [6, 18]. Different from traditional Boolean logic (i.e. 0 and 1), fuzzification is a process of getting membership degree of fuzzy set from concrete input according to membership function. According to the fuzzy set of input variables, the inference mechanism is recombined by the rules and membership operation of fuzzy logic. Fuzzy rules are mainly composed of a set of logical relation expressions of causal reasoning. Finally, the output value needs to be obtained by defuzzification. Defuzzification is to get a discrete value by calculating a compound fuzzy set with some defuzzification functions.
In the fuzzification part, the real value of each indicator is transformed into the fuzzy set by using the fuzzy number function. Various types of fuzzy numbers are used in the operation of fuzzy logic methods, such as triangular, trapezoidal, exponential, and so on, in which triangular and trapezoidal are widely used. The range of desirable values for the indicator of triangular and trapezoidal fuzzy number can be a single value or an interval form [15, 23]. Vinodh and Vimal used triangular fuzzy numbers to build a lean production evaluation method based on 30 criteria, and proposed a fuzzy logic method to overcome the shortcomings of the imprecision and fuzziness of the scoring method [20]. Trapezoidal and triangular fuzzy numbers was used to set the membership function to evaluate urban sustainability through economic subsystem, environmental subsystem and social subsystem in the study of Jaderi et al. [6]. Considering the large number of prefecture level cities and indicates calculated in this paper, triangular fuzzy number is selected and applied to evaluate the sustainable transition of urban transportation. In setting language variables part, five levels (VH, H, M, L, VL) was adopted in [6], among which VL and VH used trapezoid fuzzy numbers, and the other three were triangular fuzzy numbers. In this paper, seven levels (VH, H, FH, M, FL, L, VL) is used in setting language variables and all of them adopt triangular fuzzy number.
Methodology
In order to evaluate the transportation sustainability transition of the 13 cities in Jiangsu, the fuzzy logic method is employed to calculate the performance score. The process of evaluation is twofold: construction and weighting of indicators and the application of the fuzzy logic method to obtain results. The construction process consists of indicators construction, screening of indicators and weighting of indicators, which correspond to the content of section 4. Results of evaluation is presented after the application of these indicators, which is shown in section 5, including rating of indicators, calculation of comprehensive score and indicator score of each level three parts. These processes are summarized in Fig. 1.
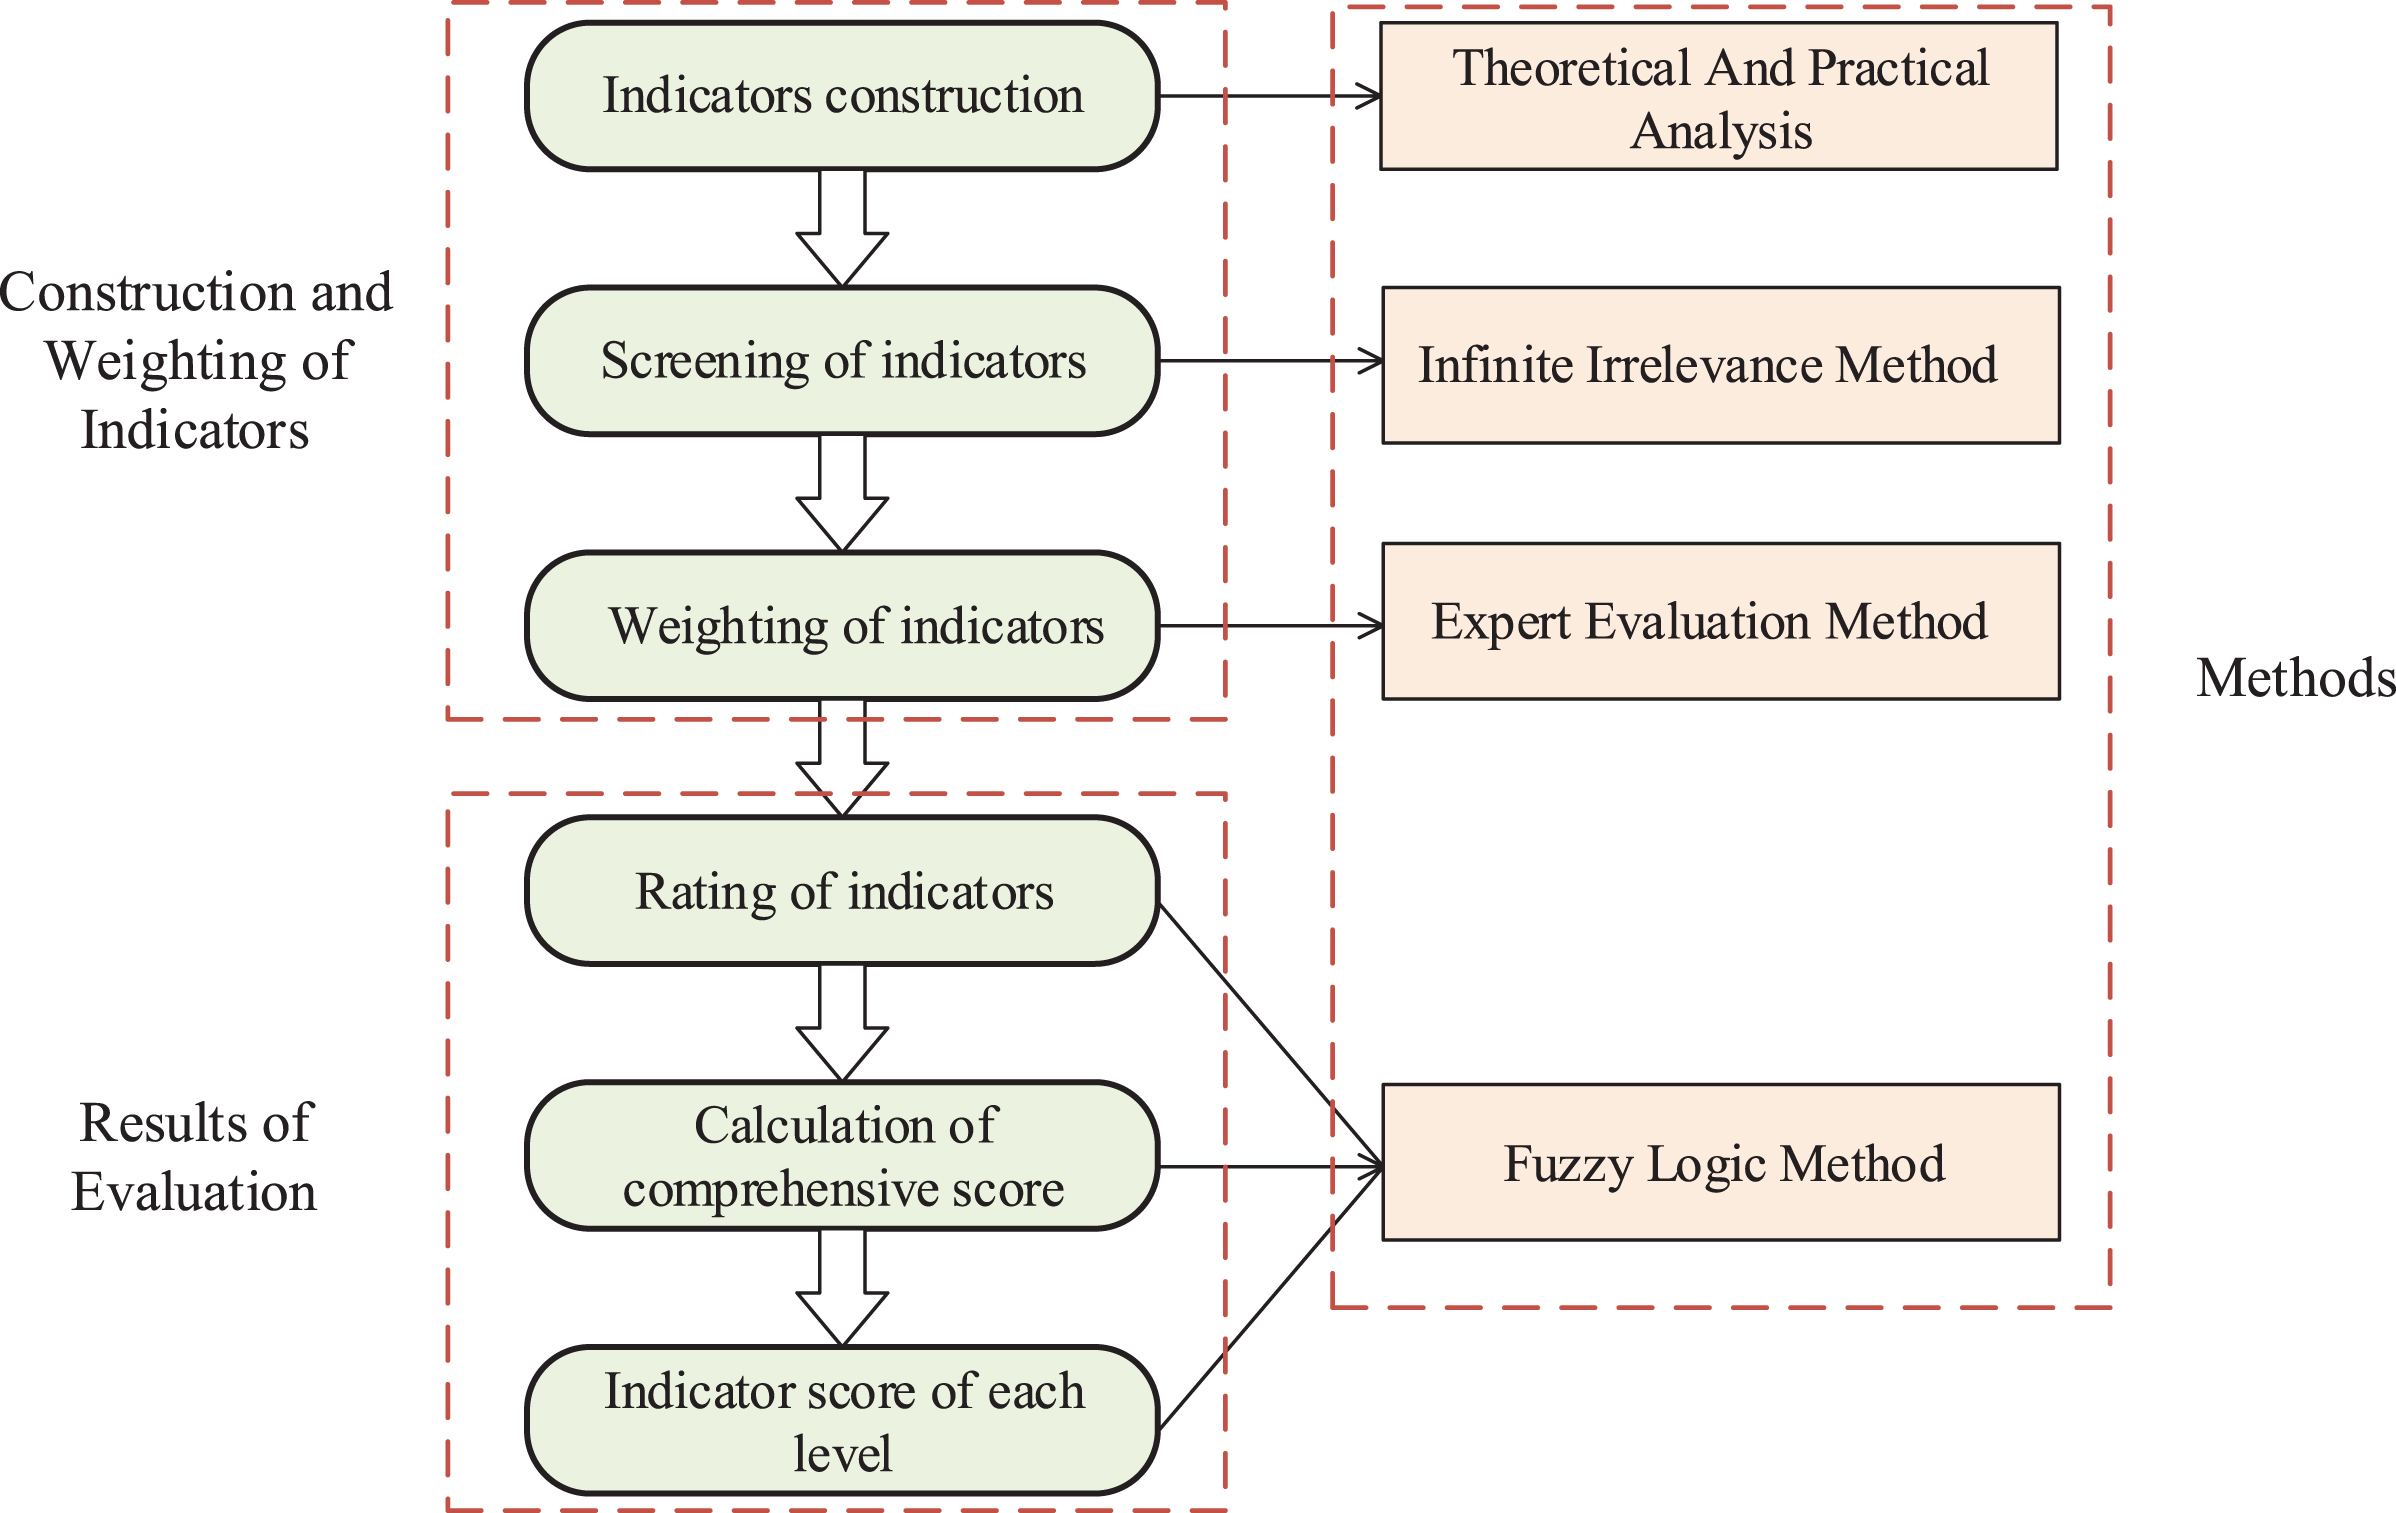
Methodology Process of this Paper.
On the basis of relevant theoretical analysis, combined with the actual situation of urban transportation development in China and a large number of literature reviews, a set of initial indicators to evaluate the sustainable transformation of the transportation system can be constructed. High degree of correlation between the initial indicators will affect the objectivity of the system evaluation. Before further evaluation, correlations between indicators need to be detected based on the collected data. The infinite irrelevance method is used for examination executed in MATLAB, which mainly uses the corrcoef function of MATLAB to test the correlation between one indicator and other n-1 indicators one by one to judge the correlation between the indicators. The high correlation indicators will be removed to improve the authenticity and effectiveness of system evaluation.
After determining the evaluation indicators, next step is to weight the selected indicators. Indicator weighting process the data through linguistic variable, and take the corresponding fuzzy number to carry out the following fuzzy calculation. According to Lin’s and Rajak’s research [3, 19], fuzzy values to quantify linguistic variables are illustrated in Table 1. There are 7 intervals, including very low (VL), low (L), fairly low (FL), medium (M), fairly high (FH), high (H) and very high (VH), in the indicators weighting part.
Fuzzy Number Settings of Indicators Weighting
Fuzzy Number Settings of Indicators Weighting
Rating of indicators can be performed based on the linguistic variable and fuzzy number in Table 2. There are also 7 intervals, including worst (W), very poor, poor (P), fair (F), good (G), very good (VG) and excellent (E), in the indicators rating part. Then, combined with the weight of fourth-level indicators, the fuzzy scores of third, second and first level indicators: R ij , R i and R are calculated by Eq. (1), Eq. (2) and Eq. (3).
Fuzzy Number Settings of Indicators Rating
Fuzzy Number Settings of Indicators Rating
Where, R, R i , R ij and R ijk is the fuzzy number of the first, second, third and fourth-level indicators rating respectively, W i ,W ij and W ijk means the fuzzy number of the second, third and fourth-level indicators weighting respectively, n1, n2 and n3 is the total number of fourth, third and second-level indicators.
Based on the fuzzy number of indicator performance rating and weight, the scores of each secondary, third and fourth indicator: IS
i
, IS
ij
and IS
ijk
will be calculated by the following equations.
Where, F i , F ij and F ijk is the fuzzy number score of the second, third and fourth-level indicators and their calculation score is referred to by IS i , IS ij and IS ijk respectively.
Transition indicators construction
As a socio-technical system, the increasing traffic problems make transition towards low-carbon green of China cities becoming the current development trend. Its transition development involves many factors, including economy, society, culture, technology and innovation. According to transition theory from the multi-level perspective, transition process of urban transportation is illustrated in Fig. 2. In the existing transportation system, the travel proportion of private car is high, the automobile manufacturers, related laws and regulations and vehicle roads is a lock-in system, which have mutual restraint and promotion. The prominent problems in the macro landscape, such as road congestion, air pollution, resource consumption, transportation noise, etc. put pressure on regime to crack, and new energy vehicles, shared transportation, non-motorized transportation and other innovative niches are thriving in the cracks in order to replace the old regime. In the transition process, traffic problems will gradually improve with the change of the regime and the development of niches. While macro landscape and meso regime will adjust and guide the development direction of niches. When new socio-technical regime is formed, the transition of urban transportation will be completed. Urban transportation in China is at the moment that is making transition to low carbon system with the coexistence of multi-niches, and the sustainability transition is an important cornerstone for guiding the development of urban transportation.
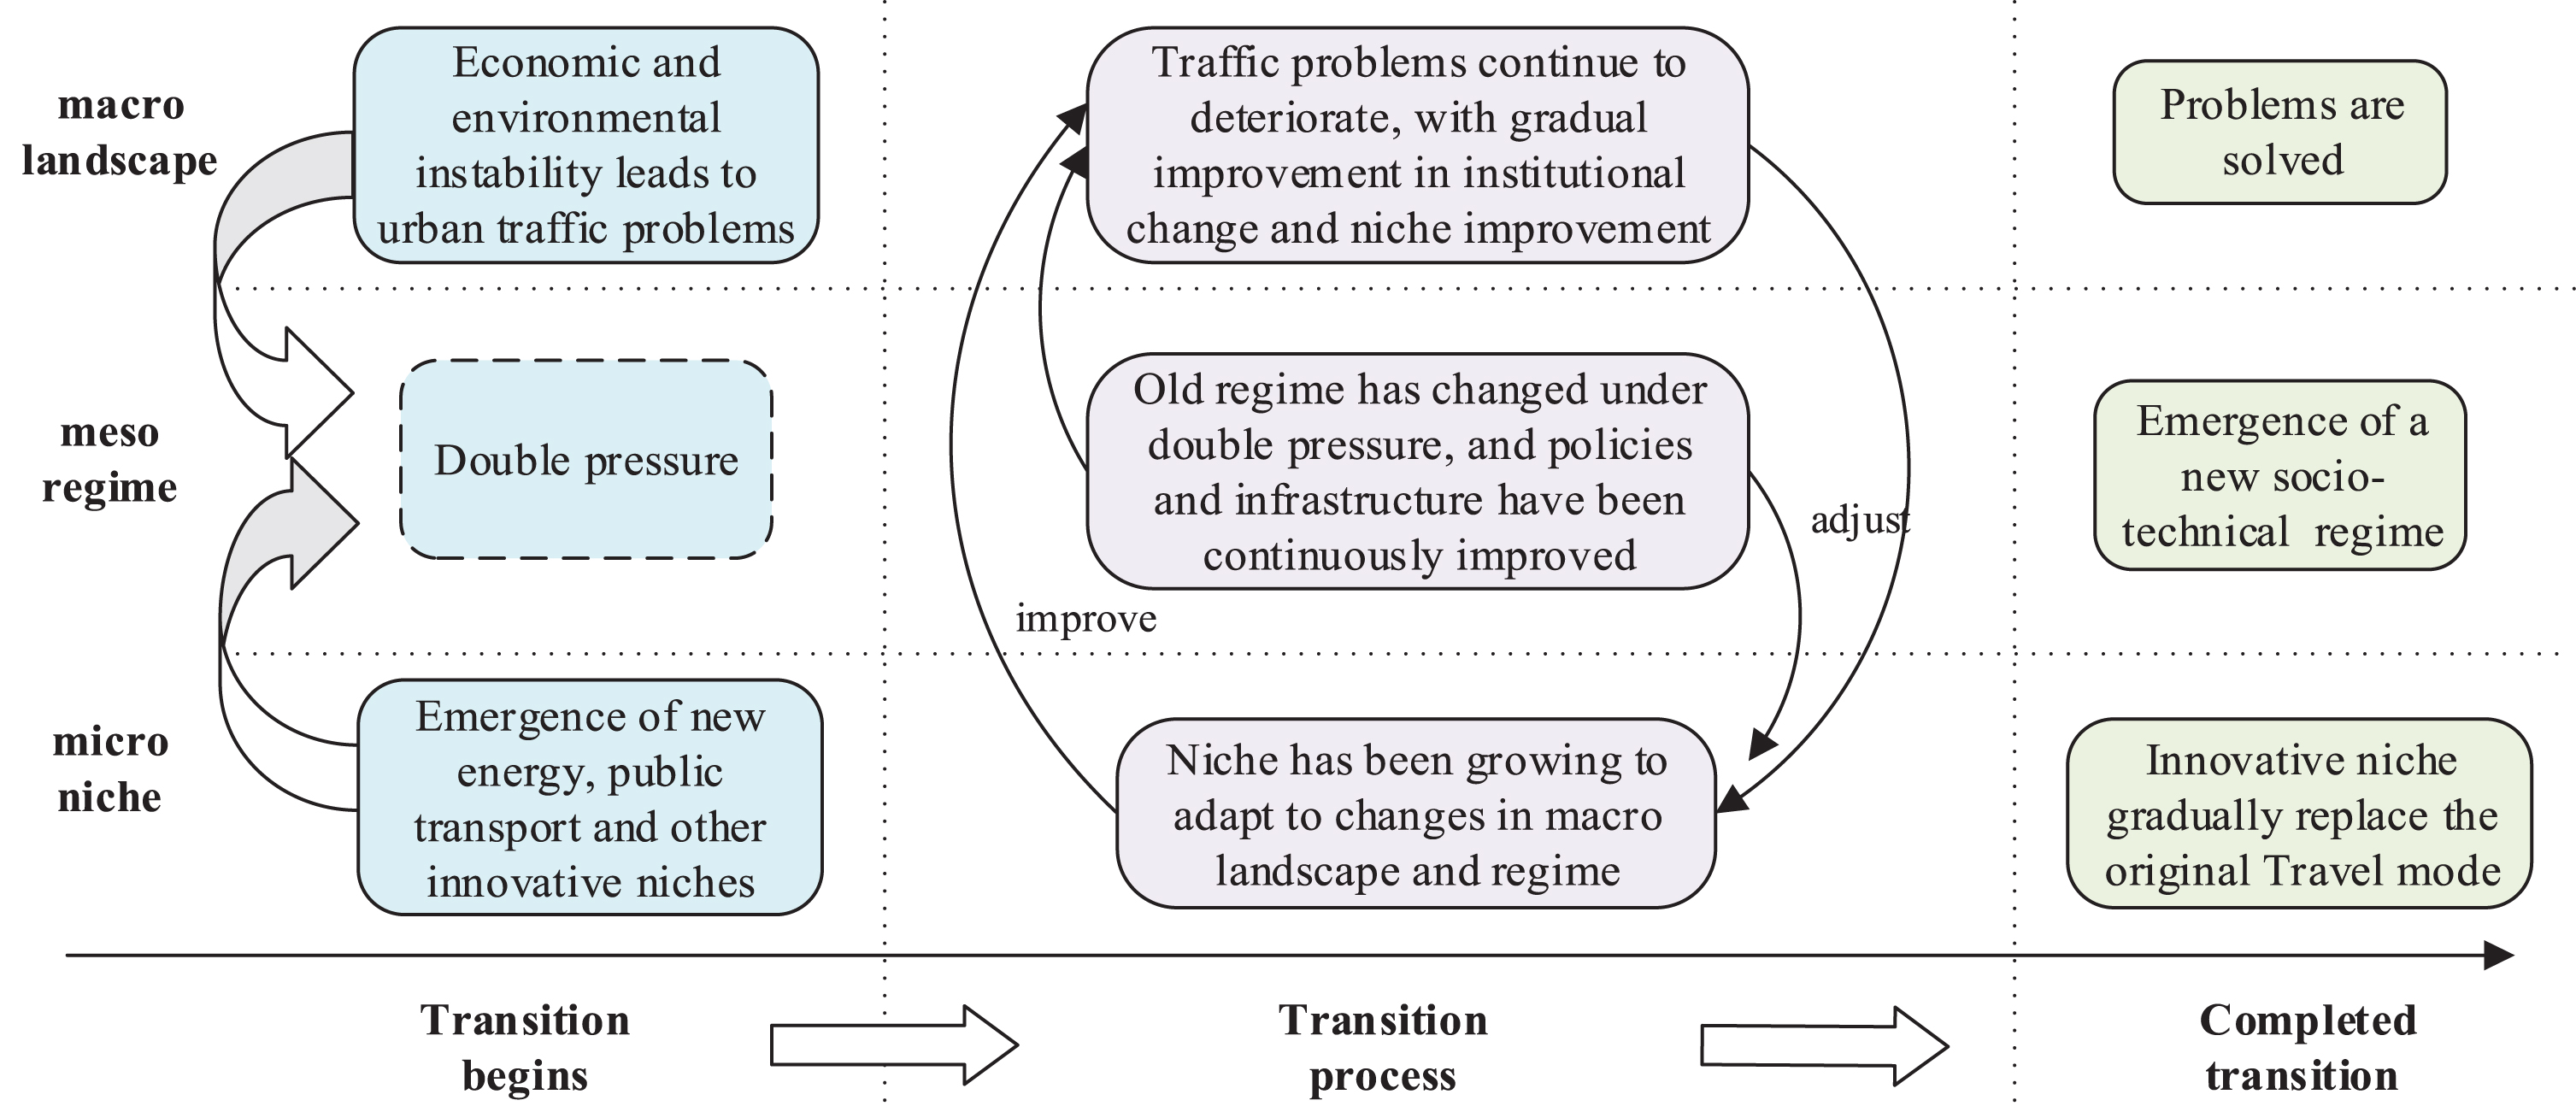
Transition Process of Urban Transportation System.
Based on the previous studies and the analysis of three aspects of macro landscape, meso regime and micro niche, with the consideration of data availability and research relevance, 28 initial indicators are selected in this paper (see Table A1). As shown in Table 3, the macro landscape level includes three aspects: economic factors, resource consumption and environmental impact, which represent the external environment of urban transportation development. The vehicle factors and road factors in the meso regime level correspond to the material and technical factors in the multi-level perspective. The policy and actors correspond to actors and social group networks, and formal rules which guide the behavior of actors. Micro niche level is mainly public transport, slow traffic and new energy in the current urban transportation. The new energy vehicle in this paper refers to the pure electric vehicle and plug-in hybrid electric vehicle promoted in China.
Relationship between indicators construction and the multi-level perspective theory
Only official websites and yearbooks of China and local cities are considered for data collection. Partial missing or incorrect data are filled in by means of averaging, while invalid data are eliminated. Data are mainly collected from 2017 statistical yearbooks of each city, and urban data are selected. In view of the disunity of the units and sizes between the indicators and the differences between cities, urban resident population, annual GDP and urban area are used to standardize the available data respectively.
We implemented the program of infinite irrelevance method for these 28 initial indicators in MATLAB, but the result showed that the singular matrix could not be run, because the number of cities did not correspond to the number of indicators. So each third level indicator are taken as a group. Then the inter-group indicators are selected to perform correlation detection. According to the correlation of each indicator in Table A1, after removing the most relevant indicator (0.966, Disposable income per capita), the correlation of all indicators is reduced to less than 0.8, which conforms to the screening principle of the infinite irrelevance method.
Thus, the evaluation indicators of transition effect of urban transportation sustainability are constructed which is presented in Table 4. According to the expert evaluation method, whether the indicator can promote the transition of urban transportation towards low-carbon green is taken as the evaluation criterion to judge the positive and negative effects of the transition. The 27 indicators will be used in the next fuzzy logic calculation.
Evaluation Indicators of urban transportation sustainability transition after Screening
Evaluation Indicators of urban transportation sustainability transition after Screening
According to the expert evaluation method and previous studies review, 27 indicators selected in this paper are weighted, as shown in Table A2.
Results and discussion
Rating of indicators
Performance rating of indicators of 13 cities in Jiangsu Province will be implemented in this section. Considering that the values and units of each indicator are not unified, the average value is used to divide the performance evaluation interval by the indicator of “+”, as shown in Eq. (10).
The indicator that transition function is “-” is calculated by reciprocal. Data of each indicator is divided into 7 intervals, corresponding to W, VP, P, F, G, VG, and E respectively. Based on the average interval, the indicator performance rating of 13 cities is obtained (see Table A3).
Based on the rating of indicators and according to Eq. (1), Eq. (2) and Eq. (3), the comprehensive fuzzy score of 13 cities’ transportation transition effect is presented in Table 5. The comprehensive score for each city is also a group of triangular fuzzy numbers.
Comprehensive Score of 13 Cities
Comprehensive Score of 13 Cities
Evaluation interval is divided into five intervals, including good, relatively good, medium, relatively poor and poor. The corresponding fuzzy values of five intervals are shown in Table 6. By calculating the Euclidean distance between the comprehensive score and interval fuzzy number y, the sustainability transition performance of each city can be obtained. The calculation results of Euclidean distance of 13cities are presented in Table A4.
Interval Partition Settings
The schematic diagram of the traffic transition effect of each city is drawn in Figs. 3 and 4 according to the fuzzy numbers in Table 5 and Table 6. In the ‘medium’ stage cities, the order of transition effect is Zhenjiang, Nanjing, Suzhou, Wuxi, Taizhou, Xuzhou, Nantong, Changzhou and Yangzhou, among which the development of Zhenjiang, Nanjing, Suzhou and Wuxi in a better stage is more obvious. The transition effect of Yangzhou is basically the same as that of Changzhou. Nanjing and Zhenjiang is in the ‘medium+’ stage, indicating that these two cities are easier to develop to the ‘relatively good’ stage. In the cities with ‘relatively poor’ stage, the order of transition effect is Yancheng, Huai’an, Lianyungang and Suqian, among which Yancheng and Huai’an is almost the same. Furthermore, Suqian has a big gap with other cities and needs to be improved urgently, showing that the distance between Suqian and the ‘poor’ stage is small. Although 8 cities of Taizhou, Xuzhou, Nantong, Changzhou, Yangzhou, Yancheng, Huai’an and Lianyungang are in two different stages of transportation transition, the scores do not have much difference, indicating that the transition process is relatively similar.
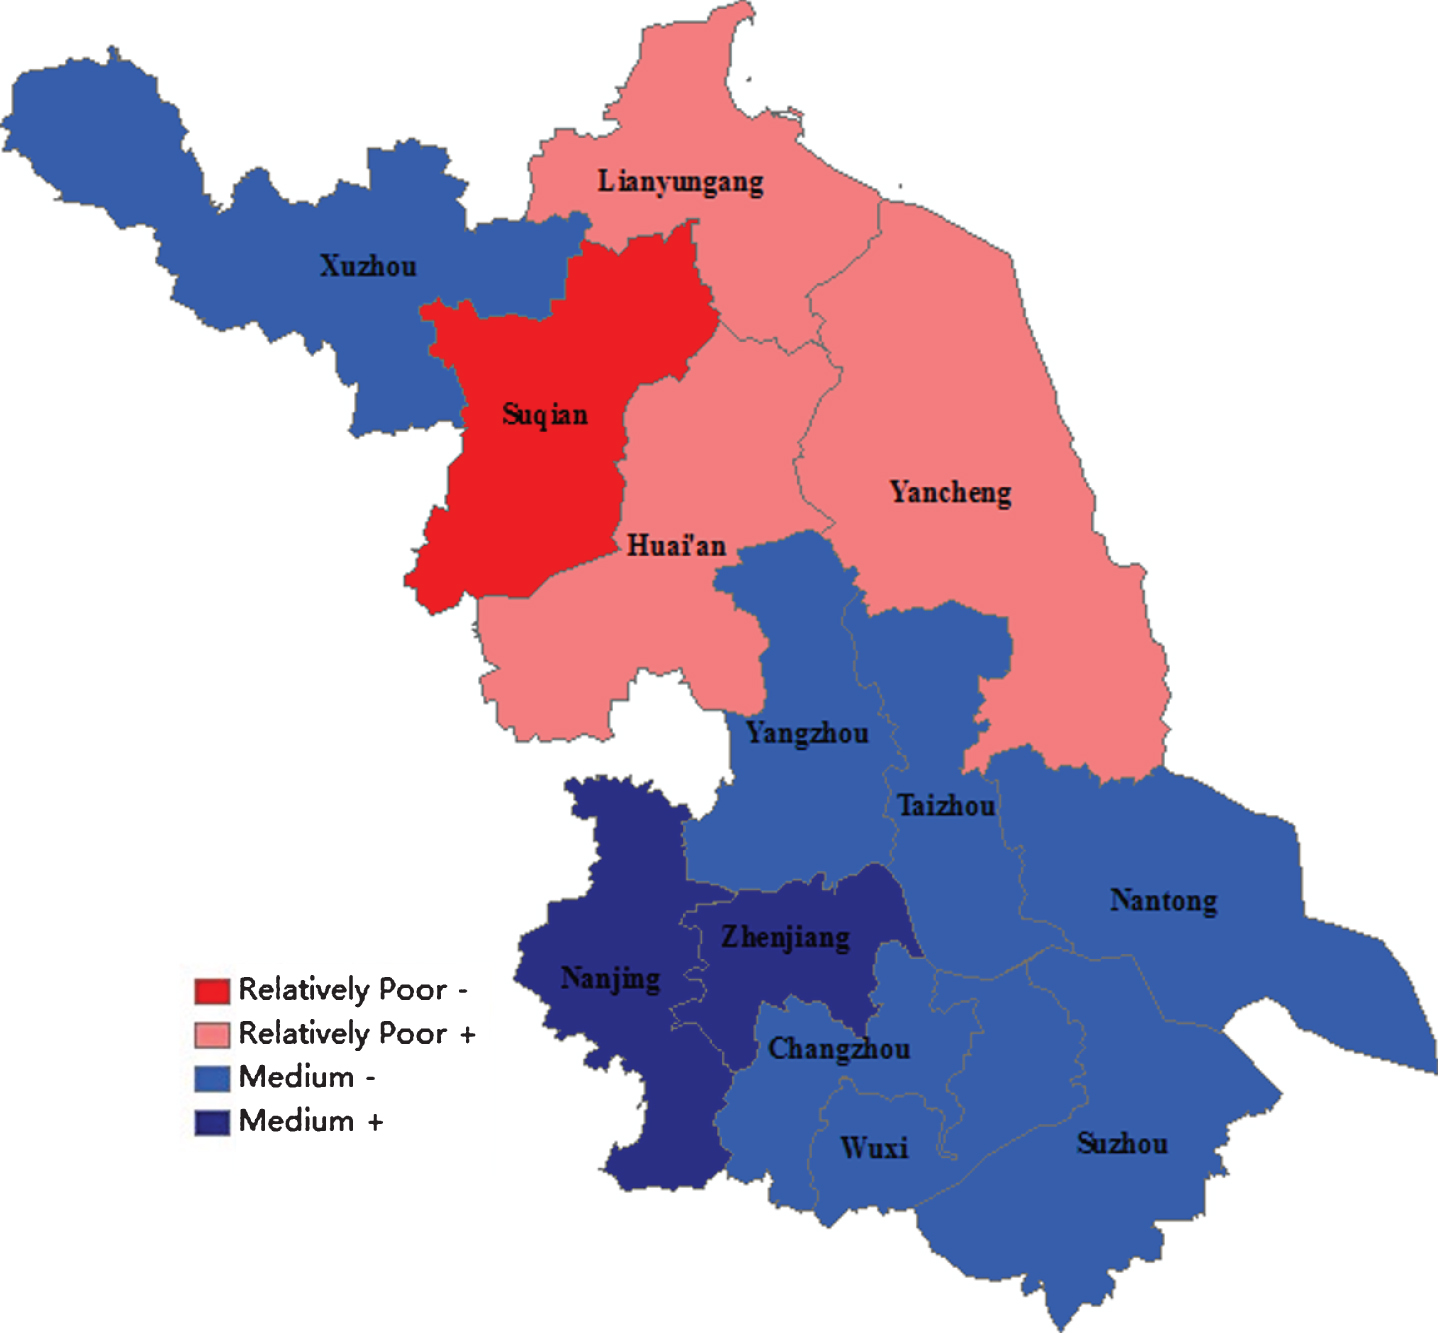
Sustainability Transition Performance of Urban Transportation.
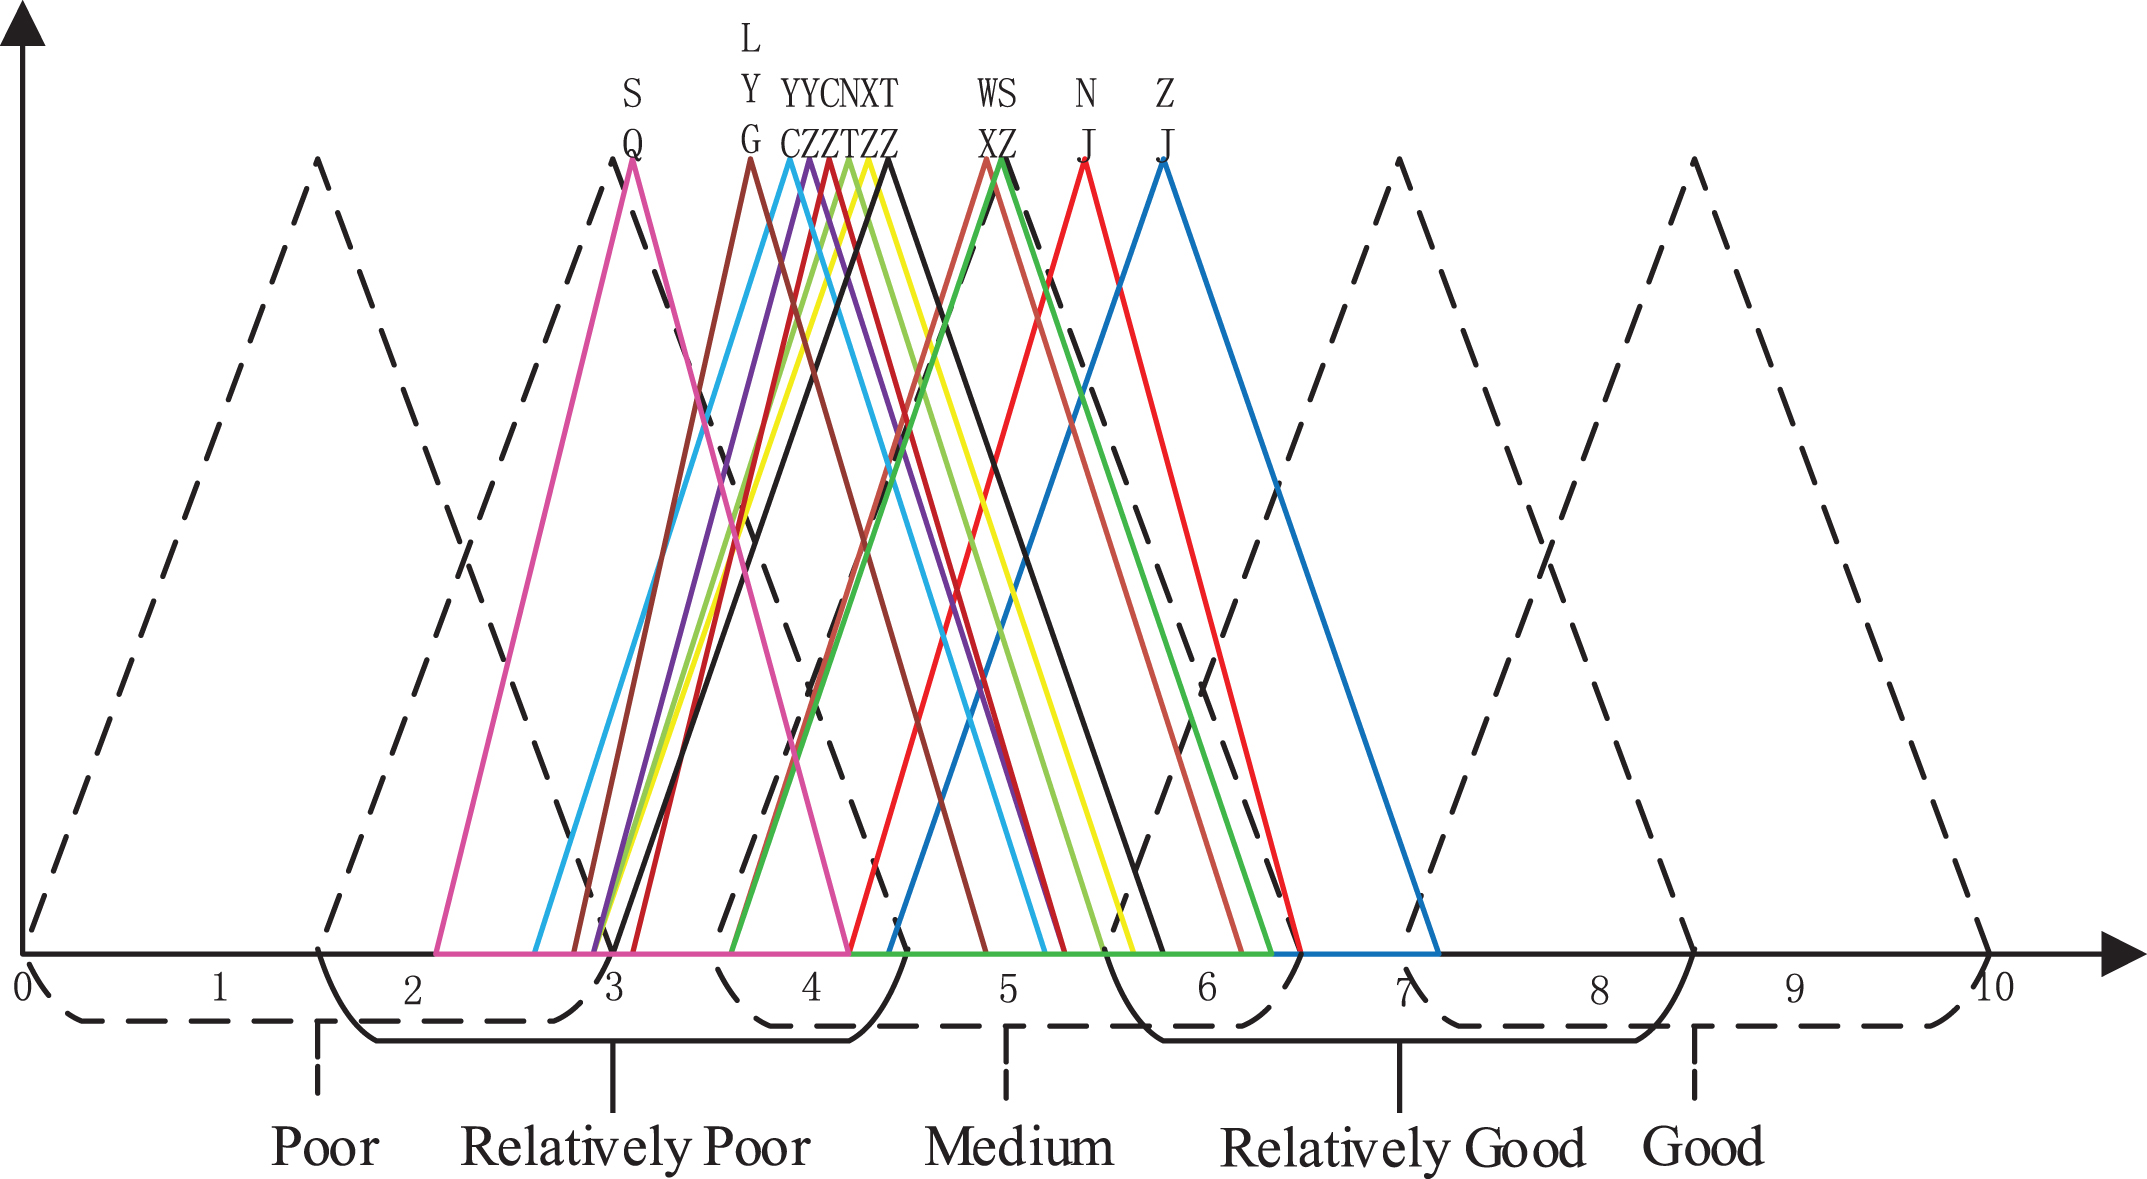
The fuzzy number scores of Yancheng and Huai’an are almost the same. Considering that there are more overlaps with Yancheng’s triangular line, Huai’an has not drawn it in Figure 4. And the city acronym is used in this figure.
Indicators score of Second-level
Figure 5 shows the score distribution of second-level indicators. From the x-axis of macro landscape, Suqian and Nantong score lower. Lianyungang and Suqian scores are smaller than other cities in the y-axis of meso regime. From the z-axis of micro niche, only Zhenjiang, Suzhou and Wuxi score higher, and other cities are lower. Among these cities, Zhenjiang has the highest score at the three levels, while Suqian is the lowest of all scores.

Indicators Scores of Second-level.
As shown in Fig. 6, in the macro landscape S1 level, Nanjing and Taizhou score the highest, followed by Lianyungang and Huai’an, while Suqian and Nantong score the lowest. In the meso regime S2 level, Nanjing is the most advanced, followed by Zhenjiang and Nantong, while Yancheng has the lowest score (see Fig. 7). In terms of micro niche S3 level, Zhenjiang, Suzhou and Wuxi have the best development. Nanjing and Nantong rank second, while Taizhou, Suqian, Huai’an and Lianyungang score relatively low (see Fig. 8).
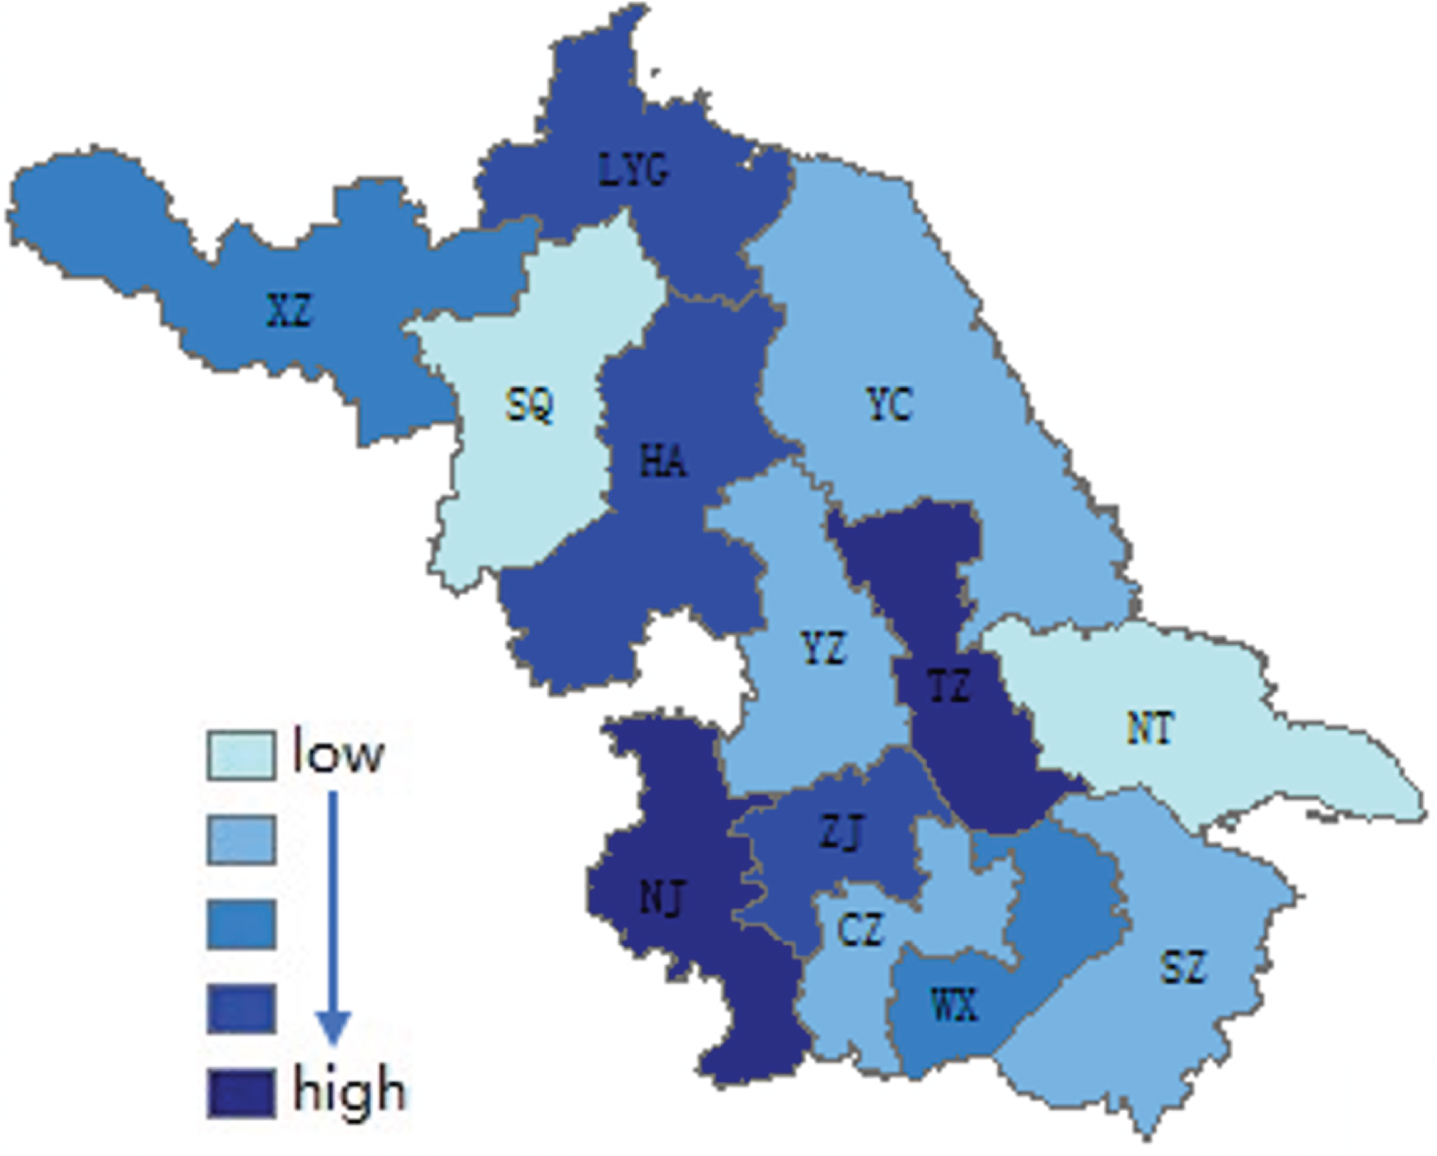
Macro Landscape.
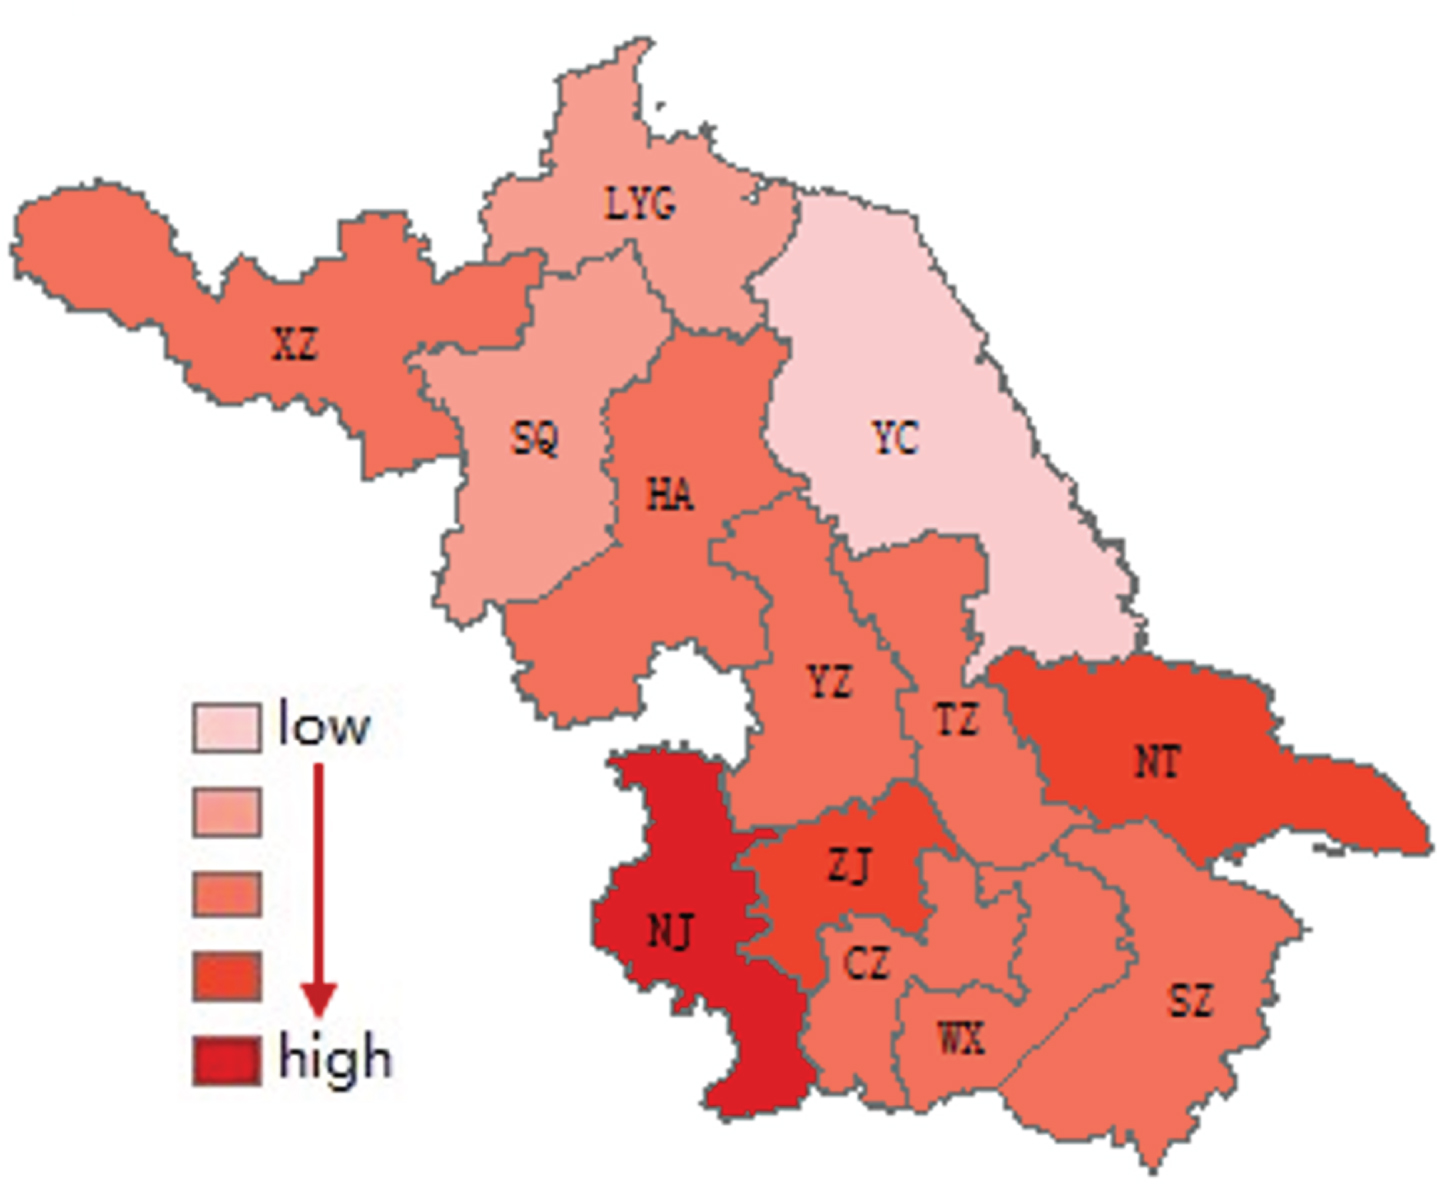
Meso Regime.
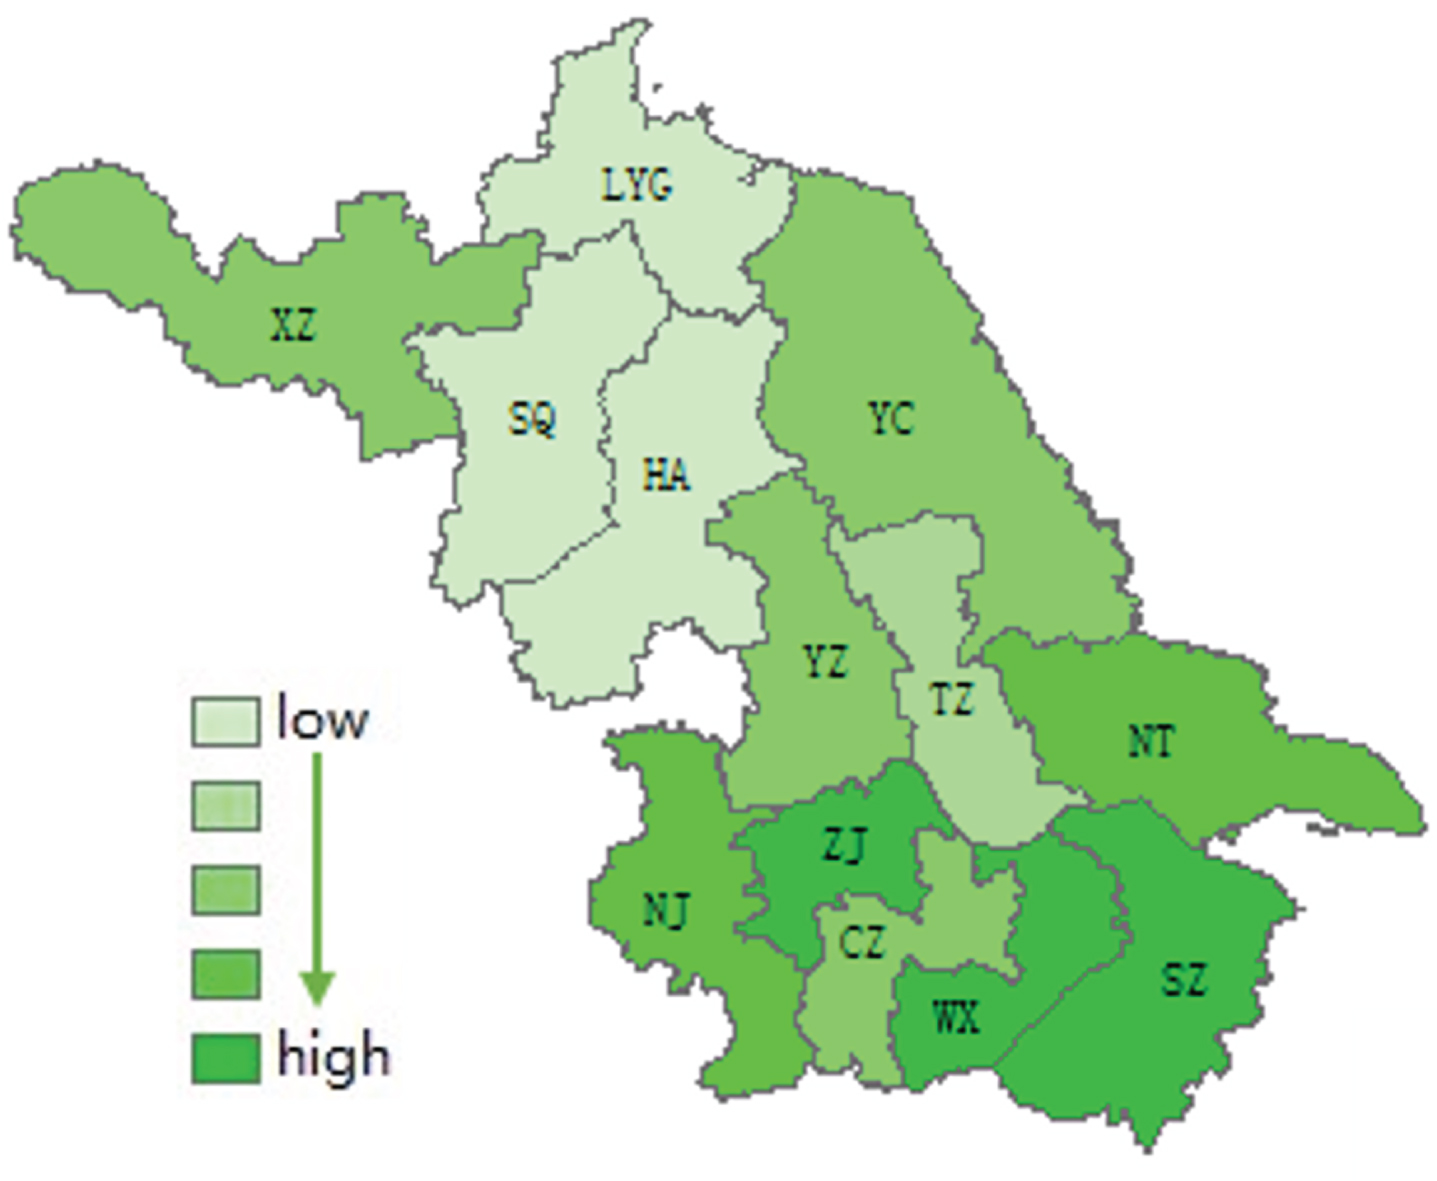
Micro Niche.
Figure 9 depicts a longitudinal overview of the prefecture cities in Jiangsu Province in three levels of macro landscape, meso regime and micro niche, among which Zhenjiang has the most balanced development in three aspects. Compared with the macro landscape and meso regime indicators, the development of micro niche in Jiangsu Province is generally poor, which is the key to the sustainability transition of urban transportation. From the analysis of the second-level indicators, Suqian should pay attention to the development of indicators in the macro landscape and the micro niche level. Nantong needs to promote the macro landscape level, and the development of Yancheng in the meso regime level needs to be improved, while Taizhou, Huai’an and Lianyungang needs to focus on developing micro niche to promote the sustainability transportation transition.
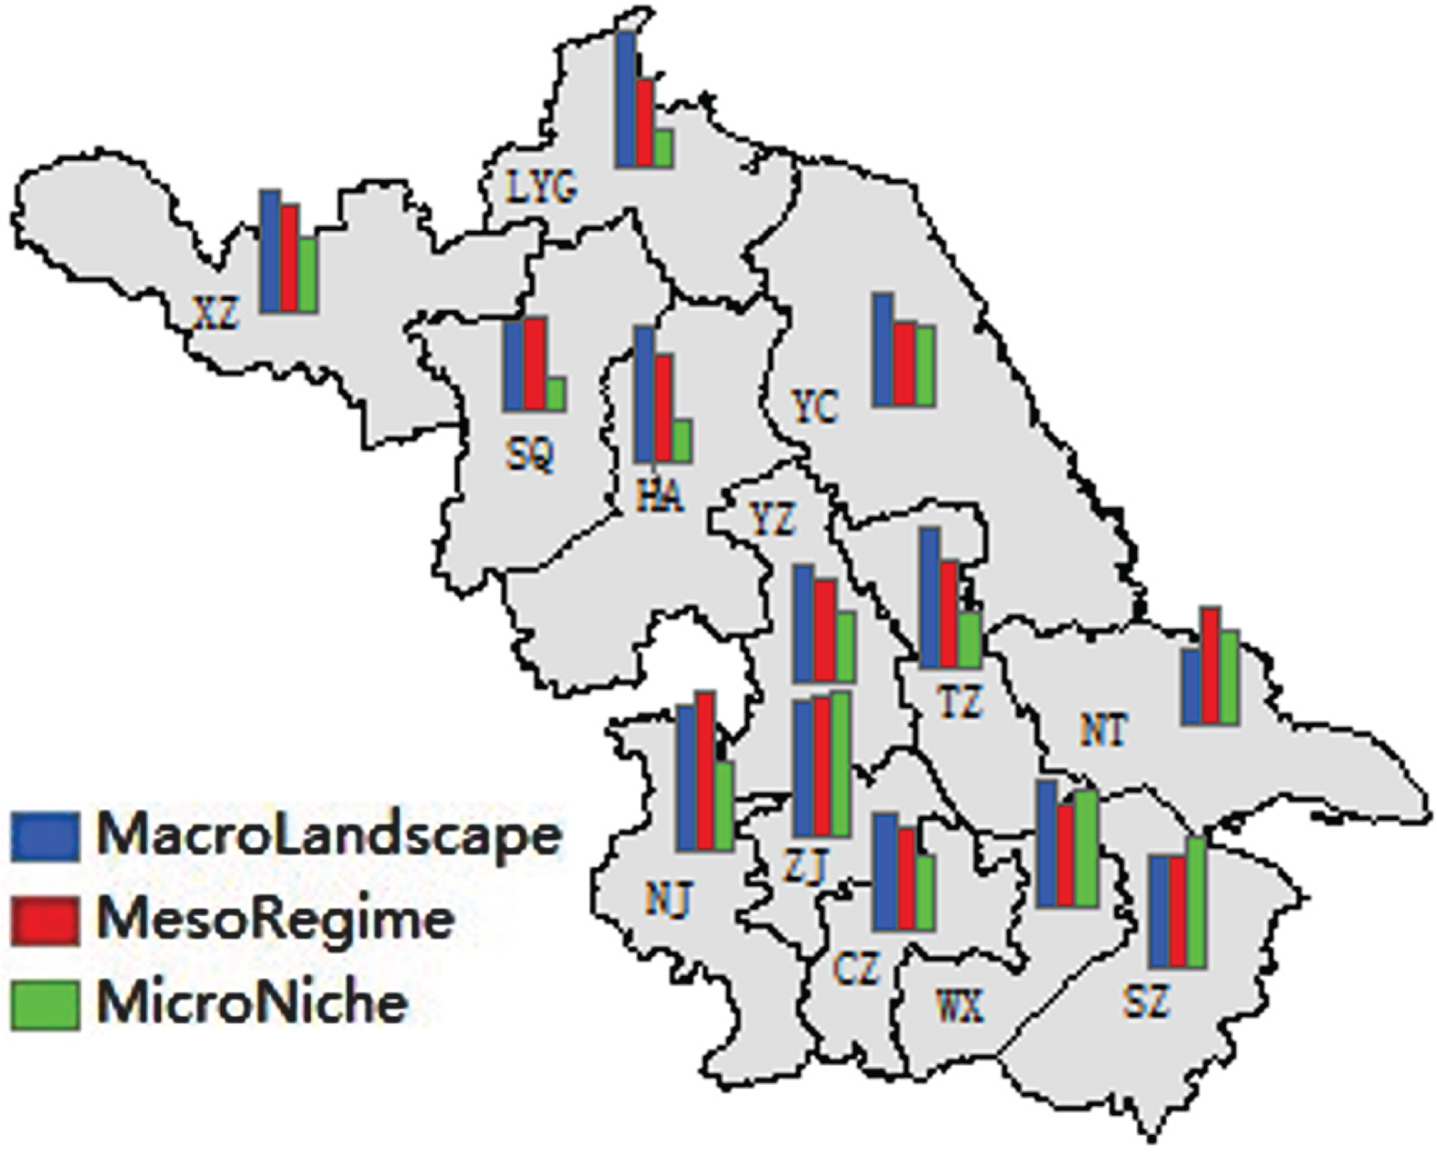
General View.
The third-level indicators, as the transition indicators of the second and fourth-level indicators, play a less significant guiding role. Thus, there is no detailed calculation here, and overall analysis of the fourth-level indicators that affect the performance of the transition directly are developed. According to the fuzzy logic method, the score IS ijk of each indicator is calculated (see Table A5). As indicated in Table A5, the average score of the fourth-level indicators of 13 cities is 1.02. There ‘1’ is used as the threshold to define the specific indicators that need to pay more attention in the transition process of urban transportation. Corresponding indicators less than the threshold ‘1’ need to be improved, while those more than ‘1’ are considered to have better scores in the current. Then, sensitivity analysis is performed on these indicators that less than the threshold ‘1’. Numerical results are presented in Table 7.
Sensitivity Analysis of Indicators Needing to Develop (%)rmbox2
Sensitivity Analysis of Indicators Needing to Develop (%)rmbox2
rmbox2Indicators with higher sensitivity ranking in the top 20% are marked with *in the upper right corner.
The last row in Table 7 points out the total number of cities in the indicator where the sensitivity is in the top 20%. Combined with Fig. 10, Figs. 11 and 12, the sensitivity variability of each indicator can clearly be seen. In macro landscape level, the sensitivity of proportion of land used in transportation facilities S124 and greenhouse gas emissions per 10000 people S131 the two indicators is higher, while the other indicators are less different. Sensitivity fluctuation of indicators in meso regime level is small, and only comprehensive policy S231 one indicator has high sensitivity. In micro niche level, the overall sensitivity of each indicator is high and there is no peak. From the perspective of cities, the sensitivity of the number of public bicycles per 10000 people S321 and pavement per capita S322 indicator is more prominent and needs to be taken seriously.
Evaluation of urban transportation sustainability transition is of great significance for understanding the status quo of urban transportation transition, evaluating the stage of transition development, identifying the obstacles of transportation transition, and formulating targeted transition policies and measures. The multi-level perspective theory is combined with sustainable development to analyze the transition process of urban transportation. And then a set of indicators are put forward for evaluating the performance of urban transportation transition. Triangular fuzzy logic method is selected to execute the evaluations of 13 cities in this paper. Based on the evaluation results, indicators that each city needs to be improved to promote sustainable transportation transition are also identified.
The results of transportation transition evaluation of 13 cities in Jiangsu province show that: (i) Most cities’ transition effect is in ‘medium’ stage, and the score order is Zhenjiang, Nanjing and Suzhou, Wuxi, Taizhou, Xuzhou, Nantong, Changzhou and Yangzhou, among which Zhenjiang, Nanjing, Suzhou and Wuxi have significantly higher transition performance scores than other cities; (ii) In the four cities of ‘relatively poor’ transition effect, the order is Yancheng, Huai’an, Lianyungang and Suqian, in which the score of Yancheng and Huai’an is almost the same; (iii) Micro niche level is the weakest link in the development of urban transportation transition, followed by the meso regime level. The growth of micro niche and the guidance of market and policy play a vital role in the urban transportation towards a more sustainable development stage. The construction of niche infrastructure and the improvement of relevant government policies and regulations will effectively promote the growth of niche.
According to the evaluation results, key measures of urban transportation towards sustainable transition include two parts: (i) Adequate infrastructure support should be put on the innovation niches of urban transportation, such as increasing the length of public transport operation lines, strengthening the construction of slow traffic and new energy facilities, increasing the number of bus (electric) vehicles and pavement area to guide residents’ public transport travel, speeding up the popularization and application of new energy vehicles and the construction of new energy transportation infrastructure; (ii) Detailed implementation policies should be developed to guide the development of innovation niches, such as reducing the price of public transport, increasing green travel publicity, giving new energy vehicles licensing and parking concessions, formulating incentive policies for emission reduction, surcharging for fuel vehicles.
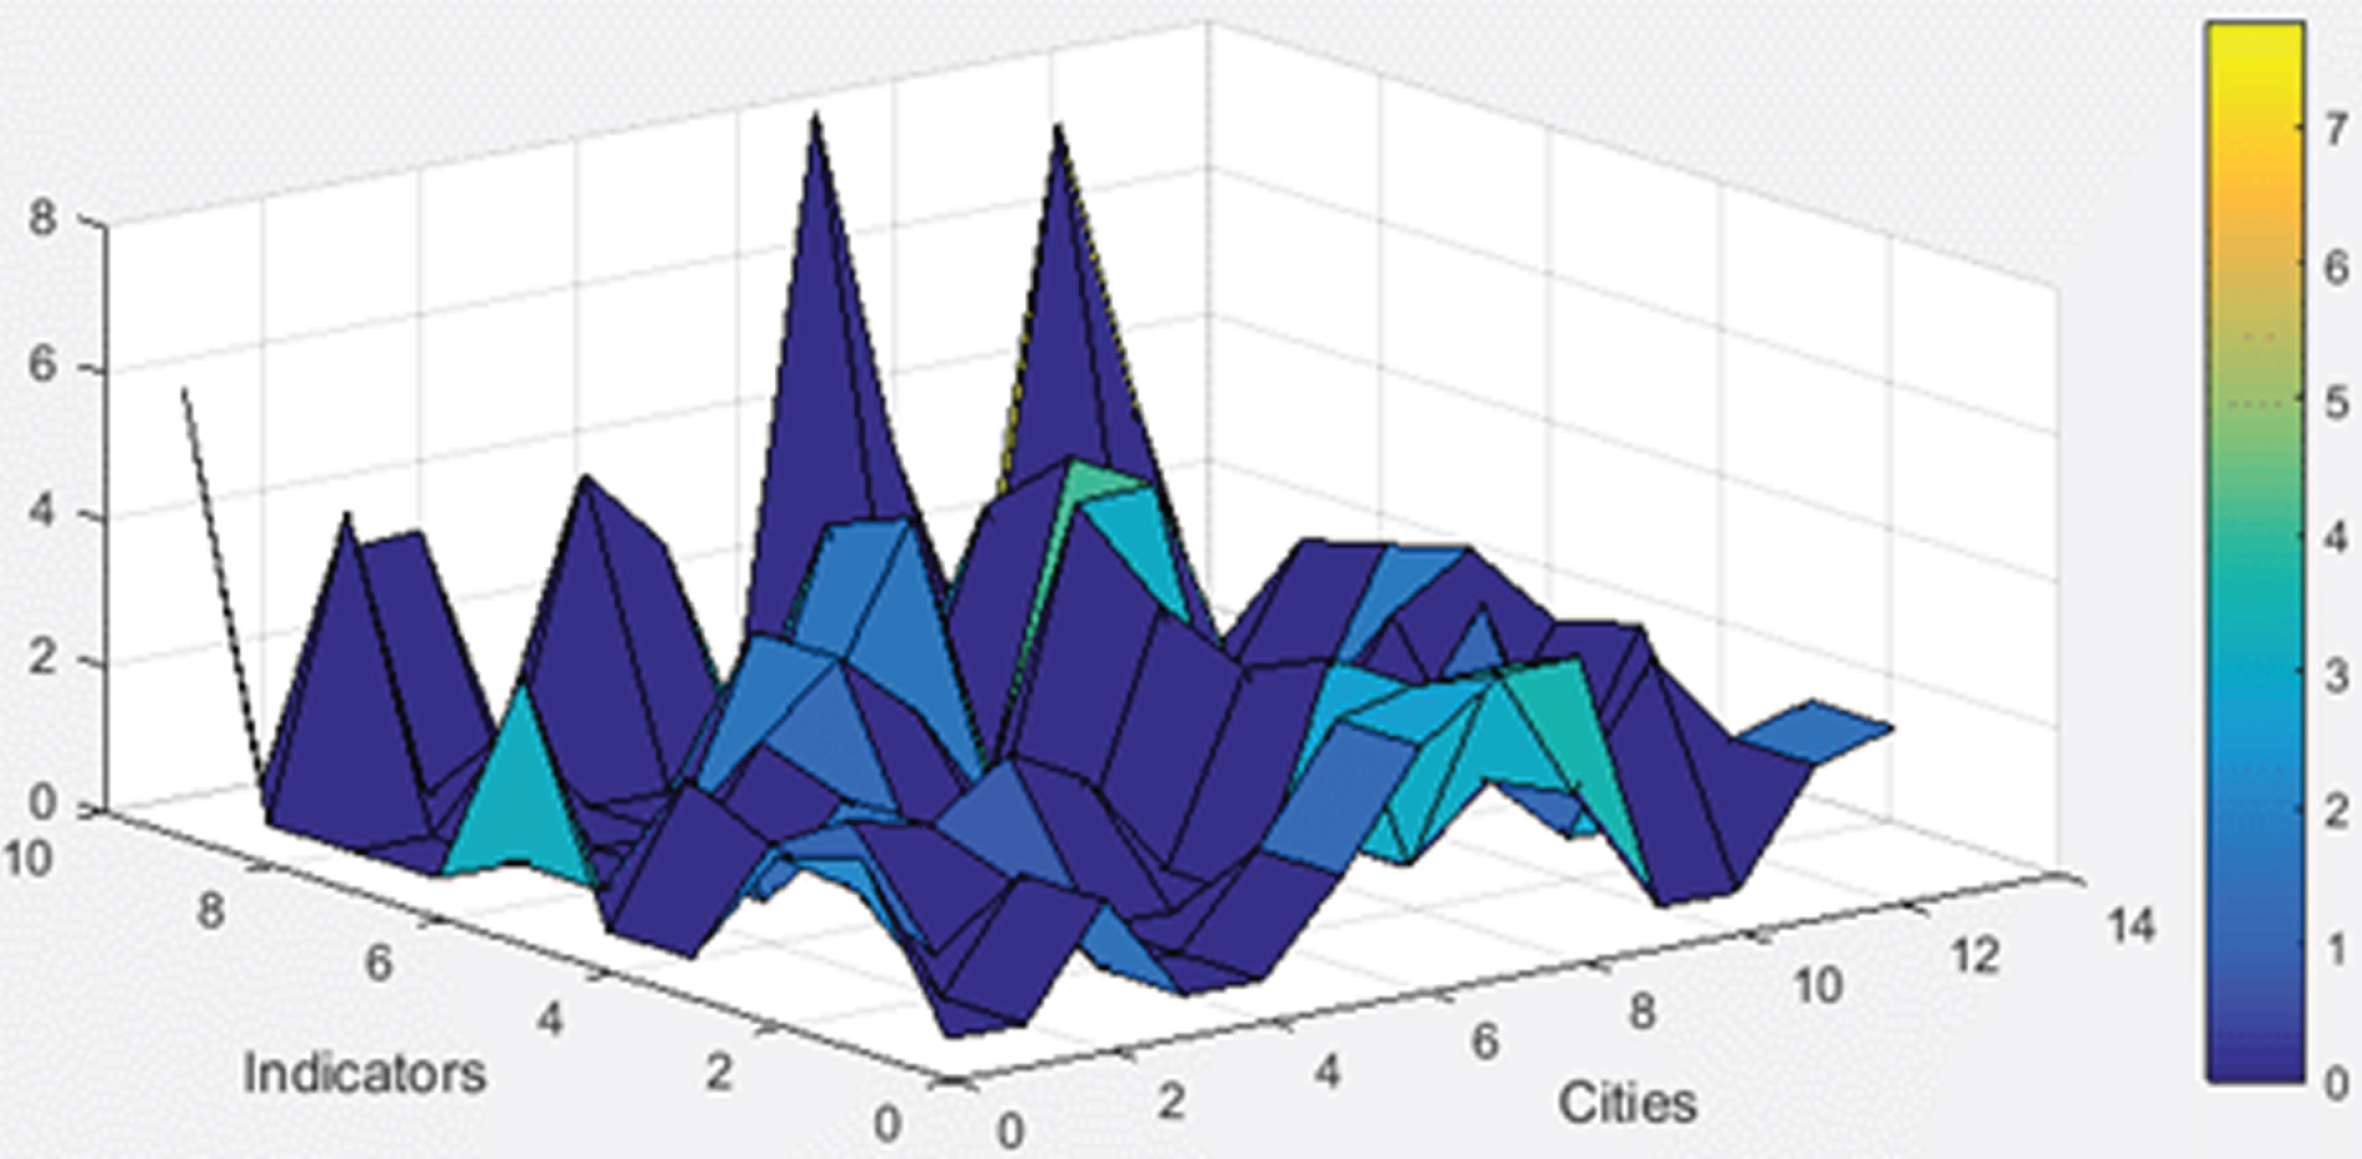
Sensitivity of Indicators in Macro Landscape.
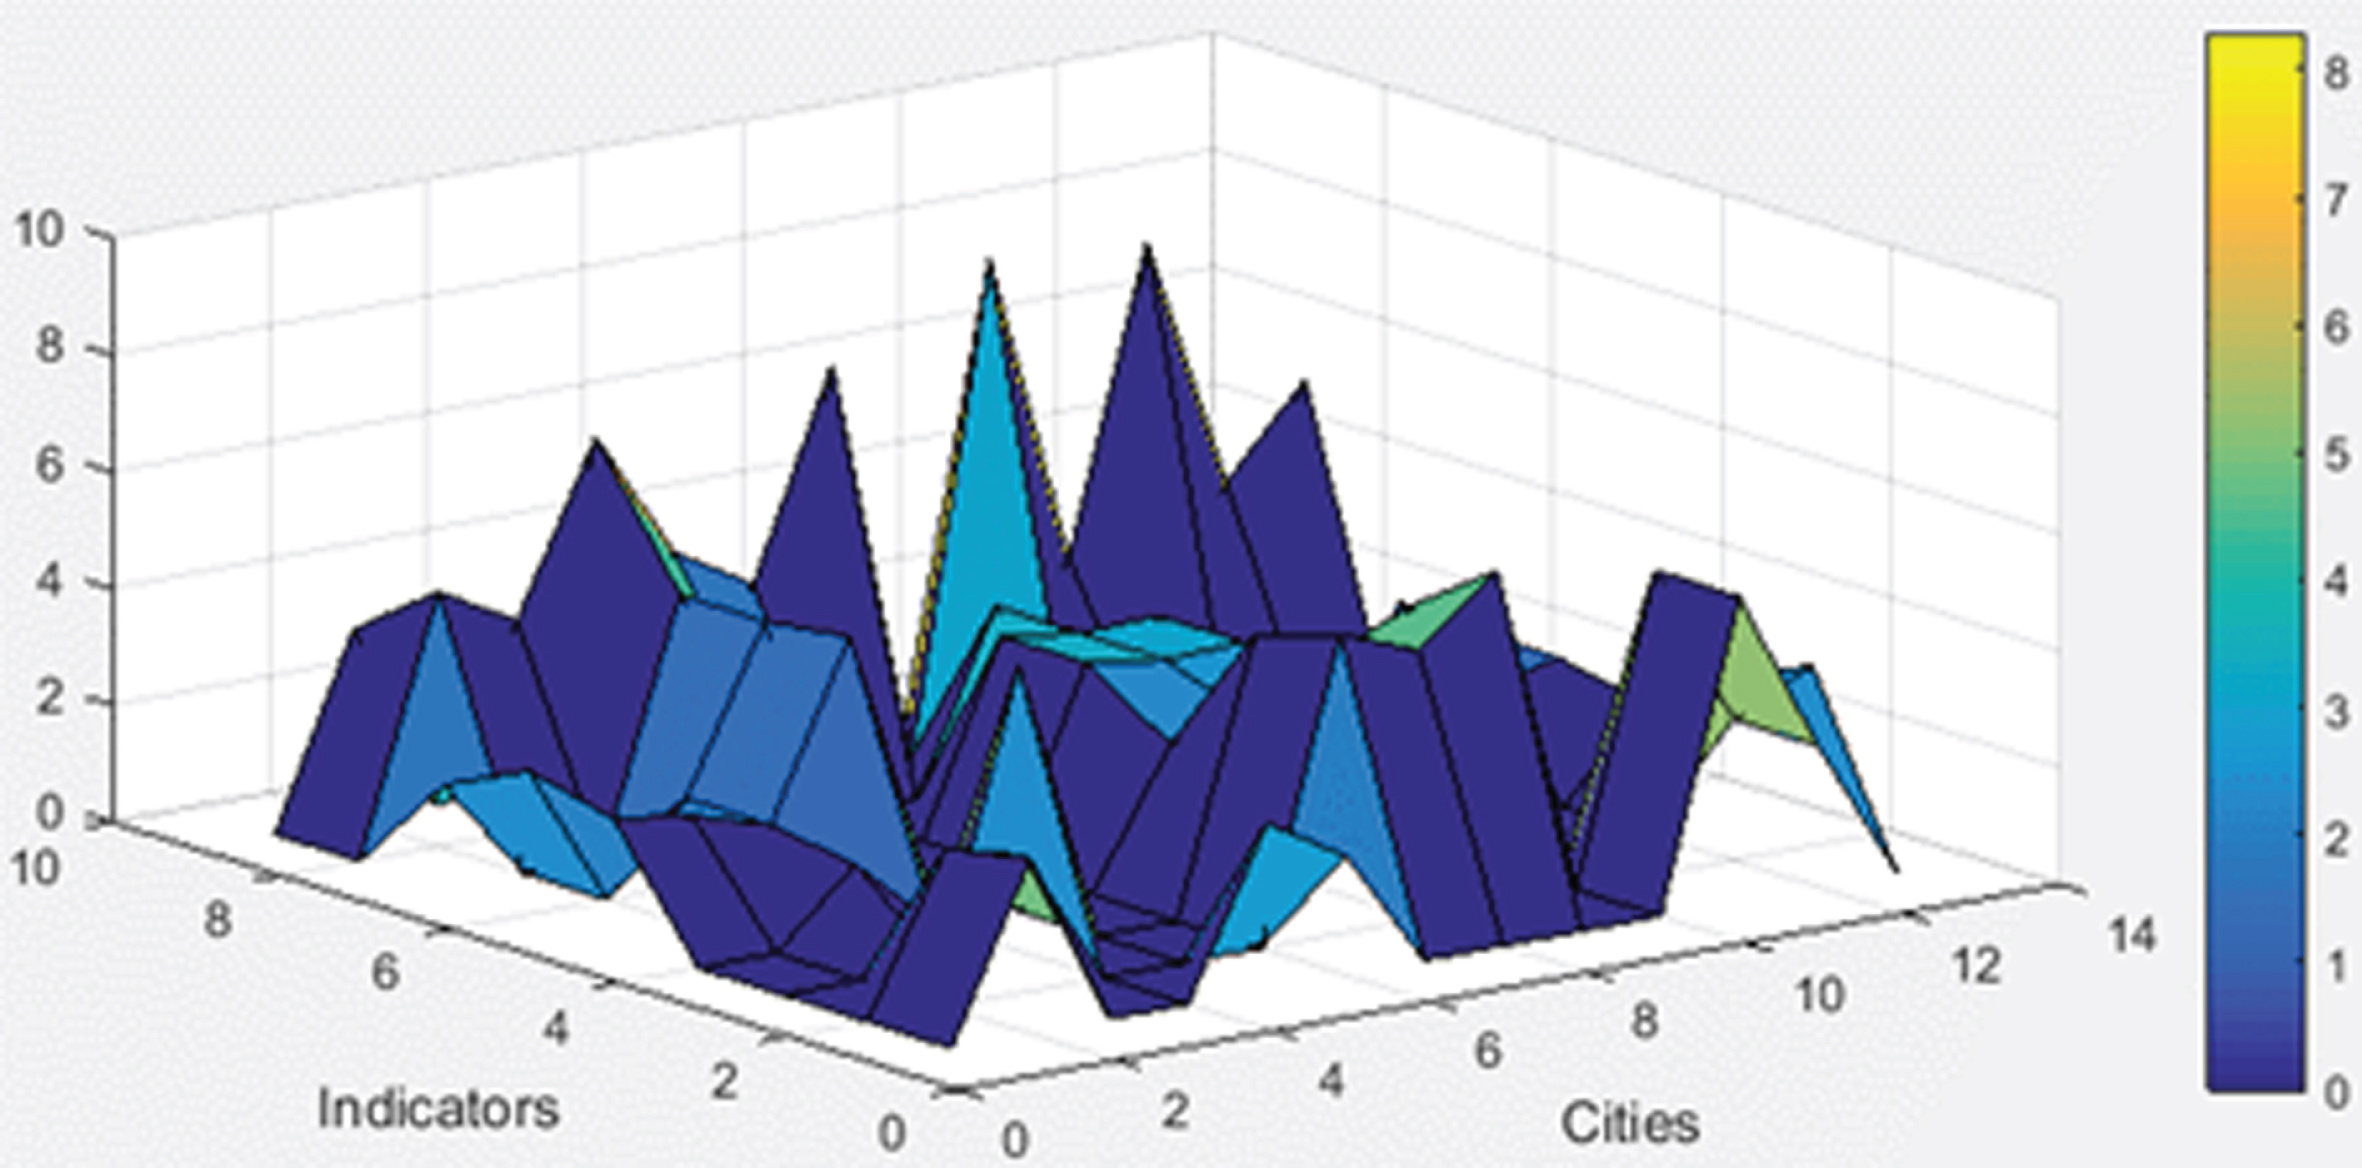
Sensitivity of Indicators in Meso Regime.

Sensitivity of Indicators in Micro Niche.
Most of the existing research is quantitative based on the theory of sustainable development. The indicators of this paper mainly depends on the multi-level perspective theory of socio-technical system. By quantifying the qualitative indicators, the qualitative and quantitative methods are better combined, and the research fields of multi-level perspective theory and fuzzy logic method in urban transportation transition are widened.
This paper is a lateral study which can also applies to other cities. In future studies, longitudinal studies related to years can be considered to help us better understand the transition process of urban transportation. Adding the transition pathways, including transformation, technological substitution, reconfiguration, de-alignment and re-alignment, into the transition evaluation is also a good research direction, and the practical transition curve of each city can be fitted well according to the four transition pathways.
Data availability
The data used to support the findings of this study are available from the corresponding author upon request.
Conflicts of interest
The authors declare no conflicts of interest.
Footnotes
Appendix A
Score of Fourth-level Indicators in Each City
| Sijk | NJ | WX | XZ | CZ | SZ | NT | LYG | HA | YC | YZ | ZJ | TZ | SQ |
| S111 | 1.57 | 1.57 | 0.93 | 1.57 | 1.86 | 0.93 | 0.09 | 0.37 | 0.37 | 1.57 | 1.86 | 0.93 | 0.09 |
| S112 | 0.93 | 1.25 | 0.65 | 1.25 | 1.86 | 0.93 | 0.09 | 0.09 | 0.93 | 0.65 | 0.93 | 0.65 | 0.09 |
| S113 | 0.17 | 0.17 | 3.26 | 0.17 | 1.15 | 2.20 | 1.65 | 0.65 | 1.65 | 0.65 | 1.65 | 2.75 | 2.20 |
| S114 | 1.86 | 0.09 | 0.93 | 0.93 | 0.37 | 0.65 | 1.25 | 0.93 | 1.25 | 0.65 | 0.09 | 1.86 | 0.37 |
| S121 | 3.26 | 0.65 | 2.75 | 0.17 | 2.20 | 2.20 | 2.75 | 0.17 | 1.65 | 1.15 | 1.15 | 3.26 | 0.17 |
| S122 | 0.65 | 1.57 | 1.86 | 0.65 | 0.65 | 0.09 | 1.86 | 0.65 | 0.93 | 0.09 | 1.57 | 0.09 | 0.37 |
| S123 | 1.86 | 1.25 | 1.25 | 1.86 | 0.93 | 0.09 | 0.93 | 1.86 | 0.93 | 1.86 | 1.57 | 1.25 | 0.09 |
| S124 | 2.20 | 3.26 | 0.17 | 1.15 | 1.65 | 2.20 | 0.65 | 1.15 | 0.17 | 1.15 | 2.20 | 1.65 | 0.17 |
| S131 | 1.25 | 0.65 | 1.25 | 1.57 | 0.09 | 0.09 | 1.57 | 1.86 | 1.25 | 1.57 | 0.65 | 0.93 | 1.25 |
| S132 | 0.65 | 1.25 | 0.09 | 0.37 | 1.25 | 0.65 | 1.25 | 1.86 | 0.93 | 0.65 | 1.25 | 1.57 | 1.86 |
| S211 | 1.57 | 0.65 | 1.25 | 1.57 | 0.09 | 0.09 | 1.57 | 1.86 | 1.25 | 1.57 | 0.65 | 0.93 | 1.25 |
| S212 | 1.86 | 0.93 | 0.65 | 1.57 | 1.25 | 1.57 | 0.65 | 0.09 | 0.65 | 1.86 | 0.93 | 0.37 | 0.93 |
| S213 | 2.75 | 1.65 | 2.20 | 0.65 | 2.20 | 1.15 | 0.65 | 0.17 | 0.65 | 1.65 | 3.26 | 2.20 | 0.17 |
| S221 | 1.65 | 3.26 | 0.65 | 1.15 | 1.65 | 1.65 | 0.17 | 0.17 | 0.17 | 0.65 | 1.65 | 1.15 | 0.17 |
| S222 | 0.09 | 0.65 | 0.37 | 0.65 | 1.86 | 1.57 | 0.37 | 0.09 | 0.09 | 0.09 | 0.65 | 0.65 | 0.93 |
| S223 | 0.93 | 1.25 | 0.65 | 0.09 | 1.86 | 1.57 | 0.37 | 0.09 | 0.09 | 0.09 | 1.57 | 0.37 | 0.09 |
| S224 | 0.17 | 1.65 | 1.65 | 0.65 | 0.65 | 3.26 | 1.15 | 0.65 | 1.15 | 1.15 | 2.75 | 2.20 | 1.65 |
| S231 | 1.86 | 0.93 | 0.65 | 0.65 | 0.09 | 0.37 | 0.09 | 1.25 | 0.09 | 0.09 | 0.93 | 0.93 | 0.37 |
| S232 | 1.65 | 0.17 | 2.20 | 1.65 | 2.20 | 2.20 | 3.26 | 3.26 | 3.26 | 2.20 | 2.20 | 2.20 | 2.75 |
| S311 | 0.65 | 1.15 | 2.20 | 0.65 | 1.15 | 0.17 | 1.15 | 3.26 | 1.15 | 1.15 | 0.65 | 1.15 | 1.65 |
| S312 | 1.86 | 1.25 | 0.65 | 0.37 | 1.57 | 0.37 | 0.09 | 0.09 | 0.09 | 0.37 | 1.25 | 0.37 | 0.09 |
| S313 | 0.37 | 1.86 | 0.37 | 0.65 | 0.93 | 0.93 | 0.09 | 0.09 | 0.09 | 0.37 | 1.25 | 0.65 | 0.09 |
| S321 | 0.65 | 1.86 | 0.65 | 0.09 | 0.93 | 0.37 | 0.09 | 0.09 | 0.65 | 0.93 | 0.65 | 0.09 | 0.37 |
| S322 | 0.37 | 0.37 | 0.37 | 0.09 | 1.25 | 1.86 | 0.65 | 0.65 | 0.93 | 0.37 | 0.93 | 0.93 | 0.09 |
| S331 | 0.37 | 0.65 | 0.65 | 0.09 | 0.37 | 0.93 | 0.37 | 0.09 | 1.57 | 0.37 | 1.86 | 0.37 | 0.37 |
| S332 | 0.65 | 0.65 | 0.65 | 1.86 | 1.25 | 0.65 | 0.09 | 0.09 | 0.37 | 0.37 | 1.57 | 0.37 | 0.09 |
| S333 | 0.93 | 0.09 | 0.37 | 1.86 | 1.25 | 0.65 | 0.65 | 0.09 | 0.65 | 0.93 | 1.57 | 0.09 | 0.37 |
Acknowledgments
This study is supported by the Humanities and Social Sciences Planning Project of the Ministry of Education (16YJA790037), Social Science Foundation of Jiangsu Province (16JD007), and Key Program of Philosophy and Social Science of Jiangsu Education Department (2017ZDTXM022).