
Abstract
In online social networks (OSNs), socialbots are responsible for various malicious activities, and they are mainly programmed to imitate human-behavior to bypass the existing detection systems. The socialbots are generally successful in their malicious intent due to the existence of OSN users who follow them and thereby increase their reputation in the network. Analysis of the socialbot networks and their users is vital to comprehend the socialbot problem from target users’ perspective. In this paper, we present a machine learning-based approach for characterizing and detecting socialbot targets, i.e., users who are susceptible to be trapped by the socialbots. We model OSN users based on their identity and behavior information, representing the static and dynamic components of their personality. The proposed approach classifies socialbot targets into three categories viz. active, reactive, and inactive users. We evaluate the proposed approach using three classifiers over a dataset collected from a live socialbot injection experiment conducted on Twitter. We also present a comparative evaluation of the proposed approach with a state-of-the-art method and show that it performs significantly better. On feature ablation analysis, we found that network structure and user intention and personality related dynamic features are most discriminative, whereas static features show the least impact on the classification. Additionally, following rate, multimedia ratio, and follower rate are most relevant to segregate different categories of the socialbot targets. We also perform a detailed topical and behavioral analysis of socialbot targets and found active users to be suspicious. Further, joy and agreeableness are the most dominating personality traits among the three categories of the users.
Introduction
Twitter, a popular microblogging service, allows its users to connect with friends, celebrities, and politicians to get the subscription of their views on events, personal life updates, etc. in real-time. Unlike other online social networks (OSNs) that are mainly used for entertainment, Twitter is generally used to discuss the current political scenarios, local and global news stories, and to get updated about the personal life events and views of the global leaders and celebrities. On Twitter, a user follows others to get the subscription of their activities and content. Benign users generally use OSNs for legit reasons. But, open nature, real-time message broadcasting, anonymity, and easy to use functionalities have made OSNs suitable for malicious users and their activities. Such malicious users are creating novel and sophisticated problems, such as astroturfing, fake news, and propaganda [16, 35] which are significantly different from the conventional problems like spamming and malware injection [15, 26] in terms of sophistication level, scalability, and robustness. The socialbots are such malicious users, and they are the source of the problems for both social media service providers and network users. Socialbots are OSN profiles operated by a computer program which mimic human behavior to resemble real human beings. Socialbots are programmed to deceive benign users to follow them in order to build trust and reputation in the network. To this end, they exploit the homophily phenomenon to attract other similar users or those who abruptly follow anyone without verification. The existing literature has reported various studies conducted in different OSNs to analyze the potential of socialbots to influence user behavior and manipulate the network structure [1–3]. In a seminal work, Boshmaf et al. [1] conducted a socialbot injection experiment on Facebook and observed that 80% of friend requests from socialbots are accepted by the recipients when they have mutual friends. The authors also analyzed the economic feasibility of operating socialbots for the large-scale infiltration attacks.
Motivation
The existing literature has feature-engineering, graph-partitioning, and behavior modeling-based detection methods to tackle the challenging problem of socialbot detection in different OSNs [4–6, 47]. Researchers have also presented community-level decision making and malicious campaign detection approaches [43, 46]. As the approaches get mature, socialbots also evolve to evade the detection methods [8]. Although, detection of socialbots and other malicious profiles is important, characterization and identification of users who are susceptible to these malicious profiles are also important from the security perspective of both OSNs and their users. Since the susceptible users facilitate the reputation building process of the socialbots by following them, their profiling is an important research problem. The characterization and identification of such users can help the OSNs to keep the users alarmed about the repercussions of their behavior and alert them while accepting/initiating connections from/with unknown/suspicious users. In the existing literature, the problem of profiling susceptible users is understudied. In the first work of this kind, Wanger et al. [9] presented a machine learning approach for classifying the susceptible and non-susceptible users. They utilized linguistic, network, and behavior-based features to characterize the two categories of the users. Wald et al. [10] modeled the Twitter users who either interacted (followed the socialbot) or replied to the socialbot (communicated through tweets). They used personality, linguistic, and demographic features to train different classification models for segregating the two categories of the users. However, to the best of our knowledge, no existing approach models Twitter users based on their connection formation behavior with the socialbots. Therefore, in this study, we categorize Twitter users into three categories – active, reactive, and inactive users. Moreover, we model it as both ternary and binary classification problems to analyze the difference in the working behavior of the active and reactive susceptible users, and their impact on the trained classification models. We use personality and emotion-based features, which are robust and efficient and never used in the existing literature for susceptible user profiling. We could have modeled this problem using a deep learning method exploiting the network and word embeddings [45], but it may not be effective due to small dataset.
Contributions
This work is an extension of our initial study published in a conference proceedings [11]. The substantial extension from the conference version includes – (i) a detailed description of the identified features, (ii) comparative performance evaluation with a state-of-the-art method for both binary and ternary classifications, (iii) Feature ablation analysis to investigate the discriminative power of different feature categories, and (iv) a detailed analysis to observe behavioral differences among the three categories of the users. In brief, we characterize three categories of OSN users based on their identity and behavioral characteristics, such as (i) who they are?, and (ii) what they tweet? The profile of a Twitter user consists of two types of information. The first category of information is identity-related information which includes name, age, and Twitter handle. These information either do not change or hardly change over time. The second category of information represents the online behavior of a user, which is generally dynamic. It includes tweets count, followers count, topic distribution, emotion distribution, and so on. We divide all characterizing features into two categories – static and dynamic, representing the two behavioral components of a user profile. Further, using the extracted features, three machine learning classifiers are trained to classify the users into active, reactive, and inactive categories. We perform a feature ablation analysis to observe the classification power of each feature category. We also identify the dominant features using a set of two feature selection and ranking algorithms. Finally, we investigate the tweets corpora and other behavior of three categories of users to identify their topical distribution, suspicious behavior, and tone. In short, the main contributions of this paper can be summarized as follows. A novel study that categorizes the Twitter users into three categories – active, reactive, and inactive users, based on their connection formation behavior with the socialbots. Modeling the characterization and detection of susceptible users, both as a ternary and a binary classification problem to know the impact of difference in the working behavior of active and reactive users. Identification of robust and efficient features for effective profiling of susceptible users and a description of the identified features. An extensive empirical analysis of the features to get insights regarding different behavioral aspects of the active, reactive, and inactive users.
The rest of the paper is organized as follows. Section 2 presents a brief review of the literature on profiling of users who are susceptible to socialbots. Section 3 presents the problem definition and some of the preliminary concepts. Section 4 presents a detailed description of the identified features. Section 5 presents experimental setup and evaluation results, including a comparative performance evaluation with one of the state-of-the-art methods. Section 6 presents an analysis of the users to investigate their behavioral characteristics like topical distribution, malicious behavior, and emotions embedded in text. Finally, section 7 summarizes the paper with concluding remarks.
Related works
Online social networks and socialbots
Since inception, OSNs are facing various cyber threats and issues in the form of spamming, identity theft, cyberbullying, fake news, and so on [12–15]. Adversaries conduct such malicious activities using various forms of fake profiles like sock puppets, and Sybil. Socialbots are also a type of malicious profiles, mainly designed and deployed in OSNs to perform astroturfing, spamming, spear phishing, and so on. In the existing literature, researchers have conducted various experiments to observe and analyze the socialbots’ behavior, their infiltration and manipulation efficacy to pollute the OSNs, and other behavioral impacts [3, 17]. In such an experiment on
Profiling and detection of socialbot targets
A user profile is a set of information which characterizes the user, whereas user profiling is the process of identification and modeling of those information to characterize the user [20]. OSNs generate a massive amount of data, and it facilitates the researchers to perform various interesting analytical problems, such as human behavior analysis, interest tag identification, and so on [48]. Researchers are also using OSN data to track malicious activities and underlying users. The existing literature has user profiling strategies for the characterization and detection of different types of malicious entities, such as spammers, sock puppets, and socialbots. Oentaryo et al. [21] presented a feature engineering-based approach to classify the Twitter users into broadcaster, consumor, and spambots. Pennacchiotti et al. [22] used linguistic and profile-based features to predict the users political orientation and ethnicity. The authors also investigated the topical distribution of users content to observe their interest. Esparza et al. [23] presented a profiling approach to filter user timelines based on their interests. The authors also modeled users’ interest by analyzing the content of both tweets and webpages redirected by the URLs embedded in the tweets. Similarly, various approaches exist to characterize and detect content polluters, spammers, and bots in different OSNs [24–27]. Researchers have also used sequencing techniques to profile those users who are compromised by the malware and other illicit entities based on their activity analysis, such as the first activity post login, browsing sequence, and so on. Inspired by DNA sequencing, Cresci et al. [5] presented a digital DNA sequencing method for profiling individuals’ activities to classify social spambots and benign users. They grouped user activities based on activity type and encoded them with different characters. However, very few studies have analyzed and profiled the users who interact with the socialbots. In this direction, Wagner et al. [9] presented a machine learning approach to profile those users who have any form of interaction (reply, mention, follow, or retweet) with the socialbots and labeled them as susceptible users. They trained six different machine learning classifiers to segregate susceptible and non-susceptible users. Wald et al. [10] profiled those users who interacted (followed) or communicated (mentioned, replied, or sent the direct message) with the socialbots. Wald et al. used the same set of features like [9] and trained six different classifiers to classify the interacted and communicated users. To the best of our knowledge, none of the existing approaches have categorized the socialbot targets based on their interaction initiation behavior and how they differ from unresponsive users. Also, no approach in the existing literature analyzes the susceptible user profiling as both ternary and binary classification problems.
Problem definition and preliminaries
Problem definition
The objective of the proposed approach is to detect users who are vulnerable to socialbots on Twitter. The basic functions of our approach are as follows:
In [2], we presented the analytical observations of a socialbots injection experiment on Twitter. In the experiment, hundreds of Twitter users created connections and interacted with the socialbots, constructing the injection network of the socialbots. On analysis, we found that socialbots generally target random users, but two categories of users facilitate them. The first category includes those users who initiate connection with the socialbots by following them, and they are termed as active socialbot target. The second category includes those users who responded to socialbots’ following activity by following them back, and they are termed as reactive target. These two categories of users are different from those users who do not responded to the socialbots’ requests, and they are termed as inactive target. Therefore, given the two categories of socialbot targets as input, our approach characterizes the Twitter users and train different machine learning models to detect and segregate them from inactive users. Table 1 presents the symbols along with a brief description that are used in this paper.
A list of symbols and their brief description
A list of symbols and their brief description
Socialbot targets
Socialbots first create connections with OSN users to build trust in the network. They target users based on certain parameters, and different categories of users respond differently. Some users start connection/following socialbots without any request from them, whereas other users respond differently. A network of socialbots and their target users is called socialbots injection network. If N (U, E) represents a socialbots injection network, where U represents the aggregated set of socialbots U S and target users U T such that U = U S ∪ U T , and E represents the set of connections (including follower and following relations) between them, then the three categories of users can be described as follows.
Active target:
In an injection network N (U, E), a target user u ∈ U
T
is considered as an active target
Reactive target:
In an injection network N (U, E), a user u ∈ U
T
is considered as a reactive target
Inactive target:
In OSNs, benign users generally connect with known users and public figures, whereas malicious users follow and respond to anyone to increase their followers count and consequently the network scope. In an injection network N (U, E), if a socialbot s ∈ U
S
follows a user u ∈ U
T
to get a follow back, but u neither follows back nor starts any kind of interaction with s, then u is called an inactive target
On Twitter, every user with respect to socialbots can be classified into one of the aforementioned three user categories. Therefore, in an injection network N (U, E), the set of target users U T includes active, reactive, and inactive users.
Ethical aspects
In OSNs, various privacy and security issues related to the sharing and exposure of users’ information exist. At each stage of the experiment, we tried our best to ensure the privacy of the collected user information. Our socialbots injection experiment, monitoring, and data logging were conducted for an academic research purpose to investigate the impact of the socialbots’ attributes on the Twitter users of different geographies. To comply with the Twitter’s rules and guidelines, we filtered all radical and suspicious tweets while crawling tweets from the trending topics and followers’ timeline. Socialbots were also programmed to retweet only those tweets that do not contain any spam or radical keywords. Moreover, quotes stored in the database were manually verified for inflammatory, racial, controversial, or provoking content. Based on the ethical issues discussed by Elovici et al. [28], we identified several ethical aspects that were complied during and after the injection experiment. Table 2 presents a brief description of the identified ethical considerations.
Ethical consideration and respective compliance
Ethical consideration and respective compliance
Moreover, our experiment was approved by and performed under the guidance of the departmental research committee, including my doctoral supervisor as a member. We conducted every step of the experiment under the monitoring of the research committee. We did not share any private or public information of the crawled users to any third person or organization. We also ensure that it will not be shared in the future as well. In the experiment, we tried our best not to violate the Twitter’s terms of service 1 and privacy policy 2 .
The dataset associated with the three categories of the socialbot targets viz. active, reactive, and inactive users is collected from a socialbots injection experiment conducted on Twitter. In the experiment, we injected 98 socialbots associated with the top-six (in terms of the user-base) Twitter using countries – USA, Brazil, UK, Japan, Indonesia, and India. The socialbots were programmed to randomly perform various activities, such as following, tweeting, and retweeting. The socialbot network was in operation for approximately four weeks. We have presented a detailed description of the injection experiment and the corresponding statistical results in one of our previous works [2]. Throughout the experiment, socialbots followed a total number of 6, 963 users. Among them, 1, 248 users followed back to socialbots (reactive users). The remaining 5, 715 users are the inactive users because they did not acknowledge any socialbots’ request. Also, a total number of 1, 659 users followed the socialbots without any following from the socialbots (active users). Finally, we have a total number of 2, 907 active and reactive users that were trapped by the socialbots. In this study, we have considered only those trapped users who have at least 200 tweets in their timeline because 200 tweets are sufficient to observe the emotional, personality, and topical behavior of a user. As a result, we have only 611 active and 773 reactive users. Out of these, we have randomly selected 250 users from each of the active and reactive user categories, and 250 users from the set of inactive users. Thus, the final dataset has 750 users comprising 250 users from each of the aforementioned three user categories.
Thereafter, We crawled 200 tweets and profile information of each of the 750 users of the dataset, and processed them using the Natural Language Understanding (
This section presents user characterization approach to profile users who are susceptible to be the socialbots’ victims. Since the trapped users aid in trust-building process of the socialbots and eventually make them successful in OSNs, it is vital to characterize and profile the trapped users to differentiate them from other users of the network who do not respond to the socialbots’ following requests. In OSNs, identity-related information associated to a user hardly changes, whereas behavior-related information frequently changes with time. Therefore, we categorize a user information into static and dynamic components. Figure 1 presents a schematic representation of the proposed approach. A brief discussion of static and dynamic components along with different categories of the features is presented in the following sub-sections.

Work-flow of the proposed approach for classifying socialbot targets on Twitter.
In real-world, people identify a user through name, gender, etc. that generally do not change with time. Similarly, users provide some basic identity-related information on OSNs. However, no universally accepted mechanism exists for automatic verification of the provided information. Further, due to usability issues and fear of user-base reduction, OSNs do not put strict measures on user registration and operation. As a result, OSNs exhibit various vulnerabilities abused by the malicious users for illicit activities, such as fake profile creation [1]. Based on the users’ profile information, the following sub-section presents a description of the static component – online identity (who you are?).
Online identity (who you are?)
On OSNs, a user verifies the sender of a friend request using his/her publicly available information. The receiver does this verification to ensure the identity of the sender. The OSNs use different sets of personal information to construct a user profile and authorize the user to customize the profile to control the visibility of the personal information up to a certain extent to which she is comfortable. Unlike other OSNs, Twitter require limited information, such as name, Twitter handle for the new account registration. In the proposed approach, the static component for user profiling includes a set of 9 features that are briefly summarized in Table 3. In the static category, 5 out of 9 features are based on users’ bio description and Twitter handle. The static features are generally straightforward to compute. The name and handle similarity is calculated using Jaro similarity [31], which is a string matching algorithm to compare two small strings. For example, Jaro similarity J s between two strings st1 and st2 can be computed using Equation 3, where m represents the number of matched characters and tr is the half of the number of transpositions.
Static features and their descriptions
Static features and their descriptions
We generally use static attributes of users for their identity verification. However, except for identity, the static attributes do not have any notable impact on the position of a user in the network. In an OSN, users are distinguished based on their behavior. The static features can be easily manipulated by a user (malicious or benign) through adjusting the profile attributes as per the requirement, but her activities in a network indicate her off-line behavior and intent behind joining the network. In this study, we model dynamic behavior, such as network structure, tweets content, and topical distribution of a user using a set of dynamic features. However, modeling user characteristics is a difficult task due to the complex behavioral dynamics. In OSNs, it is even a more challenging task due to informal writing, code-mix languages, noisy content, and lack of efficient multilingual
In the real-world, every individual has a distinct set of characteristics, and people are different from each other in terms of writing style, language skills, lifestyle, and so on. In terms of textual preference, people from different professions have disparate language and writing styles. For example, journalists and bloggers are generally very proficient writers and they generally use long sentences to express views on the current affairs; advertisers post product and service-related content; and, normal users generally post related to their daily life events. The textual preference feature category monitors such characteristics of an individual using six different features, reflecting her linguistic preferences. The features of a user u under the textual preference category is represented using
Textual preference-based features and their brief description
Textual preference-based features and their brief description
In OSN, users exhibit distinct behavior while interacting with the platform. Some users actively tweet and retweet, whereas there are users who actively use the network but rarely tweet. Such users use the social network only as a consumer of information [32–34]. The existing literature has various spammers, spambots, and socialbots detection techniques that exploit the interaction-based user characteristics [31]. In a user profile, this category of features represents the interaction behavior, rather than the access methods of the user. This category presents three features to model the interaction behavior of a user. The features of a user u under this category is denoted by
Interaction method-based features and their brief description
Interaction method-based features and their brief description
In cyberspace, different OSNs exist for different categories of users, such as
User intention and personality-based features and their brief description
User intention and personality-based features and their brief description
The ultimate goal of a malicious user like socialbot, spammer, and sock puppets is to maximize the number of followers. Among the malicious users, socialbots exploit different tactics like common interest and mutual friend to grab the followers and friends. In the process, socialbots generally trap other illicit users [2]. Therefore, analysis of the friendship network of socialbots is essential to monitor their fraudulent behavior. This category of features is denoted by
Network structure-based features and their brief description
Network structure-based features and their brief description
This section presents a description of performance evaluation techniques, including classification models training and evaluation, comparative analysis, feature ablation analysis, feature ranking, and finally behavior analysis. The performance evaluation of the proposed approach is performed using three different classification models and four standard evaluation metrics over the dataset described in Section 3.2.3.
Classifiers and evaluation metrics
The proposed approach first presents the profiling of socialbot target as a ternary classification problem, i.e., classifying users into three categories. We evaluate our approach using three machine learning multi-class classifiers, namely, naive Bayes, REP decision tree, and random forest. Among these, naive Bayes is a probability-based classifier, which assigns the feature vector of an instance to the most likely class using the Bayes theorem, a statistical technique to assign a posterior probability to an event based on its prior knowledge [36]. The REP decision tree initially builds a decision tree, and then prunes it to remove insignificant branches using the reduced error pruning approach [37]. The random forest is an ensemble classifier, which combines the results from multiple decision trees that follow the same distribution. The proposed approach uses 100 trees in the random forest-based classification. To predict the class of an instance using random forest, first, its feature vector is passed to each decision tree of the forest, and thereafter majority voting is used to determine its class label [38].
We have evaluated the proposed approach using four standard evaluation metrics – true positive rate (TPR), false positive rate (FPR), Precision, and F-Measure. The TPR (aka Recall) is the fraction of correctly classified active or reactive users from the set of all active or reactive users. Mathematically, it is defined using Equation (7), where TP represents the number of correctly classified active or reactive users and FN represents the number of active or reactive users misclassified as inactive users. Similarly, FPR is the fraction of inactive users misclassified as active or reactive users, as defined in Equation (8), where FP represents the number of inactive users misclassified as active or reactive users, and TN represents the number of correctly classified inactive users. Precision of a classification model is the fraction of the correctly classified active or reactive users from the set of users classified as active or reactive, as defined in Equation (9). Finally, F-Measure of a classification model is the harmonic mean of the precision and recall (TPR), which is defined in Equation (10).
After feature extraction, the three aforementioned classifiers are trained as ternary classifiers using Weka 6 , a handy open-source tool having the in-built implementation of various machine learning and data mining algorithms in Java. We used 10-fold cross-validation to avoid bias and ensure the participation of every user in both training and testing procedures. The 10-fold cross-validation partitions the dataset into ten equal parts, wherein nine parts are used to train the model, which is further tested on the remaining one part. This process is repeated ten times to confirm the use of every user in both training and testing procedures. Table 8 presents the evaluation results for all three classification models in terms of the aforementioned evaluation metrics. Among the trained models, naive Bayes classifier under useSupervisedDiscreatization=TRUE setting performs moderately with TPR value at 57.7%, as given in Table 8; but, performs worst in terms of FPR value. In terms of TPR, Precision, and F-Measure, REP decision tree performs worst which can be observed from the first row of Table 8. Among the three classification models, random forest with default parameters demonstrates the best performance. It shows the TPR at 61.4%, as shown in the first row of Table 8. Based on the results, we can conclude that the overall performance of the trained models is not exciting. It is because of the poor classification performance of the trained models for reactive users who are significantly similar to active users in terms of behavior and operation characteristics.
Performance evaluation results using Naive Bayes, REP Decision Tree, and Random Forest classifiers when trained for a 3-class problem
Performance evaluation results using Naive Bayes, REP Decision Tree, and Random Forest classifiers when trained for a 3-class problem
Since both active and reactive users are socialbot traps, we observe their combined effect on the performance of the classification models. Accordingly, we adjudge both as a single unit called trapped users and label them as one class, whereas inactive users constitute the second class to model the trapped users detection as a binary classification problem. Further, we train the same set of classifiers and perform the experimental evaluation on the same dataset discussed in Section 3.2.3. Table 9 presents the evaluation results in terms of the aforementioned performance evaluation metrics. As a binary classification problem, random forest demonstrates the best performance in terms of TPR, Precision, and F-Measure with their values at 80.9%, 79.4%, and 80.0%, respectively, but moderate performance in terms of FPR, as shown in the first row of Table 9. Overall, the performance of the binary classification models is significantly better in comparison to modeling the detection of socialbot targets as a ternary classification problem. This result demonstrates and proves our hypothesis that active and reactive users are significantly similar in terms of working behavior.
PPerformance evaluation results using Naive Bayes, REP Decision Tree, and Random Forest classifiers when trained for a 2-class problem
We also performed the feature ablation analysis to analyze the discriminative power of each category of features. In this analysis, one category of features is excluded from the feature vector to observe its impact on the performance of the classification models [39]. Therefore, using the feature ablation analysis, aforementioned experiment is performed five times to observe the impact of each category of features on the classification models. The performance evaluation results of feature ablation analysis for each category of features are presented in the second, third, fourth, fifth, and sixth rows of Tables 8 and 9. We can observe from both the tables that in terms of TPR, Precision, and F-Score network structure-based features are most discriminative for all the classification models, except in terms of Precision and F-Score for REP decision tree model for binary classification problem. It represents the fact that different types of users have different connection formation behavior, and accordingly they exhibit different network structures. For example, follower seeking users generally follow back everyone who follow them. The follower seeking users are also quick in following users without having any prior familiarity with them. The user intention and personality-based features also show moderate discriminative power that includes most of the newly defined features, which is one of the contributions of this study. The textual preference-based features also show good classification power in the case of the ternary classification problem. It endorses the fact that different categories of users exhibit different writing styles and use different vocabulary. We can observe from the second row of both Tables 8 and 9 that static features show the least impact on the performance of the trained models. It depicts the fact that users (either they are susceptible or not) generally setup an OSN account very carefully.
In the existing literature, the problem of modeling and profiling socialbot targets is understudied. In this direction of research, Wald et al. [40] injected a socialbot on Twitter which trapped 610 users. Finally, authors extracted different features and trained various machine learning models to segregate the two categories of users. They also performed feature ranking to identify the list of traits that are most relevant for classifying the two categories of the users. This section presents a comparative performance evaluation of our approach with Wald et al. [40], which characterizes and predicts Twitter users who are susceptible to be a socialbot trap. We present the comparison of the proposed approach for both ternary and binary classification problems using the same set of classifiers and evaluation metrics over the dataset described in Section 3.2.3. To this end, we implemented the Wald et al. [10] approach, trained all three classifiers, and observed the values of the aforementioned evaluation metrics. It should be noted that Wald et al. is not a ternary classification problem because it classifies the users as either interacted or communicated with the socialbots. Therefore, to model it as a ternary classification problem, we added the inactive users as the third class for the Wald et al. approach. Figure 2 presents the comparative evaluation results. It shows that our approach significantly outperforms Wald et al. [10] method for all classifiers and evaluation metrics when we model it as a ternary classification problem. Among the classifiers, REP decision tree performs best in terms of all four evaluation metrics, and other two classifiers also perform better than the Wald et al. [10] method. We also present a comparison of our approach with Wald et al. [10] method for the binary classification problem. Figure 3 presents the comparative evaluation results, and it can be observed that in this case too our proposed approach outperforms the Wald et al. [10] method for all three classification models.

Performance comparison results when modeled as ternary classification problem.

Performance comparison results when modeled as binary classification problem.
In this section, we aim to identify the most relevant features based on their discriminative power for the classification models. To this end, we perform experiments using two feature ranking algorithms – mutual information (MI) [41] and correlation attribute evaluation (CAE). The MI shows the dependency between two random variables based on their joint probability distribution. For any feature F i and class label l k , the MI between them is calculated using Equation 11, where f and l represent one of the values of feature F i and class label l k , respectively; p (f, l) represents the joint probability of F i and l k , and p (f) and p (l) are the marginal probabilities of the feature and label, respectively.
The mutual information determines how similar the joint distribution p (f, l) is to the product of the factored marginal distributions. On the other hand, the CAE ranking algorithm is based on Pearson’s correlation coefficient between the features and class labels, and it is defined using Equation 12, where F i represents the i th feature of the feature vector F, and l k is one of the user categories.
Table 10 presents the top-10 features identified by the two ranking algorithms. We can observe that the following rate, multimedia ratio in tweets, and follower rate are the most relevant features identified by the two ranking algorithms. On examination, we found that active targets have the highest following rate with a value of 22.35 users per day, and they used multimedia content in their tweets most frequently. On the other hand, reactive targets have the highest tweet rate, and they posted approximately 12 tweets per day. Therefore, we can conclude that users who are actively engaged in the network in terms of following, tweeting, and other activities are more prone to the socialbots’ trap. We can also observe that static profile features are not relevant to discriminate among different user categories, whereas network structure-based features are the most relevant for socialbot targets detection.
Top-10 features selected by two feature ranking algorithms
In this section, we discuss several interesting observations based on the content and behavior analysis of the three categories of the socialbot targets. The following sub-sections present a detailed description of different analyses and underlying analytical results.
Topical analysis
Why a user joins an OSN? A user’s intention behind joining a network can be inferred by analyzing the topics discussed in the tweets. The
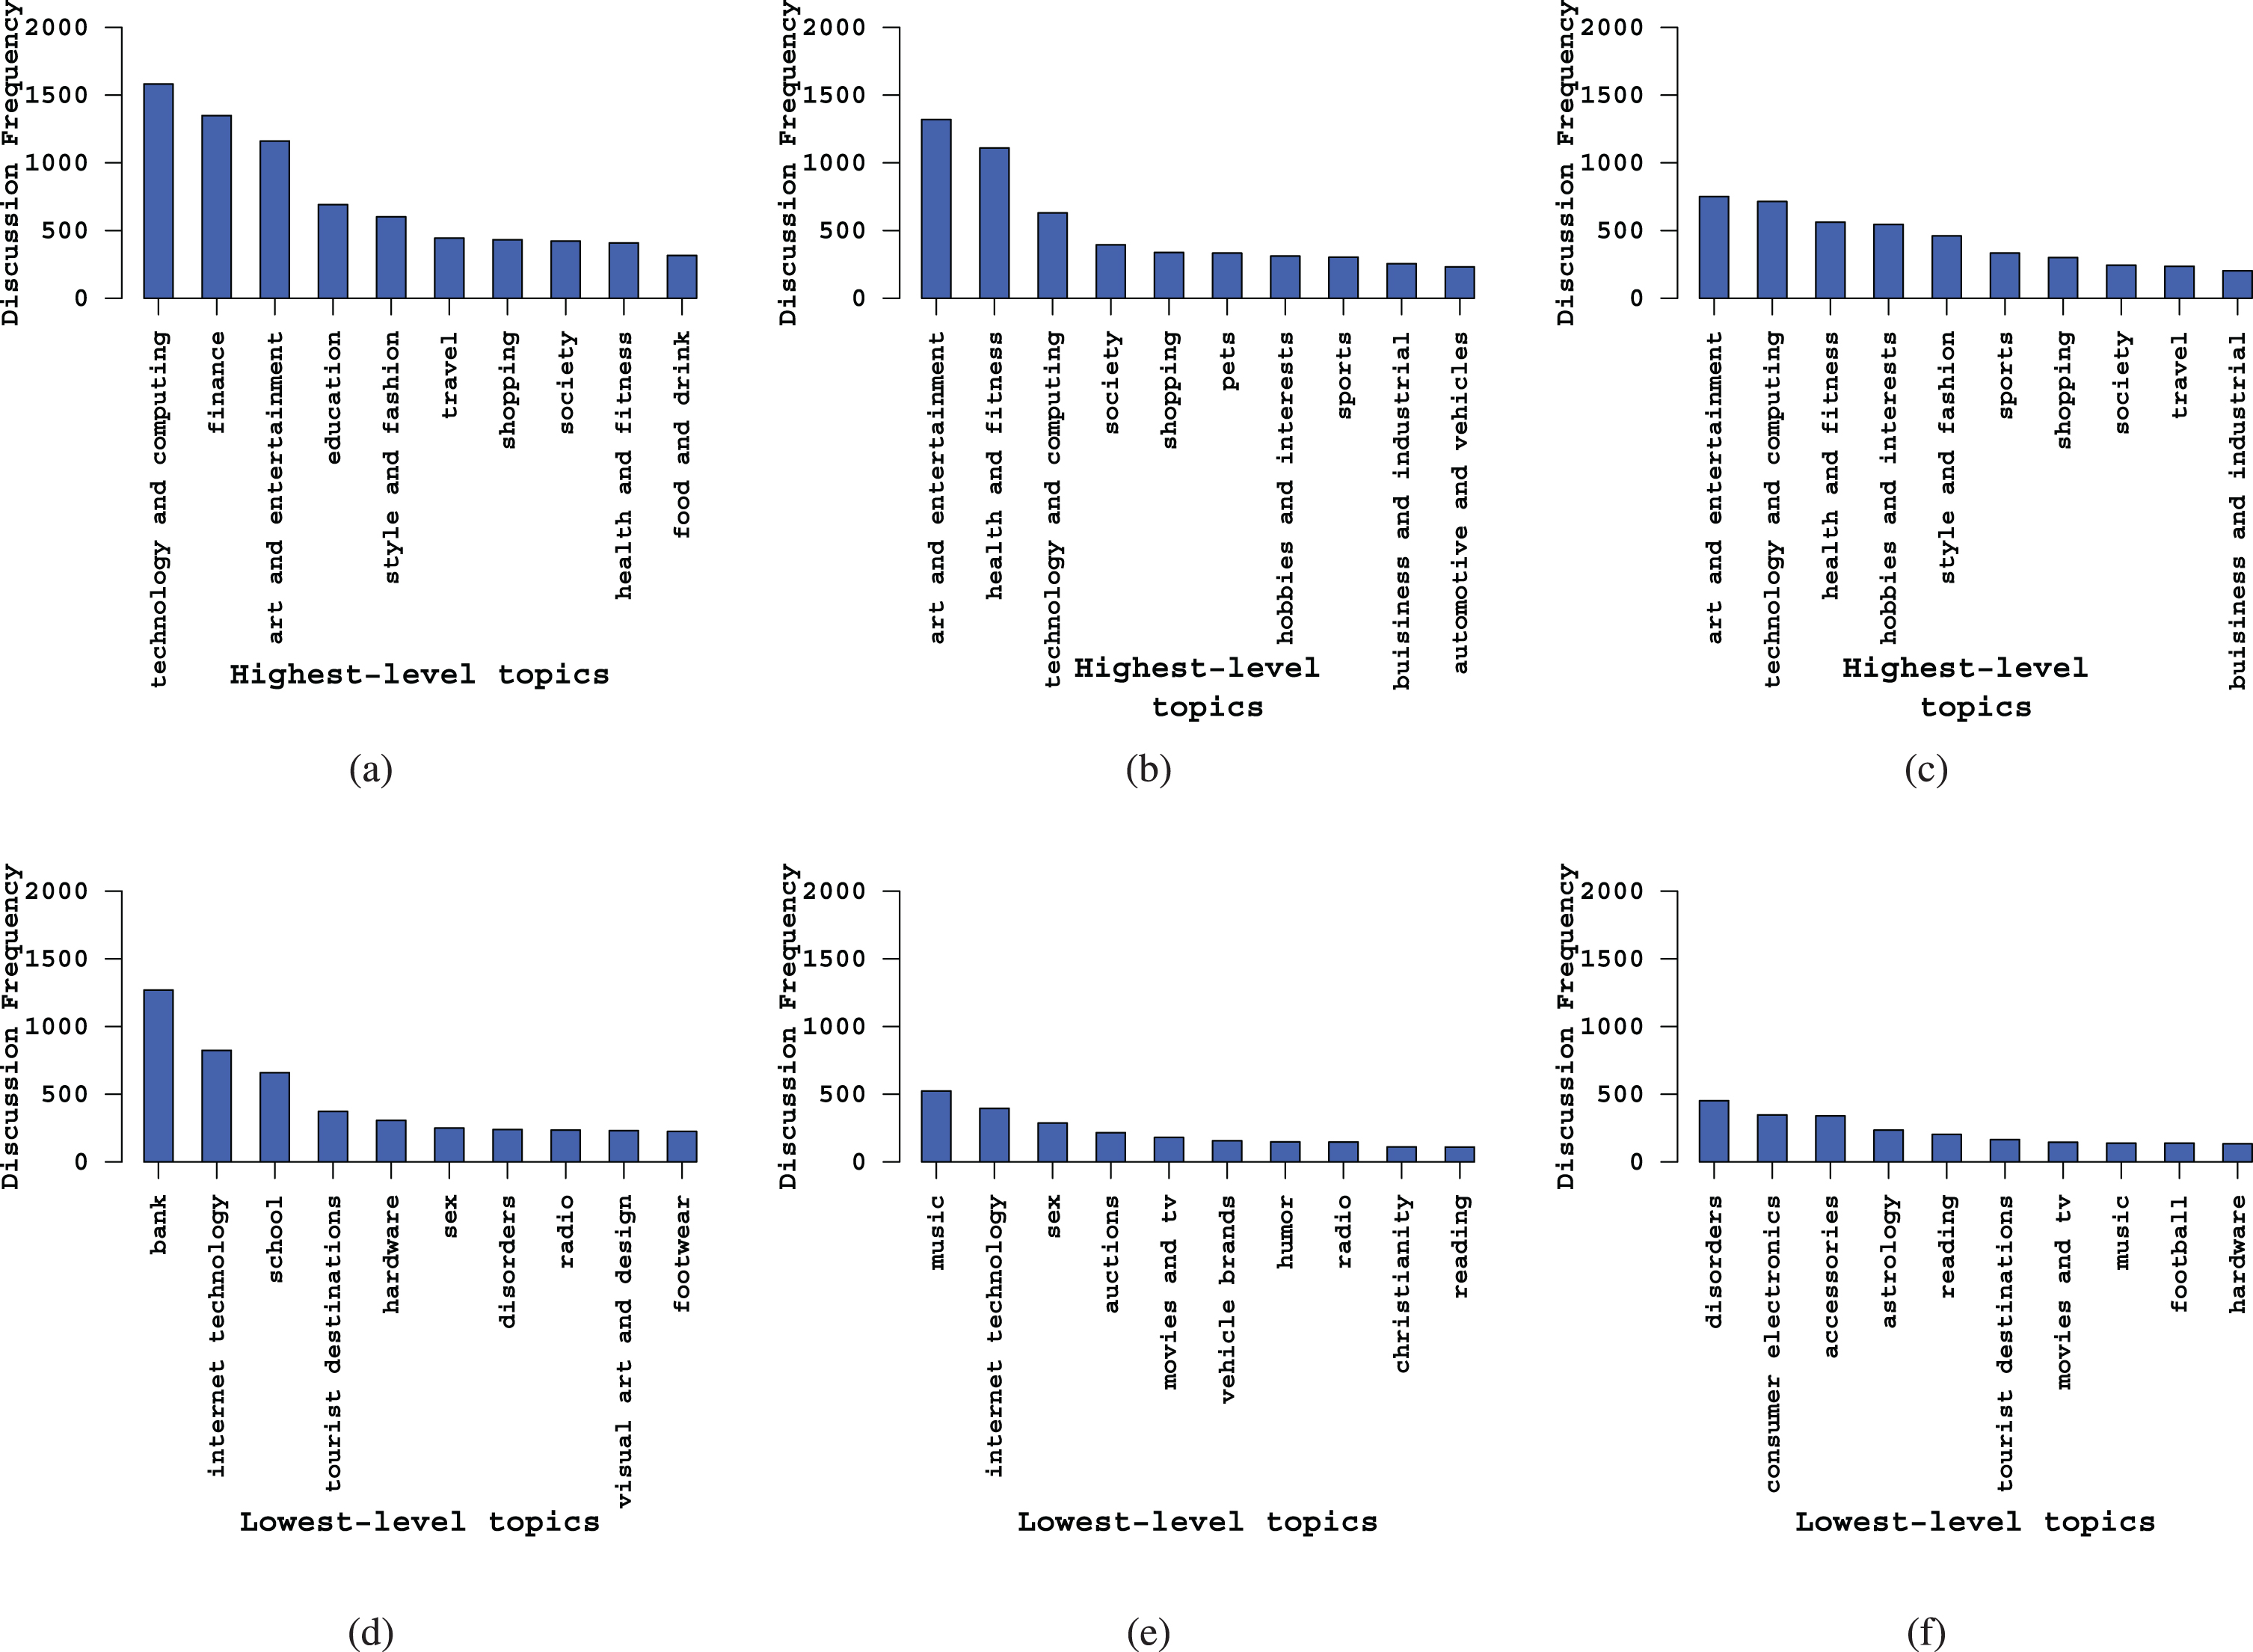
Frequency distribution of top-10 highest-level topics discussed by three groups of users (reproduced from [11]) – (a) active users, (b) reactive users, and (c) inactive users, and top-10 lowest-level topics discussed by three groups of users – (d) active users, (e) reactive users, and (f) inactive users
Are the active and reactive socialbot targets malicious? To find the answer to this question, we analyze and evaluate the two categories of users based on some parameters that are the established indicators of spamming. First, we analyze the use of URLs and spam words in tweets because these two indicators are the important features in existing spammer detection approaches [9, 42]. On analysis, we found that active and reactive users frequently use URLs in tweets, and thereby they have higher url ratio at 0.50 and 0.39, respectively. On the other hand, inactive users moderately use URLs in their tweets with a value of 0.29 per tweet. Figure 5(a) presents the cumulative distribution of url ratio for the three categories of users. This figure shows that approximately 40% of reactive and inactive users have url ratio less than 0.20, whereas only few active users have url ratio less than 0.20. It is obvious from the Figure 5(a) that active and reactive users have higher probability of using URLs in their tweets. However, when we analyze the advertising keyword ratio, we found that the three categories of users show identical behavior, as shown in Figure 5(b). Moreover, active and reactive users frequently use images and videos in their tweets and, therefore, they show higher image and video rate, as shown in Figure 5(c). It further confirms the malicious nature of the active and reactive users. We also analyze the connection formation behavior through following activity and found that active users most frequently create connections, which is obvious from Figure 5(d). Finally, we analyze the current status of the three categories of users (in terms of whether they are active or suspended), and the corresponding statistic is given in Table 11. On Twitter, in response to an API request for a user’s information, an error code of 63 represents that the user is suspended 7 due to the violation of the Twitter’s terms of service, whereas an error code of 50 represents that user has either deleted the account or changed its handle. In terms of suspicious behavior, suspended is serious than user not found because suspension is due to malicious activities, whereas account deletion is generally personal rather than malicious. Table 11 shows that the lowest percentage of active users exist, as shown in the third column using bold typeface, and they have the highest suspension percentage, as shown in the last column using bold typeface. On the other hand, inactive users have the highest percentage of existence and only 2.4% are suspended, representing their fair and benign behavior. Therefore, based on the analyses of engagement and content, active and reactive users appear to be more suspicious than inactive users.
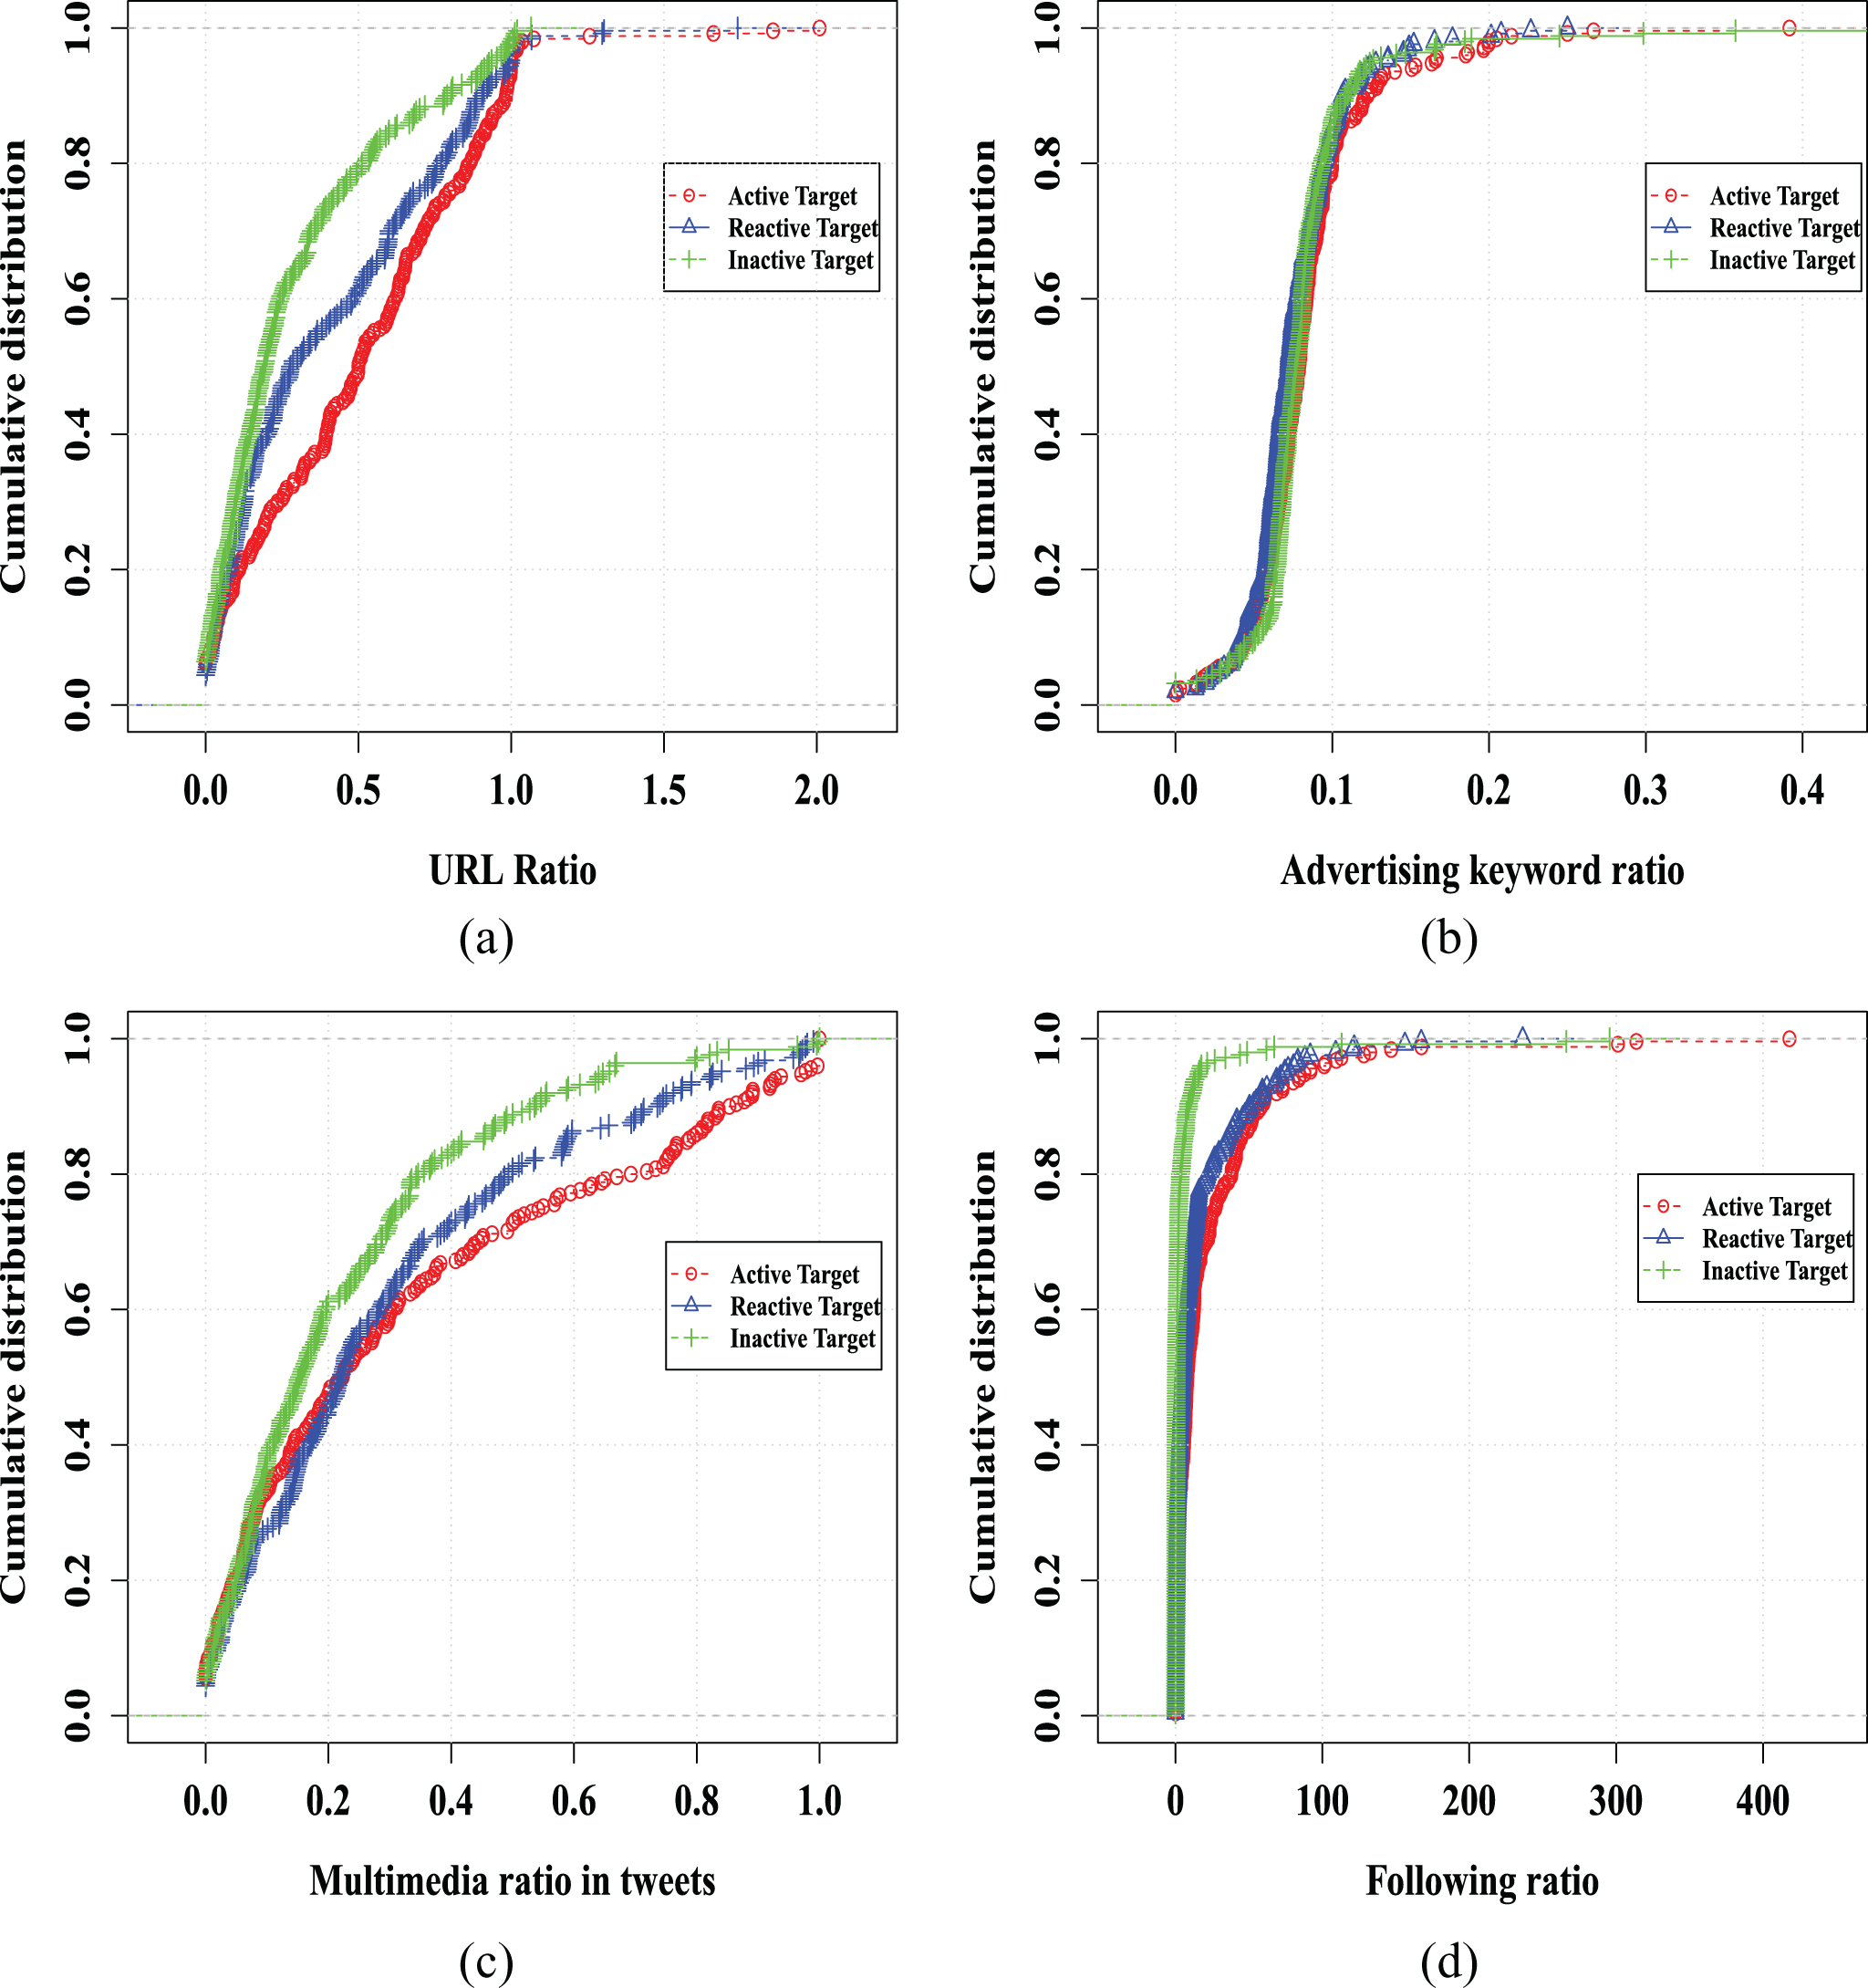
Cumulative distribution of spammy features for three categories of socialbot targets.
A brief statistic of socialbot targets
In addition to topical and suspicious behavior analysis, this section performs personality traits and tone analysis of the three categories of users. In terms of emotional characteristics, three categories of users show similar behavior. However, some emotions are more prevalent than others. On analysis, we found joy as the most dominant emotion among the three groups of users. For the visualization proof, Figures 6(a), 6(b) and 6(c) show the cumulative distribution of three emotion scores viz. joy, sadness, and anger, respectively. These figures also show that joy is the most dominant emotion. Similarly, we also analyze the big-five personality traits and found that agreeableness is the most dominant personality trait which is equally prevalent among the three categories of the users, as shown in Figure
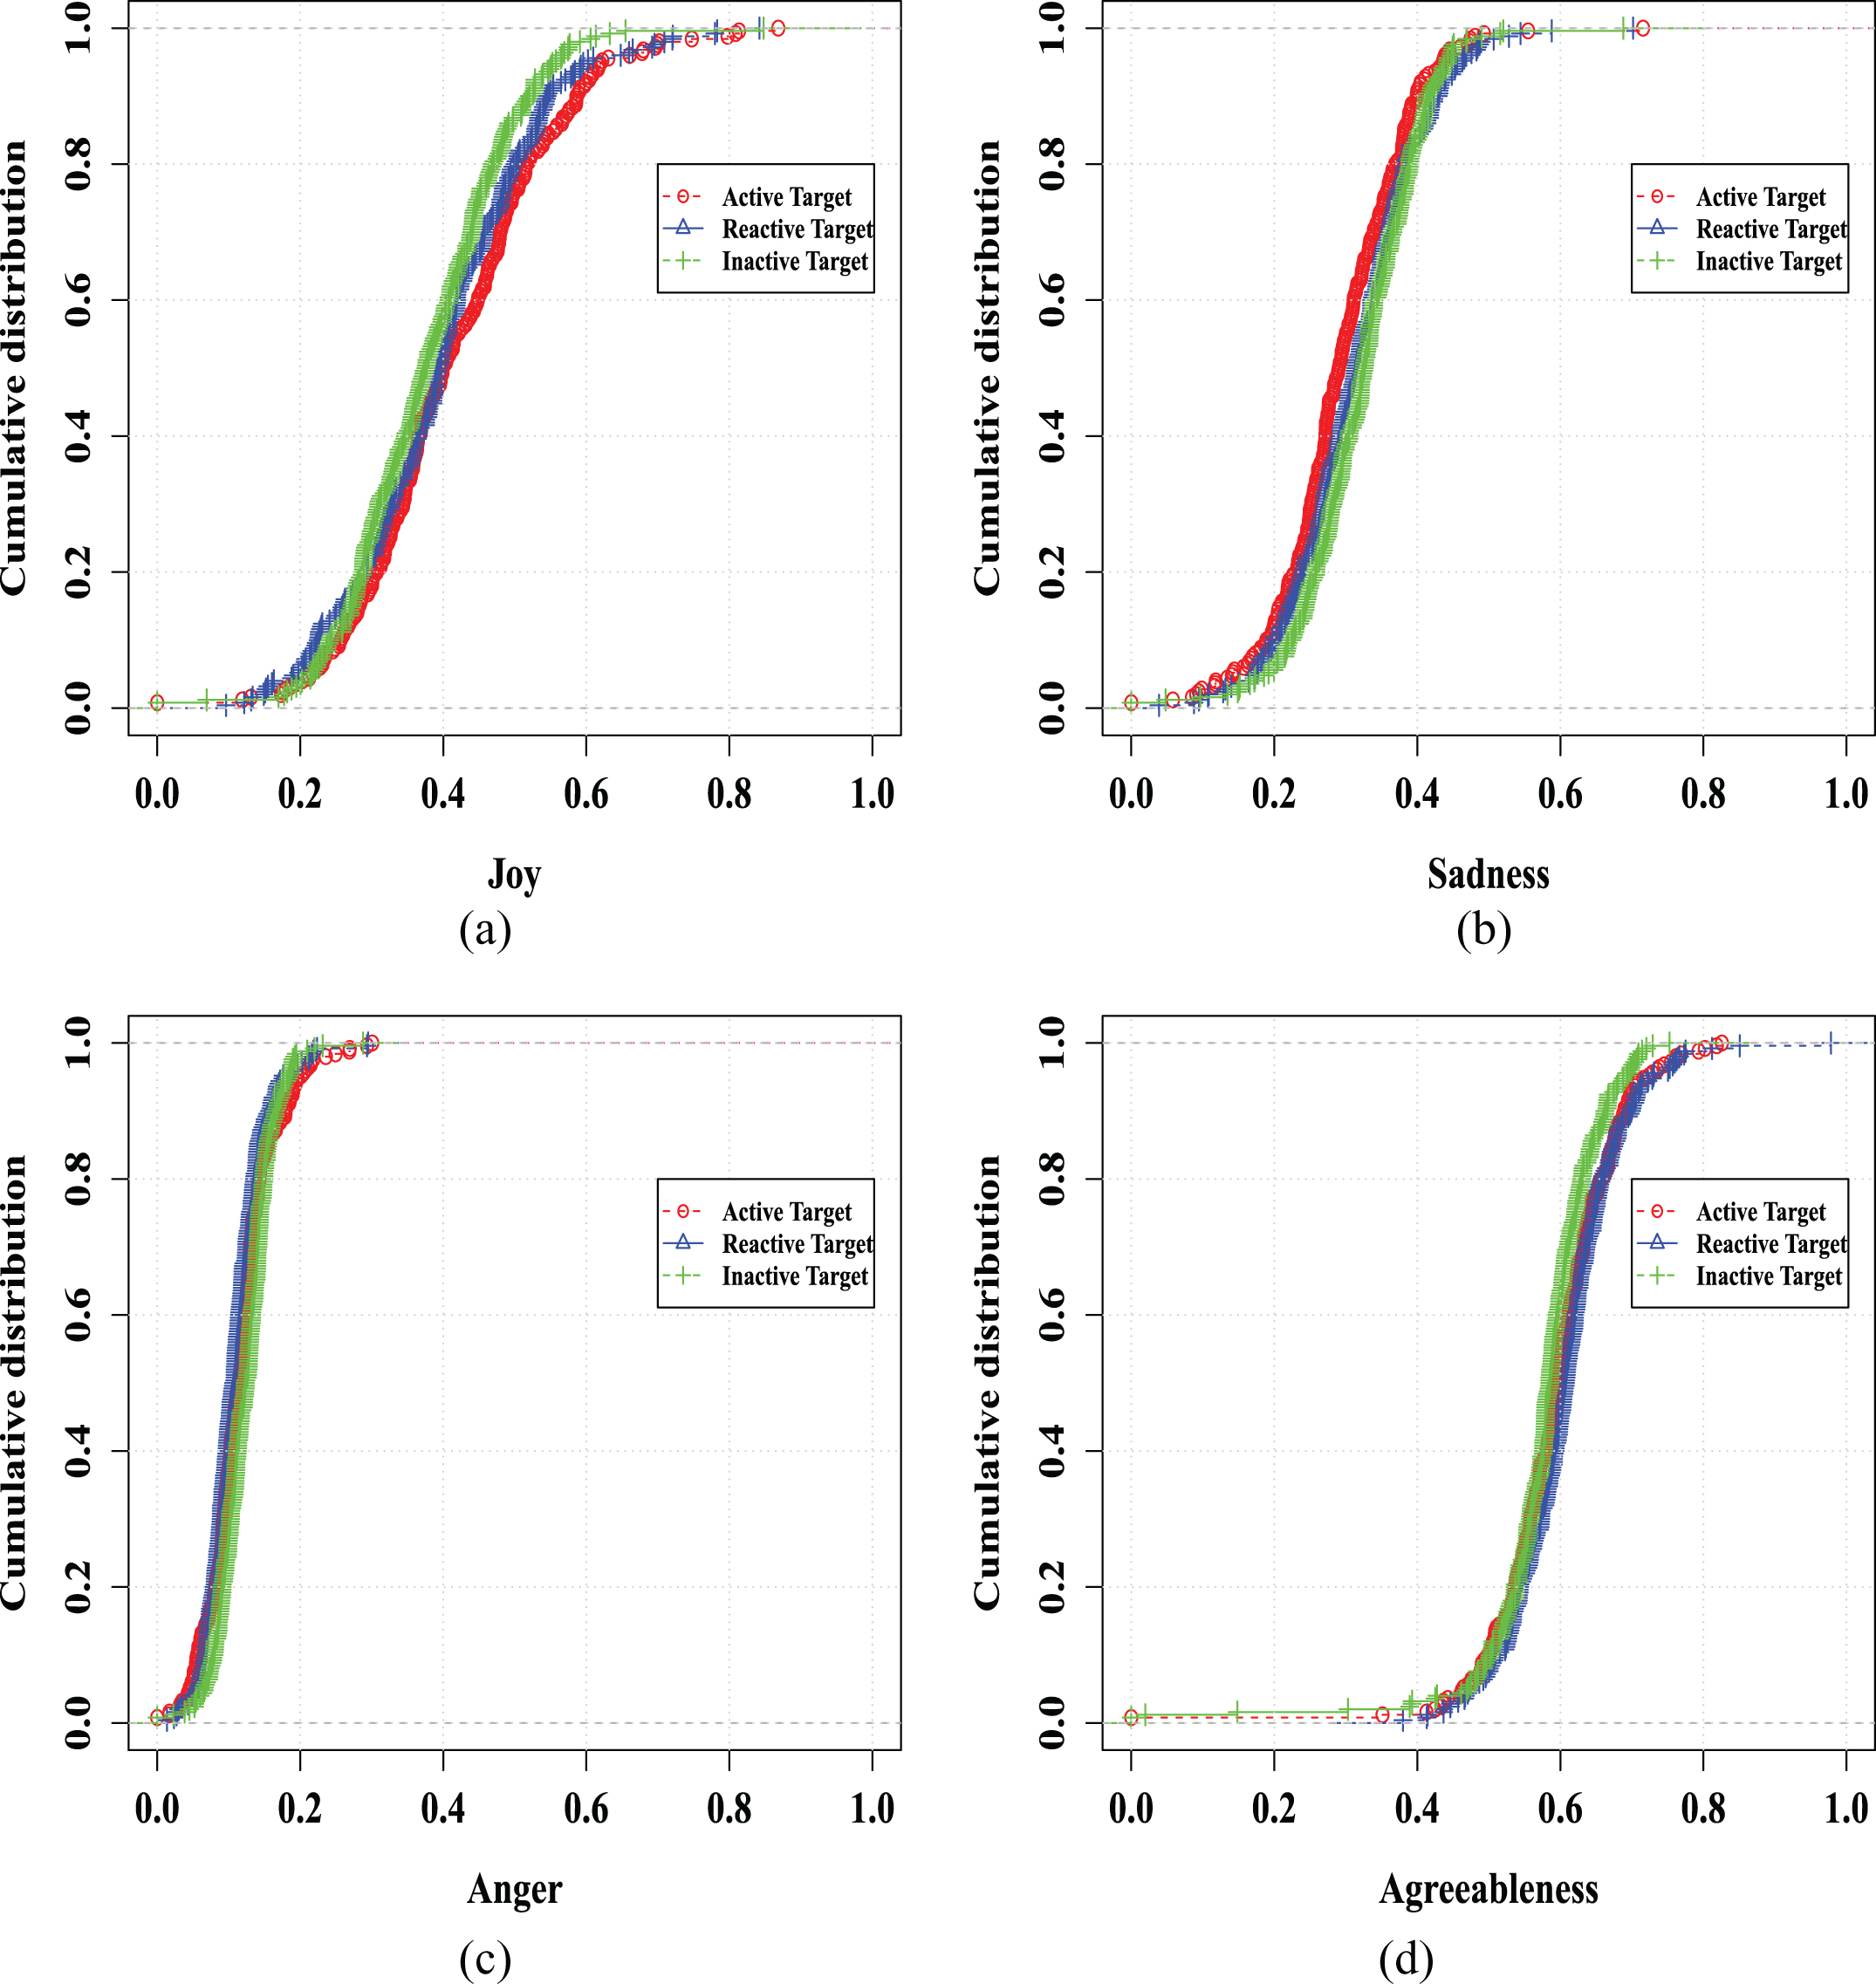
Cumulative distribution of emotion scores for three categories of socialbot targets.
In this paper, we have presented a machine learning approach for characterizing and detecting socialbot targets in Twitter. The proposed approach is modeled as a ternary classification problem which categorizes socialbot targets into three groups viz. active, reactive, and inactive users, and profile them using static and dynamic characteristics based on their identity, interaction, textual, and personality-based attributes. We have also modeled the socialbot targets detection problem as a binary classification problem, wherein active and reactive users are combined into a single category (termed as trapped users) and inactive users are considered as the second category. The performance of our approach is compared with a state-of-the-art method for susceptible users detection. We have also performed a features ablation analysis to observe the discriminative power of the feature categories in segregating socialbot targets. On empirical analysis, we found that the network structure-based features are most discriminative, whereas the identity-based features are least discriminative. We have also analyzed the relevance of all identified features and found that following rate, multimedia ratio in tweets, and follower rate are the most relevant features for detecting socialbot targets. Further, we have presented a detailed topical and behavioral analysis of the socialbot targets. On analysis, active users are found to be suspicious, and both joy and agreeableness are the most dominating personality traits among the three categories of users. Analyzing the temporal evolution of trapped users and their ecosystem seems an interesting problem to extend the work reported in this paper.