
Abstract
With the rapid development of commercial credit mechanisms, credit funds have become fundamental in promoting the development of manufacturing corporations. However, large-scale, imbalanced credit application information poses a challenge to accurate bankruptcy predictions. A novel multi-stage ensemble model with fuzzy clustering and optimized classifier composition is proposed herein by combining the fuzzy clustering-based classifier selection method, the random subspace (RS)-based classifier composition method, and the genetic algorithm (GA)-based classifier compositional optimization method to achieve accuracy in predicting bankruptcy among corporates. To overcome the inherent inflexibility of traditional hard clustering methods, a new fuzzy clustering-based classifier selection method is proposed based on the mini-batch k-means algorithm to obtain the best performing base classifiers for generating classifier compositions. The RS-based classifier composition method was applied to enhance the robustness of candidate classifier compositions by randomly selecting several subspaces in the original feature space. The GA-based classifier compositional optimization method was applied to optimize the parameters of the promising classifier composition through the iterative mechanism of the GA. Finally, six datasets collected from the real world were tested with four evaluation indicators to assess the performance of the proposed model. The experimental results showed that the proposed model outperformed the benchmark models with higher predictive accuracy and efficiency.
Keywords
Introduction
Corporates are cells of the national economy. They exhibit characteristics of substantial production cost inputs, long investment return cycles, and numerous jobs, and are fundamental in driving the transition of human society to the industrial age. With the development of the credit system and the improvement in capital utilization efficiency, credit funds from financial institutions have become the engine of rapid corporate expansion. However, credit funds sometimes become a huge source of risk causing losses to financial institutions and banks worldwide [37]—the 2008 world financial crisis is a prime example. Measuring the risk and probability of default wherein corporate customers are unable to repay their debts has thus garnered the attention of all risk management levels, bank legislators, and regulators [51], making it critical to be able to predict bankruptcy in corporations.
Bankruptcy prediction is a typical binary classification problem. It divides companies that apply for loans into two categories: those that are well run and those that have potentially high bankruptcy risks. Generally, experience-based and audit-based credit review modes are labor intensive and require considerable material resources; even after extensive effort in these modes, credit fraud prevention remains poor [28]. Hence, classic bankruptcy prediction models—such as the Z-score [4]—have been used to measure a corporation’s financial health. The Basel Committee on Banking Supervision [40] has recommended that banks estimate risks during the entire loan period. Nevertheless, the accuracy of medium- and long-term bankruptcy predictions remains difficult to improve.
In general, the bankruptcy prediction model predicts corporate bankruptcy based on the corporate’s relevant information (e.g. financial statements of corporates) at a given time [16]. Various bankruptcy prediction models have been designed using artificial intelligence technology, including gradient boosting decision tree (GBDT) [22], linear discriminant analysis (LDA) [20], random forest (RF) [9], extreme gradient boosting (XGBoost) [12], and light gradient boosting machine (LightGBM) [29] to support the financial institutions in making the correct business decisions [43]. In particular, the ensemble model has been recognized as a powerful tool for predicting corporate bankruptcy [53]; it has gradually garnered attention, thus becoming more and more mainstream in recent times.
Herein, a novel multi-stage ensemble model with fuzzy clustering and optimized classifier composition is proposed to achieve good corporate bankruptcy prediction. First, a new fuzzy clustering method based on the mini-batch k-means algorithm [42] is proposed to generate amplified clusters, which supports the selection of the best performing base classifiers for generating classifier compositions. Eleven candidate base classifiers were trained and validated on the amplified clusters, and the five best performing classifiers were obtained at this stage. Subsequently, candidate classifier compositions were generated by permutation and combination based on the five best performing classifiers. Random subspace (RS) [7] was applied to train candidate classifier compositions by randomly selecting several subspaces in the original feature space to enhance the robustness of the candidate classifier compositions, which is a prelude to developing an effective ensemble model. This helped to achieve good performance on the candidate classifier compositions under different feature dimensions. A promising classifier composition was obtained from the candidate classifier compositions after evaluation on the validation set. Finally, the genetic algorithm (GA)-based classifier compositional optimization method was applied to optimize the parameters of the promising classifier composition through the iterative mechanism of the GA [38]. The optimal classifier composition was output by the GA-based classifier compositional optimization method to form a stacking-based heterogeneous ensemble model. The performance of the GA in feature selection has been shown to be effective [35]. In this study, the GA was also shown to perform well in the parametric optimization of classifier composition, thus facilitating the construction of an ensemble model with improved performance.
The construction process of the proposed model is adaptive. The selected five best performing base classifiers, the intermediate promising classifier composition, and the final optimal classifier composition are not fixed but depend on the characteristics of different datasets, considering that different base classifiers, different combinations, or different parameterizations yield different classification performances on different datasets.
The remainder of the paper is organized as follows: Section 2 reviews previous literature related to the proposed model; Section 3 elaborates on the main characteristics of the proposed model; Section 4 introduces the experimental datasets, evaluation indicators, and parameter setting; Section 5 analyzes the experimental results; and Section 6 presents the conclusion and discusses future research directions.
Related work
In recent years, the prediction of corporate bankruptcy has garnered considerable attention. Consequently, numerous studies regarding the relevant technologies and methods used to predict corporate bankruptcy have been conducted. Recent literature reviews on bankruptcy prediction have been performed by [3, 47]. The most popular methods, including feature engineering, RS, and ensemble learning, are briefly reviewed in this section.
Feature engineering method
Feature engineering integrates a series of engineering methods to screen better data features from the original data and improve the training effect of the classification model. Reliable data and features are prerequisites for models and algorithms to achieve improved performance. In recent years, the focus on feature processing for corporate bankruptcy prediction has increased. Feature processing typically includes data preprocessing, feature selection, dimension reduction, and other processes. Tsai [46] developed a hybrid ensemble model based on combining hard clustering techniques such as self-organizing maps [32] with feature engineering to predict financial distress. Feuerriegel & Gordon [19] presented a methodology that extends lag variables with unstructured data in the form of financial news that suggests a projection of words onto latent semantic structures as a means of feature engineering. The implementation of the model and the analysis of the most descriptive variables provide insightful information regarding the most critical features of distressed banks relative to non-distressed banks.
Kim et al. [30] used a GA-based optimization approach to select appropriate features, which improved predictive performance through information extraction. Hu [27] developed a multivariate gray prediction model for bankruptcy prediction by sifting the relevant features that had the strongest relationship with the class feature. However, methods to extract informative patterns from similar sample points and the analysis of how sample points could be endowed with abundant information to facilitate reliable predictions have rarely been considered. Extracting filtered and optimized information from features has proven to be effective for improving the performance of classification models.
In our previous work, Zhang et al. [53] proposed a multi-stage hybrid model that combined feature selection and classifier selection to obtain the optimal feature and classifier subsets. Subsequently, a classifier ensemble was used to improve the predictive performance based on these two optimal subsets. Feature extraction can reduce computational complexity and simultaneously cause feature information loss. Hence, clustering feature engineering can be applied to organize the sample points according to the principle of information similarity, which not only reduces computing time but also enriches feature information. Therefore, in the current study, a new fuzzy clustering-based classifier selection method is proposed, which demonstrates a good clustering feature engineering effect on classification problems.
Random subspace method
The RS method improves predictive accuracy by synthesizing the ability of multiple classifiers. This method is based on the stochastic discriminant theory and relies on a pseudo-random process to generate an attribute subset. The generation of each sub-model is independent. Abellán & Mantas [1] used the RS-based ensemble method to improve the performance of classifiers for bankruptcy and credit scoring. Zhu et al. [54] proposed a hybrid ensemble learning approach by incorporating two classic ensemble learning approaches, RS and MultiBoosting [49], to improve the accuracy in forecasting small-medium enterprises’ credit risk.
Previous studies seldom involved the optimization effect of the RS method on classifier composition. Ekinci & Erdal [18] proposed an attribute-based ensemble method combining various RSs for bank failure prediction. Wang et al. [48] proposed an approach for bankruptcy prediction that incorporates sentiment and textual information into the RS method. García et al. [23] investigated the potential relationship between the performance of classifier sets including RSs and positive sample types based on different types of empirical samples.
When building an ensemble model, a parallel combination of classifiers based on RS not only expedites the learning process and reduces the operation time, but also enhances the independence between base classifiers. In the proposed model, the concept of RS is primarily applied to eliminate the mutual interference between base classifiers and enhance the robustness of candidate classifier compositions.
Ensemble models
In corporate bankruptcy predictions, large datasets pose major challenges to traditional classification prediction models. In recent studies, ensemble learning has been proven to attain higher accuracy and stability than base classifiers on large datasets. Le et al. [33] proposed squared logistics loss with graphics processing unit (GPU)-based extreme gradient boosting for bankruptcy forecasting. Tripathi et al. [45] developed a hybrid model that combined feature selection and a multilayer ensemble classifier framework to improve the predictive performance of credit scoring.
However, the single ensemble learning algorithm is disadvantageous in terms of generalization and stability. Hence, Tsai [46] developed a hybrid ensemble model based on classification techniques such as logistic regression (LR) [10], multilayer perceptron (MLP) [6], and the decision tree (DT) [34]. Du Jardin [17] proposed a hybrid financial distress model based on the clustering and ensemble method to estimate the decision boundary between failed and non-failed firms. Kim et al. [30] examined the effectiveness of a hybrid ensemble method by combining the clustering technique and GA based on an artificial neural network model to balance the proportion between minority and majority classes. Zięba et al. [55] proposed an approach for bankruptcy prediction based on extreme gradient boosting (EXGB). Choi et al. [13] proposed voting-based ensemble models that predicted the financial distress of contractors two and three years ahead of the prediction point using the finance-based definition of pecuniary distress.
Previous studies have examined classifier composition as an ensemble method, but few have investigated classifier composition through parametric optimization, especially by applying heuristic-based optimization algorithms. In our previous work, He et al. [25] developed a stacking-based ensemble model for credit scoring by adapting the model to different imbalanced ratio datasets and obtained superior predictive performance. Nevertheless, stacking-based ensemble models can be improved by addressing the challenges in base classifier screening and exploring the compositional optimization of base classifiers. The concept of applying a heuristic algorithm to perform parametric optimization on classifier composition is helpful. Therefore, the GA was applied to the proposed model to optimize the parameters of the promising classifier composition through the iterative mechanism of the GA. The optimal classifier composition was output by the GA-based classifier compositional optimization method to form a stacking-based heterogeneous ensemble model.
Modeling
In this work, a novel multi-stage ensemble model with fuzzy clustering and optimized classifier composition for corporate bankruptcy prediction is proposed. It comprises three main stages: fuzzy clustering-based classifier selection, RS-based classifier composition, and GA-based classifier compositional optimization. The architecture of the proposed model is shown in Fig. 1.
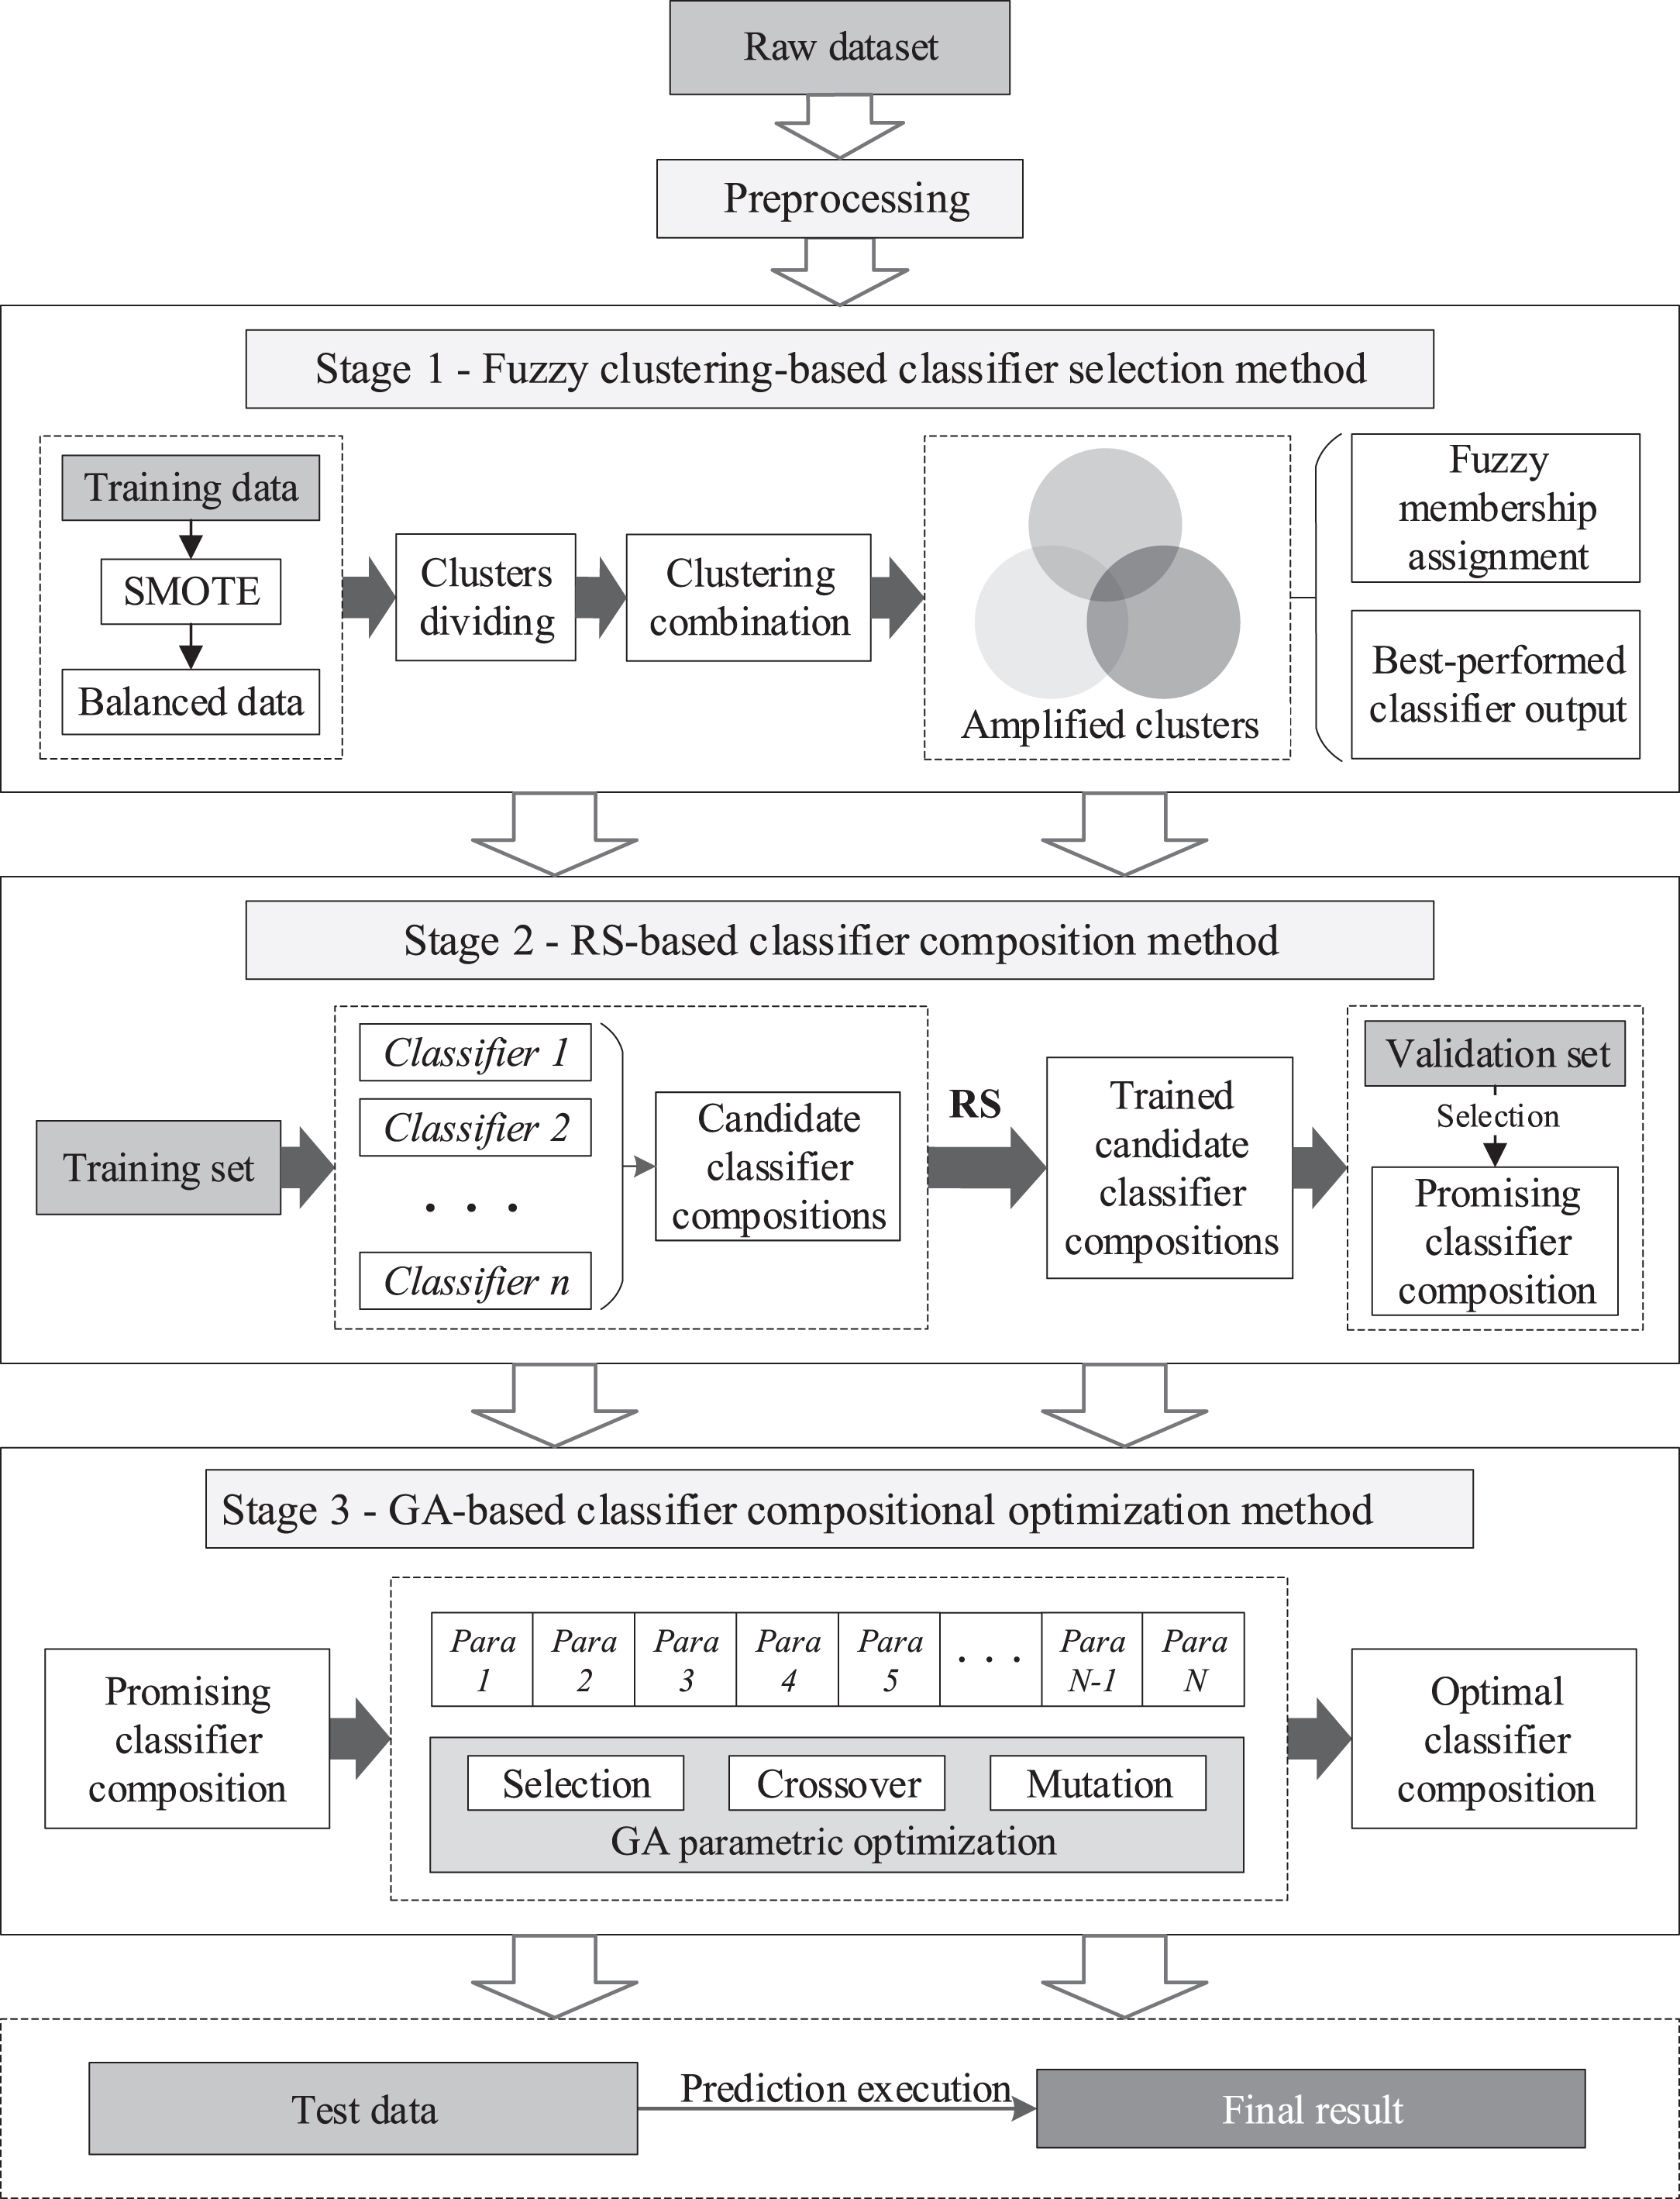
Architecture of the proposed model.
Considering that extremely imbalanced data in datasets could affect the performance of the model, the synthetic minority oversampling technique (SMOTE) [11] algorithm was applied to increase the minority class samples; this could result in an increase in noise data in the minority class samples. Increase in noise data is detrimental to the model performance, but clustering technology can be used to divide the entire dataset into several subsets so that the classifiers can learn multiple times using small batches. In this study, to manage the possible negative impact of the increase in noise data on the model performance, the clustering technique was adopted to aggregate the data, including noise data, into different clusters to improve the learning efficiency of classifiers in handling different types of data.
The mini-batch clustering technique [42] was applied to the proposed model; thus, we could achieve better clustering results on large datasets at a lower computational cost. Compared with the classic k-means algorithm [2], the mini-batch k-means algorithm reduces the computation cost by an order of magnitude [42] and is more suitable for large datasets. After the mini-batch k-means algorithm was executed, the generated clusters were combined into “amplified clusters” based on the core concept of “k-nearest neighbors” (KNN) [15]. To form an amplified cluster, the Euclidean distances between all clusters were calculated separately; subsequently, the three nearest clusters with the shortest Euclidean distance were merged into one amplified cluster. The amplified clusters had a larger sample size and richer information than the clusters generated by the mini-batch clustering technique directly, and therefore provided more sample points for training.
The amplified clusters were separated into sub-training and sub-validation sets: 80% of the amplified clusters were used as the sub-training set, and the remaining 20% were used as the sub-validation set. With the amplified clusters formed, the sub-training set was enlarged for each candidate base classifier, which was beneficial for reducing the misclassification rate of each cluster during training. The candidate base classifiers were trained by the sub-training set composed of amplified clusters instead of the clusters generated by the mini-batch clustering technique directly.
Subsequently, the fuzzy membership degree of the sample points is allocated to the clusters. Each sample point x belongs to distinct clusters with different degrees. The sample point x is assigned to n clusters, and the distance from the sample point x to the nearest clustering center is measured using the Euclidean distance. The fuzzy membership M
i
of each sample point x is defined in Equation (1) as follows:
The selection of base classifiers affects the performance of the candidate classifier compositions. Eleven popular base classifiers, including KNN, LR, RF, GBDT, LDA, support vector machines (SVM) [14], MLP, AdaBoost, DT, XGBoost, and LightGBM, were evaluated. At this stage, the 11 candidate base classifiers were validated on the sub-training set composed of amplified clusters, and the five best performing classifiers were subsequently obtained.
The five best performing classifiers (i.e., GBDT, AdaBoost, DT, XGBoost, and LightGBM) with higher predictive accuracy were selected based on the area under the receiver operating characteristics (ROC) curve (AUC) [24] and the performance of each base classifier in the first stage. The fuzzy clustering-based classifier selection process was both adaptive and flexible. The selected five best performing base classifiers were not fixed but depended on the characteristics of the different datasets, considering that different base classifiers yielded different performances on different datasets.
In heterogeneous ensemble models, composing the best performing base classifiers does not directly result in the best performing heterogeneous ensemble model; it may even cause model overfitting [25]. To decrease the risk of overfitting and provide a contingency classifier composition, RS was applied to train candidate classifier compositions by randomly selecting several subspaces in the original feature space to enhance their robustness.
To maintain the diversity of candidate classifier compositions in a heterogeneous ensemble model, the candidate classifier compositions were composed of the permutations of the five best performing classifiers output from the last stage. Theoretically, the more best performing base classifiers selected to compose the ensemble model, the more candidate classifier compositions are produced, resulting in improved composition performance and increased computational complexity. Therefore, to deal with the tradeoff between them, the five best performing classifiers were output from the last stage through a trial run. For example, a candidate classifier composition can be composed of two or three classifiers belonging to the best performing classifiers. The total number of candidate classifier compositions is 26 and can be represented as
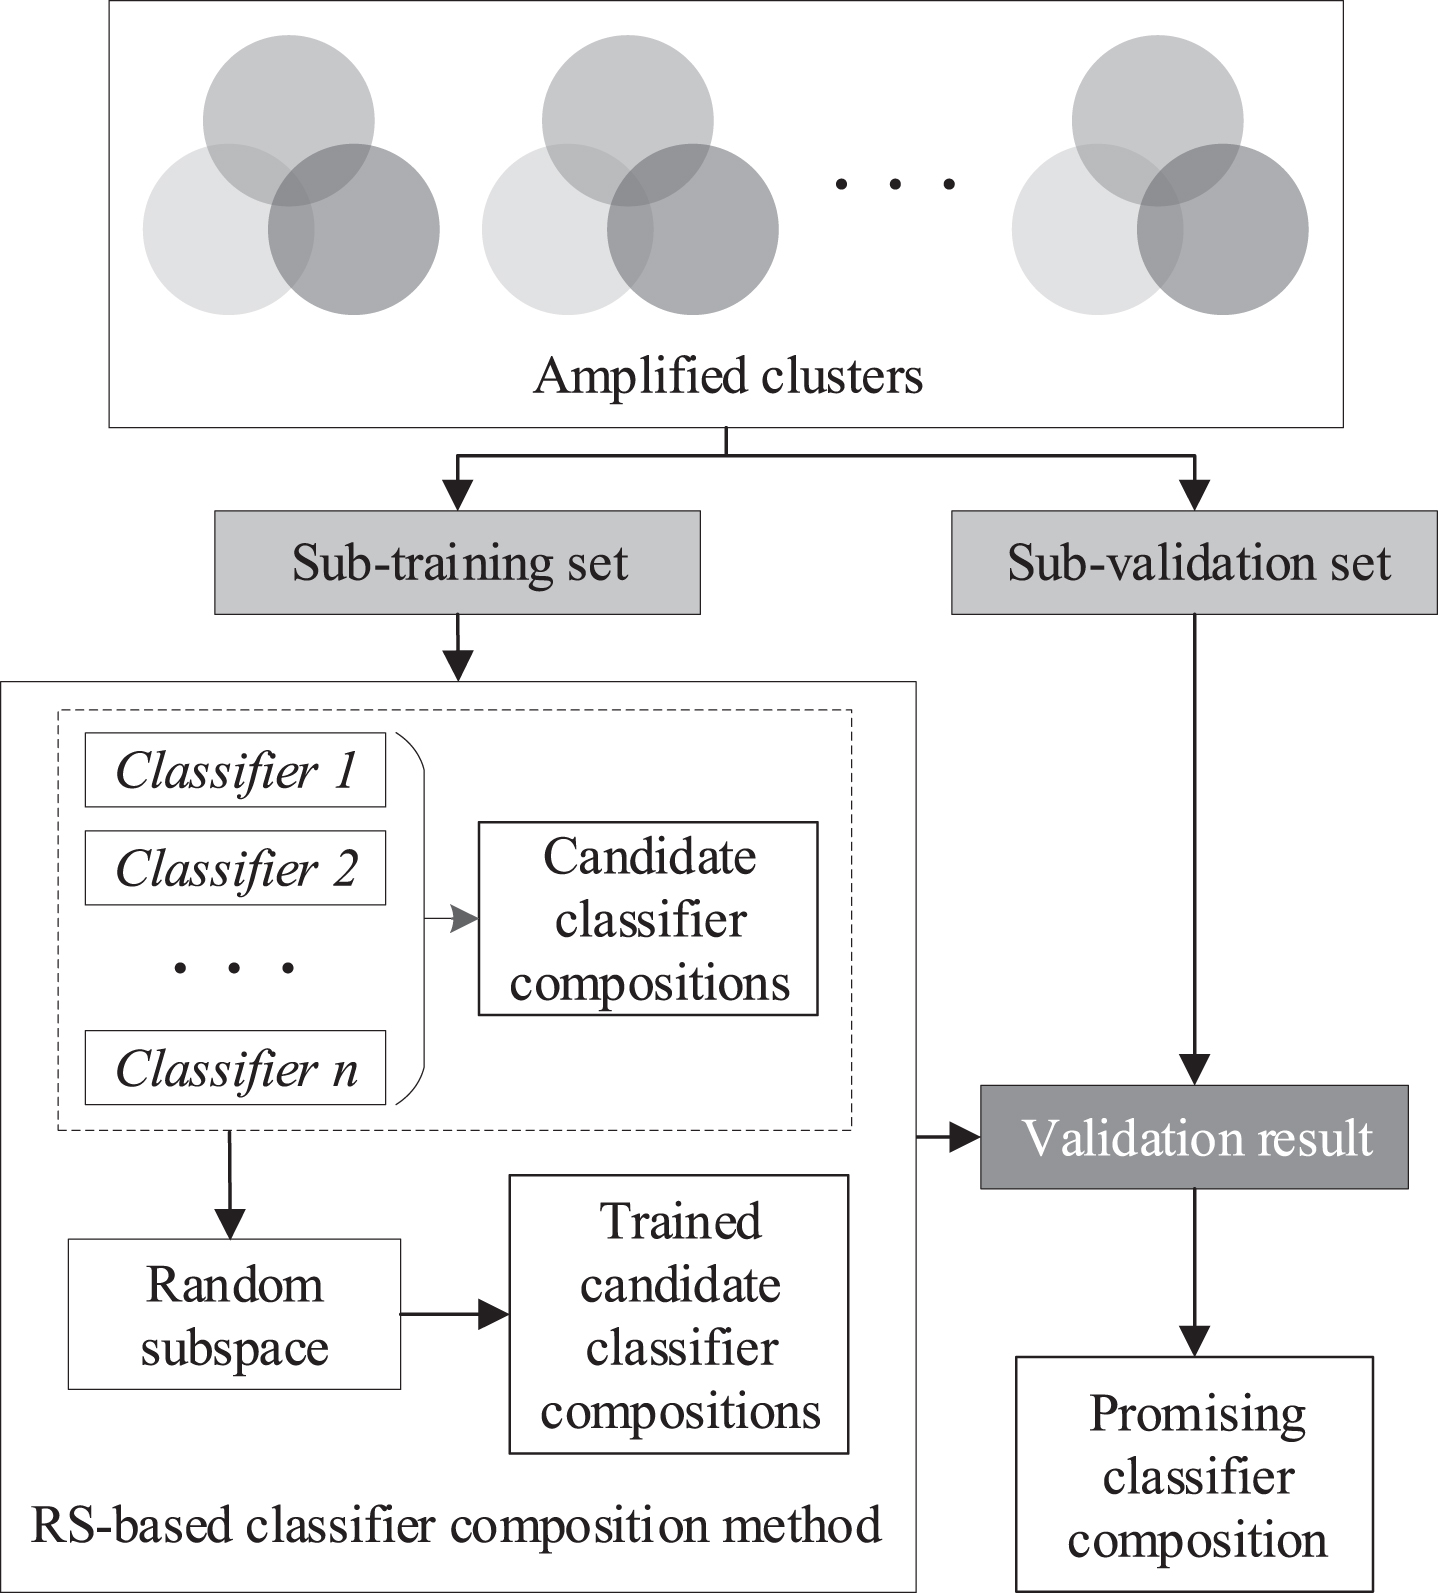
Schematic diagram of the RS-based classifier composition method.
The RS-based classifier composition process is adaptive. The output promising classifier composition is not fixed but depends on the characteristics of the different datasets, considering that different combinations of classifiers yield different performances on different datasets. The promising classifier composition can be further enhanced using the GA-based classifier compositional optimization method in the next stage.
In heterogeneous ensemble models, the instability of model performance caused by randomly selecting the parameters of the involved base classifiers must be avoided. In the GA-based classifier compositional optimization method, the GA is applied to optimize the parameters of the promising classifier composition by simulating the natural selection of Darwinian biological evolution based on chromosome representation, selection operation, crossover operation, and mutation operation. The fitness function was set to the AUC of the promising classifier composition. The main steps of the GA are as follows: initially, the fitness of individuals corresponding to each chromosome was measured. Next, the two individuals with the best fitness were selected as the parents to produce offspring through the crossover operation; subsequently, the chromosomes of the offspring were mutated; and finally, the aforementioned operations were repeated until a new population comprising the optimal individual was generated. As shown in Fig. 3, Parent 1and Parent 2are the individuals corresponding to the promising classifier composition output from the second stage with different parametric settings. Offspring 1 and Offspring 2 are the offspring generated by the crossover of Parent 1 and Parent 2, and Offspring 2 is the offspring generated by the mutation of Parent 1.
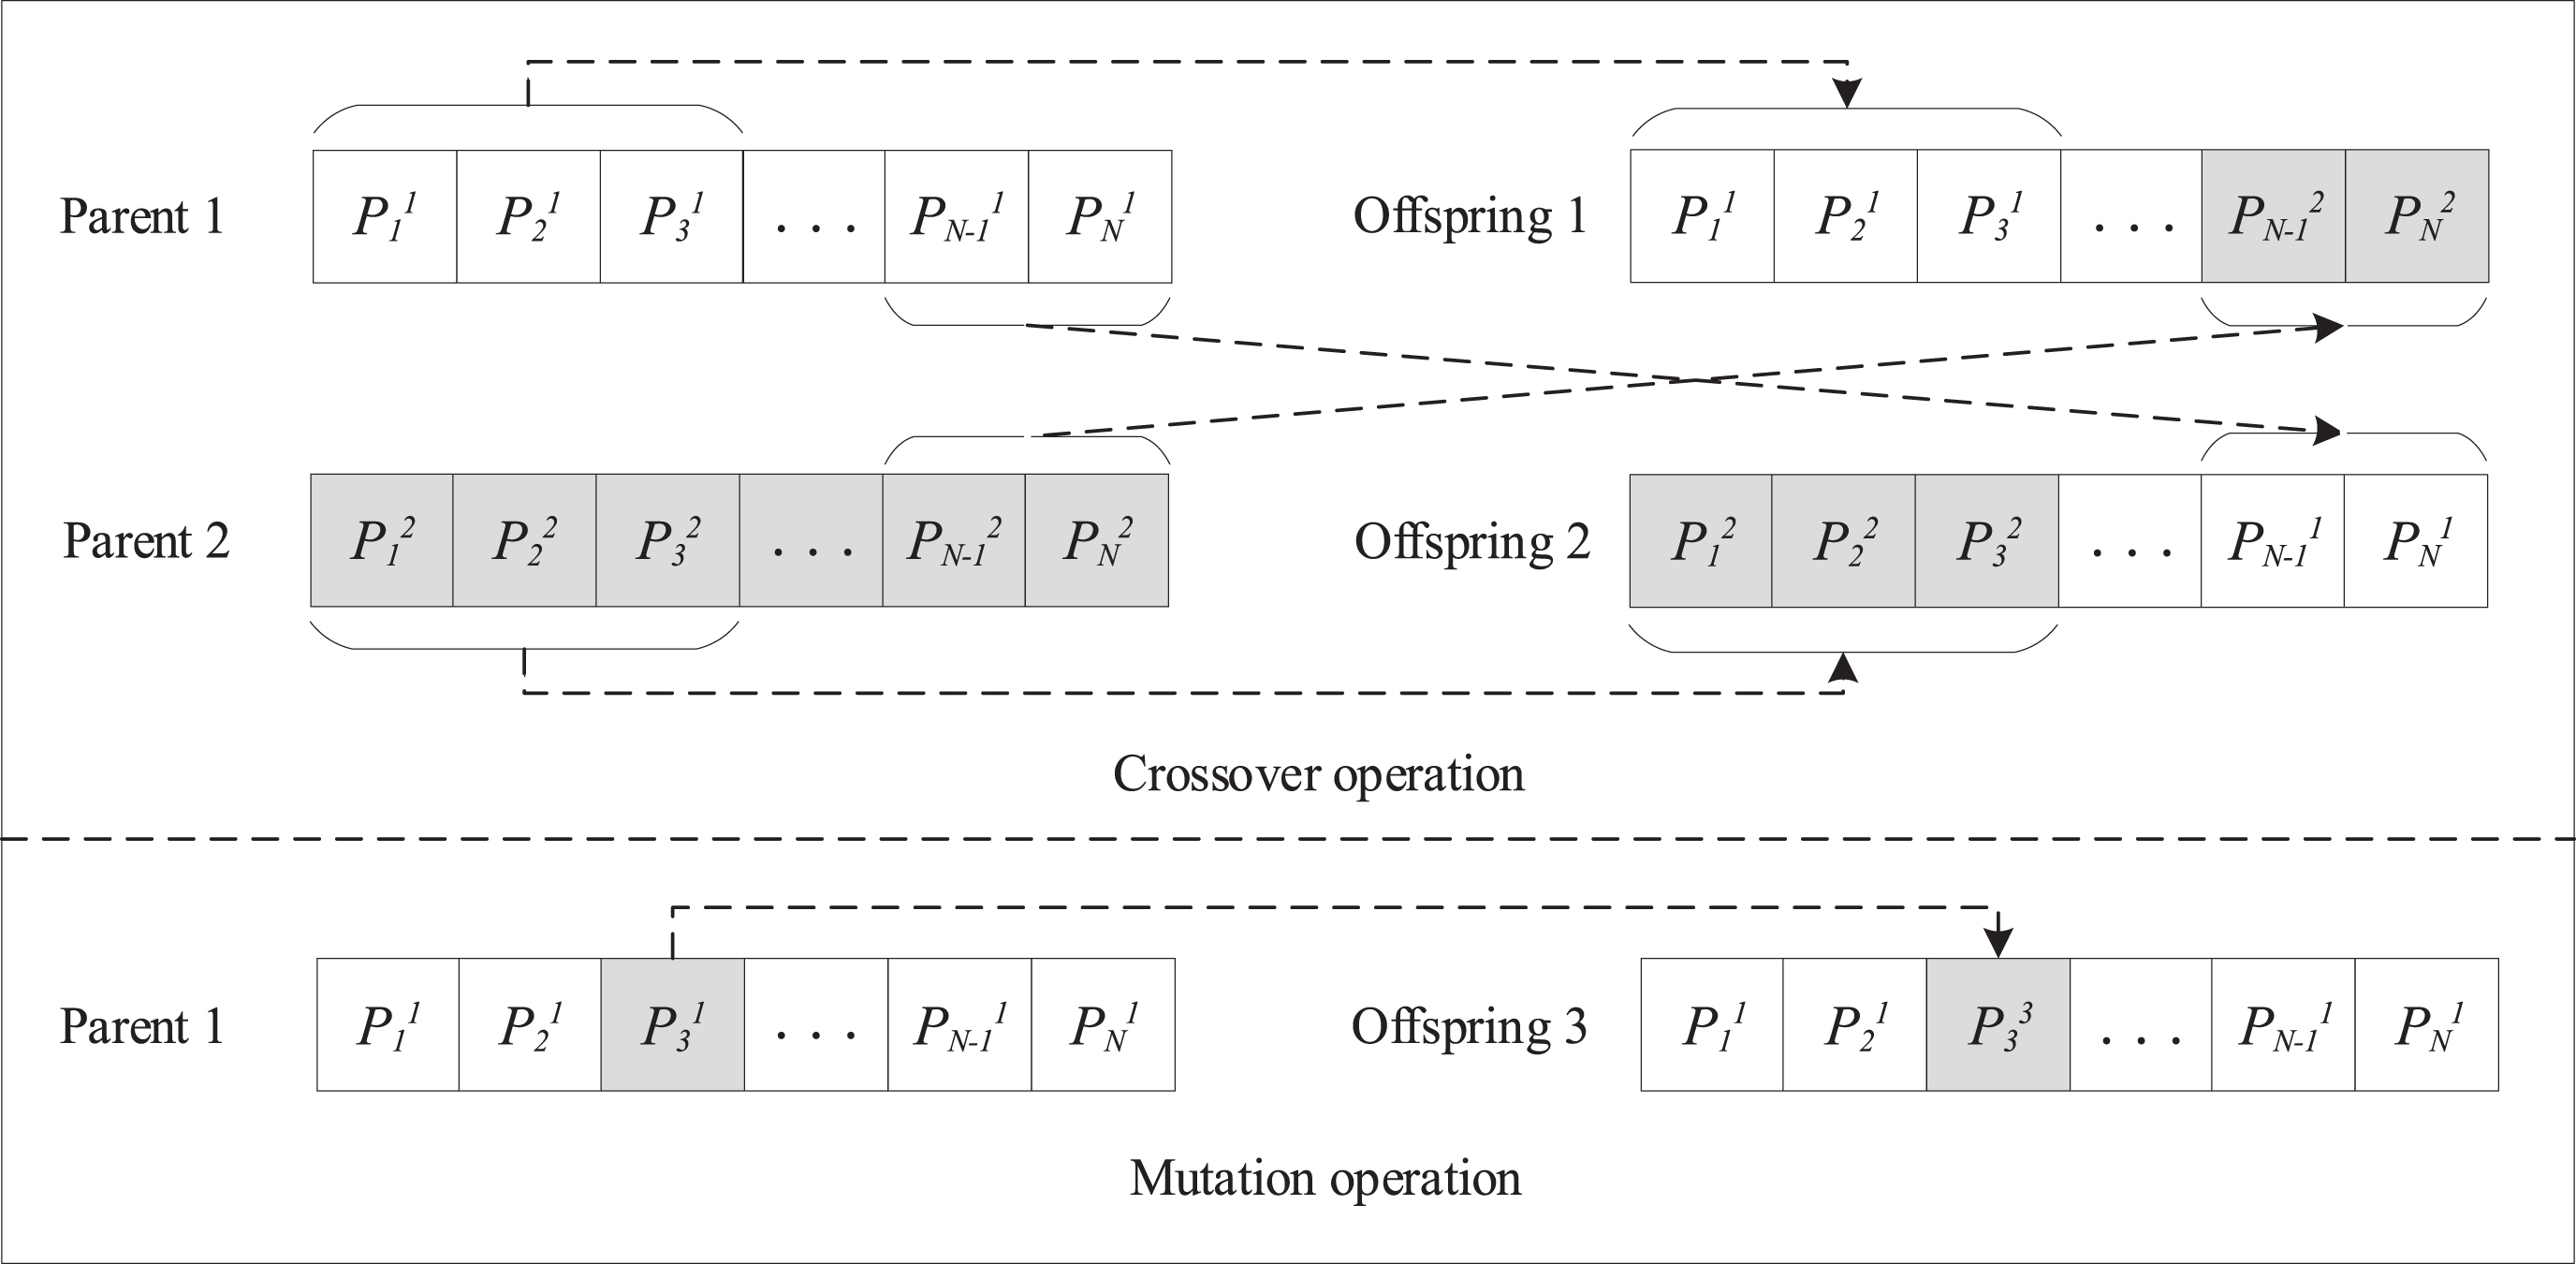
Schematic diagram of the GA-based classifier compositional optimization method.
The promising classifier composition is composed of several base classifiers. Each base classifier is determined by several parameters, including the number of estimators and the learning rate [26]. Consequently, the number of estimators corresponding to each base classifier influences the predictive performance of the promising classifier composition. The learning rate determines the loss function of the promising classifier composition [39]. The number of estimators is a positive integer, and the learning rate is a real number between zero and one. The parameters corresponding to all base classifiers of the promising classifier composition form a chromosome. For example,
The GA-based classifier compositional optimization process is adaptive. The output optimal classifier composition is not fixed but depends on the characteristics of the different datasets, considering that different parameterizations of classifiers yield different performances on different datasets.
As a powerful ensemble method, stacking is applied to the proposed model, combining the prediction of best performing base classifiers via a meta-classifier. Experimentally, LR proved to be the better choice for the meta-classifier in the proposed model.
Dataset description and data preprocessing
In this experiment, the datasets were from the UC Irvine (UCI) machine learning repository [55], which contain the real-world financial indicators of Polish manufacturing corporations from 2007 to 2011. The datasets were separated into five parts (each part representing a fiscal year) that described the period from the 1st year (2007 fiscal year) to the 5th year (2011 fiscal year), which corresponded to five different bankruptcy cycles. The class labels (“0” for operating and “1” for bankruptcy) of the datasets were determined using the bankruptcy status of the enterprise in 2012. Furthermore, another larger real-world dataset (i.e., Creator dataset) that was published by a Chinese intelligent government services provider called Creator Information Technology Co., Ltd 1 in 2019, was also adopted. The Creator dataset included company management information for 35960 Chinese companies.
Data preprocessing is crucial in the model. Some basic data preprocessing techniques, including dummy coding, data normalization, and correlation analysis, were applied to process the original datasets and yield an effective classification. Numerical features were standardized by removing the mean and unit variance. Subsequently, dummy coding and polynomial processing were applied to optimize the classification characteristics. Dummy coding can transform a continuous input variable into several dichotomous features, and polynomial processing can increase the diversity of features. Feature correlation analysis was also applied. For any two explanatory features whose correlation was greater than 0.97, only one was considered. The datasets were standardized and normalized to scale the data to within a unified, specified range.
Owing to the extreme imbalance between the number of corporations with financial risks and that of well-run corporations in the market economy, the SMOTE algorithm was applied first to increase the number of minority class samples. As shown in Table 1, six imbalanced datasets existed (named 1st-year, 2nd-year, 3rd-year, 4th-year, 5th-year, and Creator). Well-run corporations were abbreviated as WRCs, bankrupt corporations as BCs, and the imbalance ratio as IR. After the SMOTE process, the datasets became balanced; subsequently, the proportion between the positive and negative samples was 1:1.
Description of datasets with imbalance ratios
Description of datasets with imbalance ratios
In this study, four evaluation indicators were adopted, including accuracy (ACC), AUC, F-score, and logistic loss [8]. These indicators reflected the performance of models well, each holding different emphases. The evaluation indicators of the model, such as ACC and AUC, were determined by the value of true positive (TP), true negative (TN), false positive (FP), and false negative (FN) indicators. The confusion matrix shown in Table 2 is the foundation for various evaluation indicators typically used in classification prediction. The predictive accuracy is defined in Equation (2).
Confusion matrix
Confusion matrix
AUC is a statistical indicator of the advantages and disadvantages of classifiers typically used in binary classification tasks. In general, the actual dataset is imbalanced, with more positive samples than negative samples (or vice versa). AUC is less sensitive to imbalanced data. Although the predictive accuracies of classification models are similar, those with a higher AUC value will have better classification ability.
The F-score (also called F-measure) is defined in Equation (3). Precision is defined in Equation (4); it represents the proportion of TP samples classified by the classifier in all positive samples. The F-score is the harmonic average of precision and recall, in which the best value (perfect precision and recall) is one and the worst value is zero.
Log loss is known as the cross-entropy loss function, which is a loss measurement of the classification model. As is depicted in Equation (5), i represents the sequence number of the predicted sample and i∈ { 0, n }; n represents the number of samples; y
i
and p
i
represent the real value and the probability prediction, respectively; and y
i
∈ { 0, 1 }.
The raw dataset was divided as follows: 20% of the total data was used as the test data; the remaining 80% was used as the training data, which was further separated into two parts, where 80% was used as the training set and 20% as the validation set. Therefore, the ratio of the training set, validation set, and test data was 0.64:0.16:0.20. In each dataset, default parameters were utilized for the base classifiers before the GA-based classifier compositional optimization method was applied. The base classifiers were imported from the Python module “sklearn.” The SMOTE algorithm was imported from the Python module “imblearn.” In the mini-batch k-means algorithm, the number of clustering centers was set to eight, and the size of the mini-batches was set to 80. The number of adjacent clusters for each cluster was set to two (so that each amplified cluster was a union of three original clusters). When the GA was applied to optimize the parameters of the promising classifier composition, the number of genetic iterations was set to 30, the number of individuals in each generation to 30, the crossover rate to 0.8, the mutation rate to 0.05, and the fitness function to the AUC value. Experimental results and comparative analysis are elaborated in the next section.
Experimental analysis
Four indicators were adopted to evaluate the performance of the baseline classifiers and ensemble models. To enhance the robustness of the experiments and reduce fortuity, each experiment was performed 10 times, and the average values were calculated for evaluation.
Baseline results
To verify the performance of the proposed model, several baseline results are presented first for comparison. In the baseline experiment, 11 popular base classifiers, KNN, LR, RF, GBDT, LDA, SVM, MLP, AdaBoost, DT, XGBoost, and LightGBM, were applied. The performance was evaluated based on the AUC and F-score. For the same dataset, the values of the performance indicators are shown in bold if the base classifier performs better with SMOTE processing, as shown in Table 3. In Table 3, imbalanced datasets without SMOTE processing are represented as “raw dataset,” and balanced datasets with SMOTE processing are represented as “balanced dataset.” SMOTE processing improves the performance of base classifiers on evaluation indicators, but a fair comparison between before and after SMOTE processing is not affected because the SMOTE only processes the training set rather than the validation and test datasets. It is noteworthy that in raw datasets without SMOTE processing, the F-score values of many classifiers were approximately zero. This was because a severely imbalanced raw dataset prompted the classification preference to a larger proportion of the class during the prediction. The experimental results indicate that the base classifier performed better on the balanced dataset.
Baseline results
Baseline results
Note: In the same dataset, the value of performance indicators is shown in bold if the base classifier performs better with SMOTE processing.
To prove the effectiveness of the fuzzy clustering-based classifier selection method on the balanced datasets, the ACC, AUC, F-score, and log loss results on six datasets after the fuzzy clustering-based classifier selection method was applied were compared, as shown in Table 4. In Table 4, the balanced datasets without the fuzzy clustering-based classifier selection method applied are represented as “balanced dataset,” and the balanced datasets with the fuzzy clustering-based classifier selection method applied are represented as “clustered dataset.” For the same dataset, the values of performance indicators are shown in bold if the base classifiers perform better or the same after the fuzzy clustering-based classifier selection method is applied. As shown in Table 4, among the 11 base classifiers (except LDA), most of the ACC, AUC, F-score, and log loss values were improved after the fuzzy clustering-based classifier selection method was applied. As a variance-sensitive algorithm suitable for processing normally distributed datasets [20], LDA encounters a performance degradation after the fuzzy clustering-based classifier selection method was performed because the fuzzy clustering weakens the normal distribution of the sample points.
Performance evaluation of the fuzzy clustering-based classifier selection method
Performance evaluation of the fuzzy clustering-based classifier selection method
Note: In the same dataset, the value of performance indicators is shown in bold if the base classifiers perform better or at least the same after the fuzzy clustering-based classifier selection method is applied.
To prove the effectiveness of the RS- and GA-based optimized classifier composition methods, Tables 5 and 6 compare the ACC, AUC, F-score, and log loss results on six datasets after the RS-based classifier composition and GA-based classifier compositional optimization methods were applied. Through RS-based classifier composition, the promising classifier composition for each dataset was optimally selected from the 26 candidate classifier compositions generated by permutation and combination based on the five best performing classifiers, rather than the simple combination of the best performing classifiers, as elaborated in Subsection 3.2. In Table 5, the promising classifier compositions output by the RS-based classifier composition method corresponding to each dataset are shown, where Com 1 represents the promising classifier composition corresponding to the 1st-year dataset, Com 2 represents the promising classifier composition corresponding to the 2nd-year dataset, and so on.
Promising classifier composition for each dataset
Promising classifier composition for each dataset
After the promising classifier composition of each dataset was obtained, the GA-based classifier compositional optimization method was applied to optimize the parameters of the promising classifier composition. In Table 6, Optimal com 1 represents the optimal classifier composition corresponding to the 1st-year dataset, Optimal com 2 represents the optimal classifier composition corresponding to the 2nd-year dataset, and so on. The values of the performance indicators are shown in bold if the optimal classifier composition performed better than the promising classifier composition on each dataset. The results show that the optimal classifier composition always performed slightly better than the promising classifier composition with default parameters. The quantitative increase in the thousandth is indicated by a plus sign with the quantitative value in parentheses in Table 6. Although the quantitative increase in performance was marginal through single GA-based classifier compositional optimization, the combined quantitative increase of performance through fuzzy clustering-based classifier selection, RS-based classifier composition, and GA-based classifier compositional optimization will be significant, as will be shown in the next experiment discussed in Subsection 5.4.
Performance comparison after GA-based classifier compositional optimization method is applied
Note: The value of performance indicators is shown in bold if the optimal classifier composition performs better than the promising classifier composition on each dataset.
A performance comparison through the ACC, AUC, F-score, and log loss after the GA-based classifier compositional optimization method was applied on six datasets, as shown in Figs. 4 and 5, respectively. They show that the optimal classifier compositions performed better than the promising classifier compositions on the same dataset.
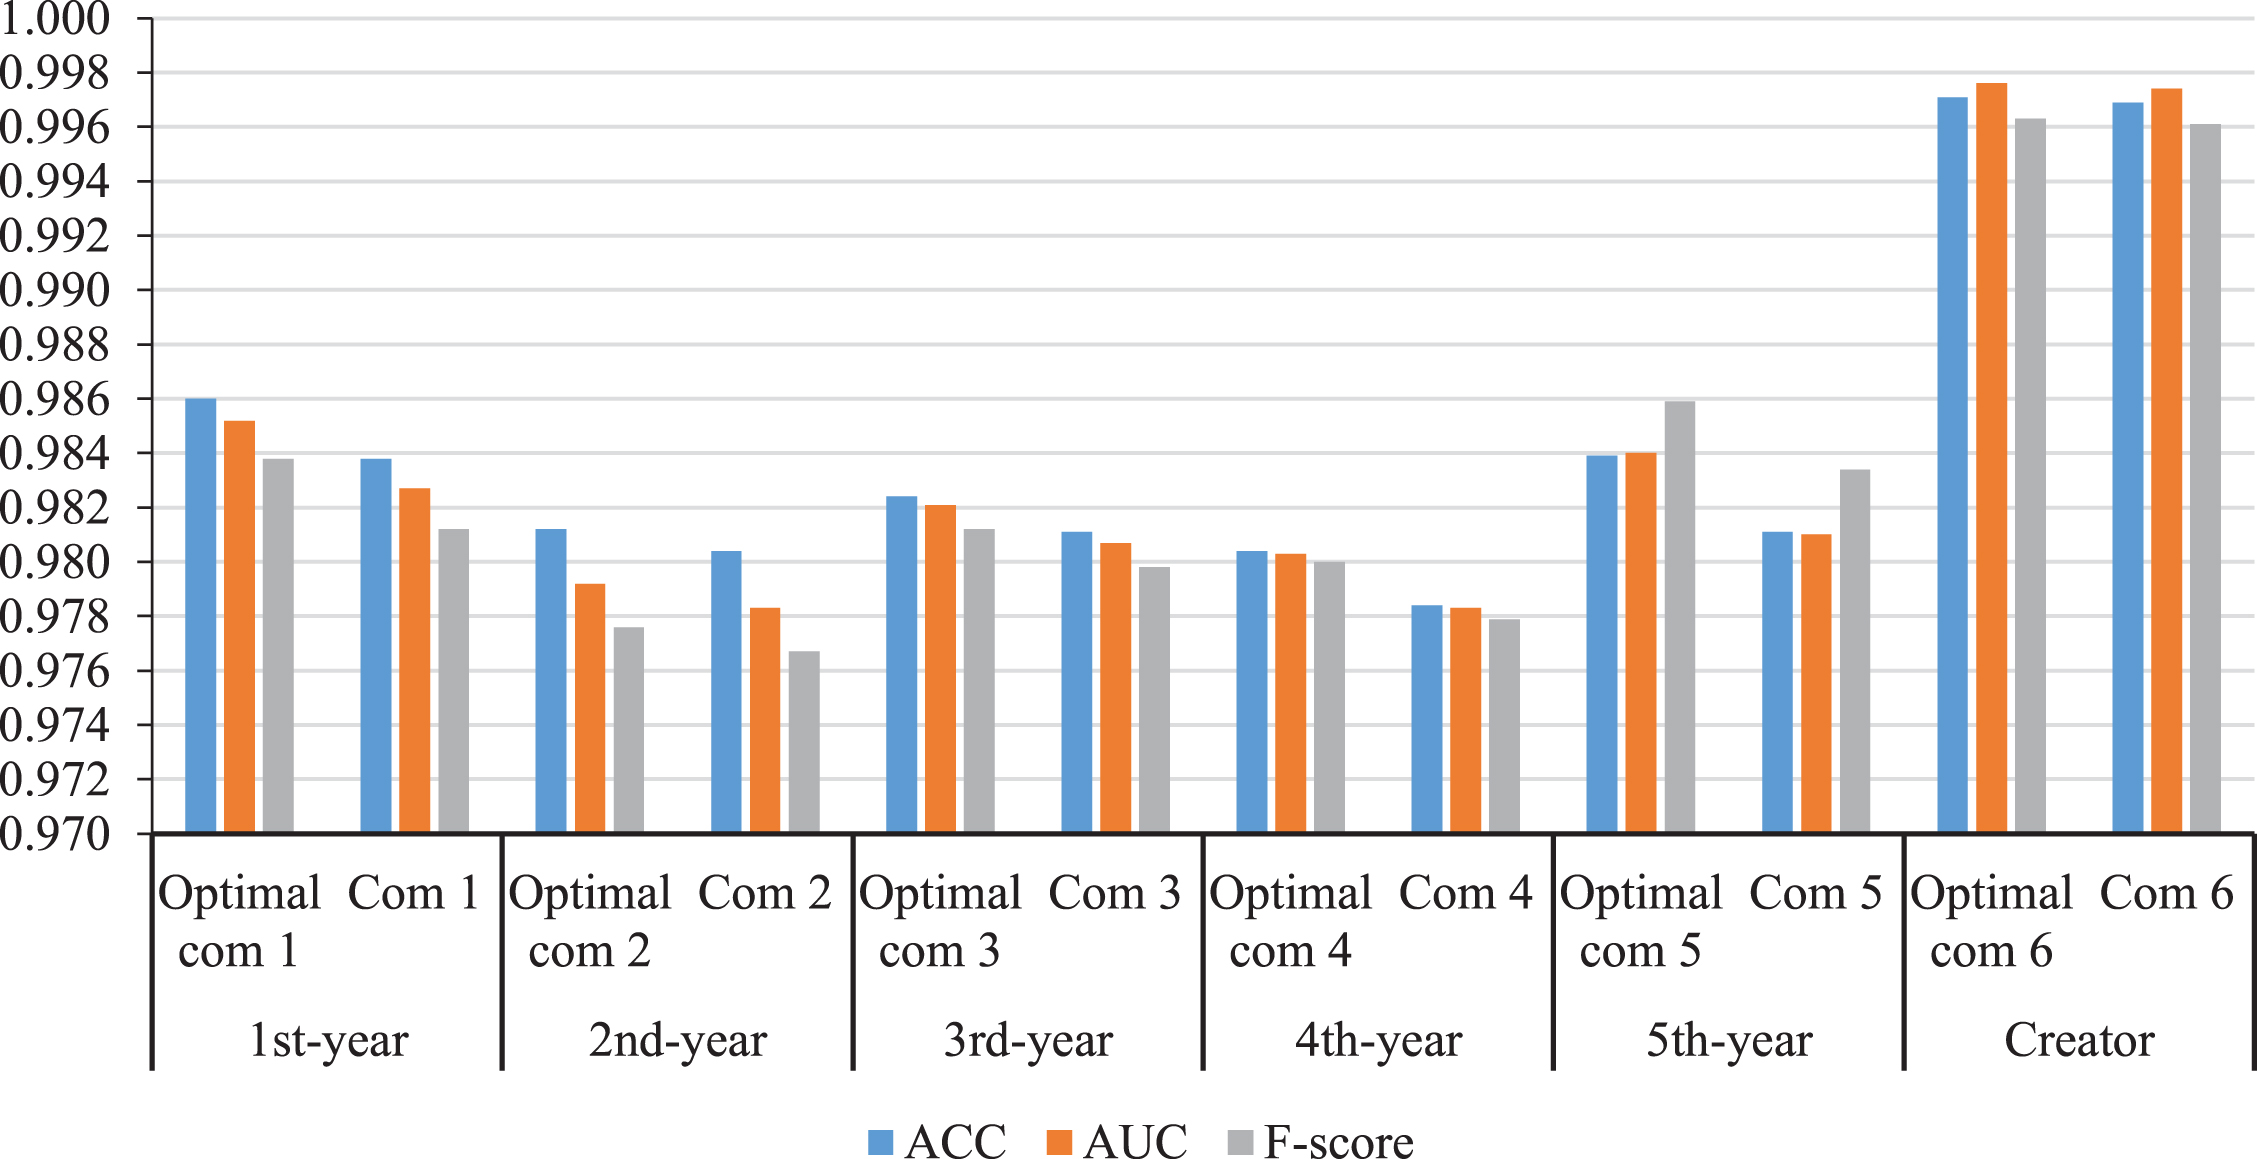
Performance comparison through the ACC, AUC, and F-score on six datasets.
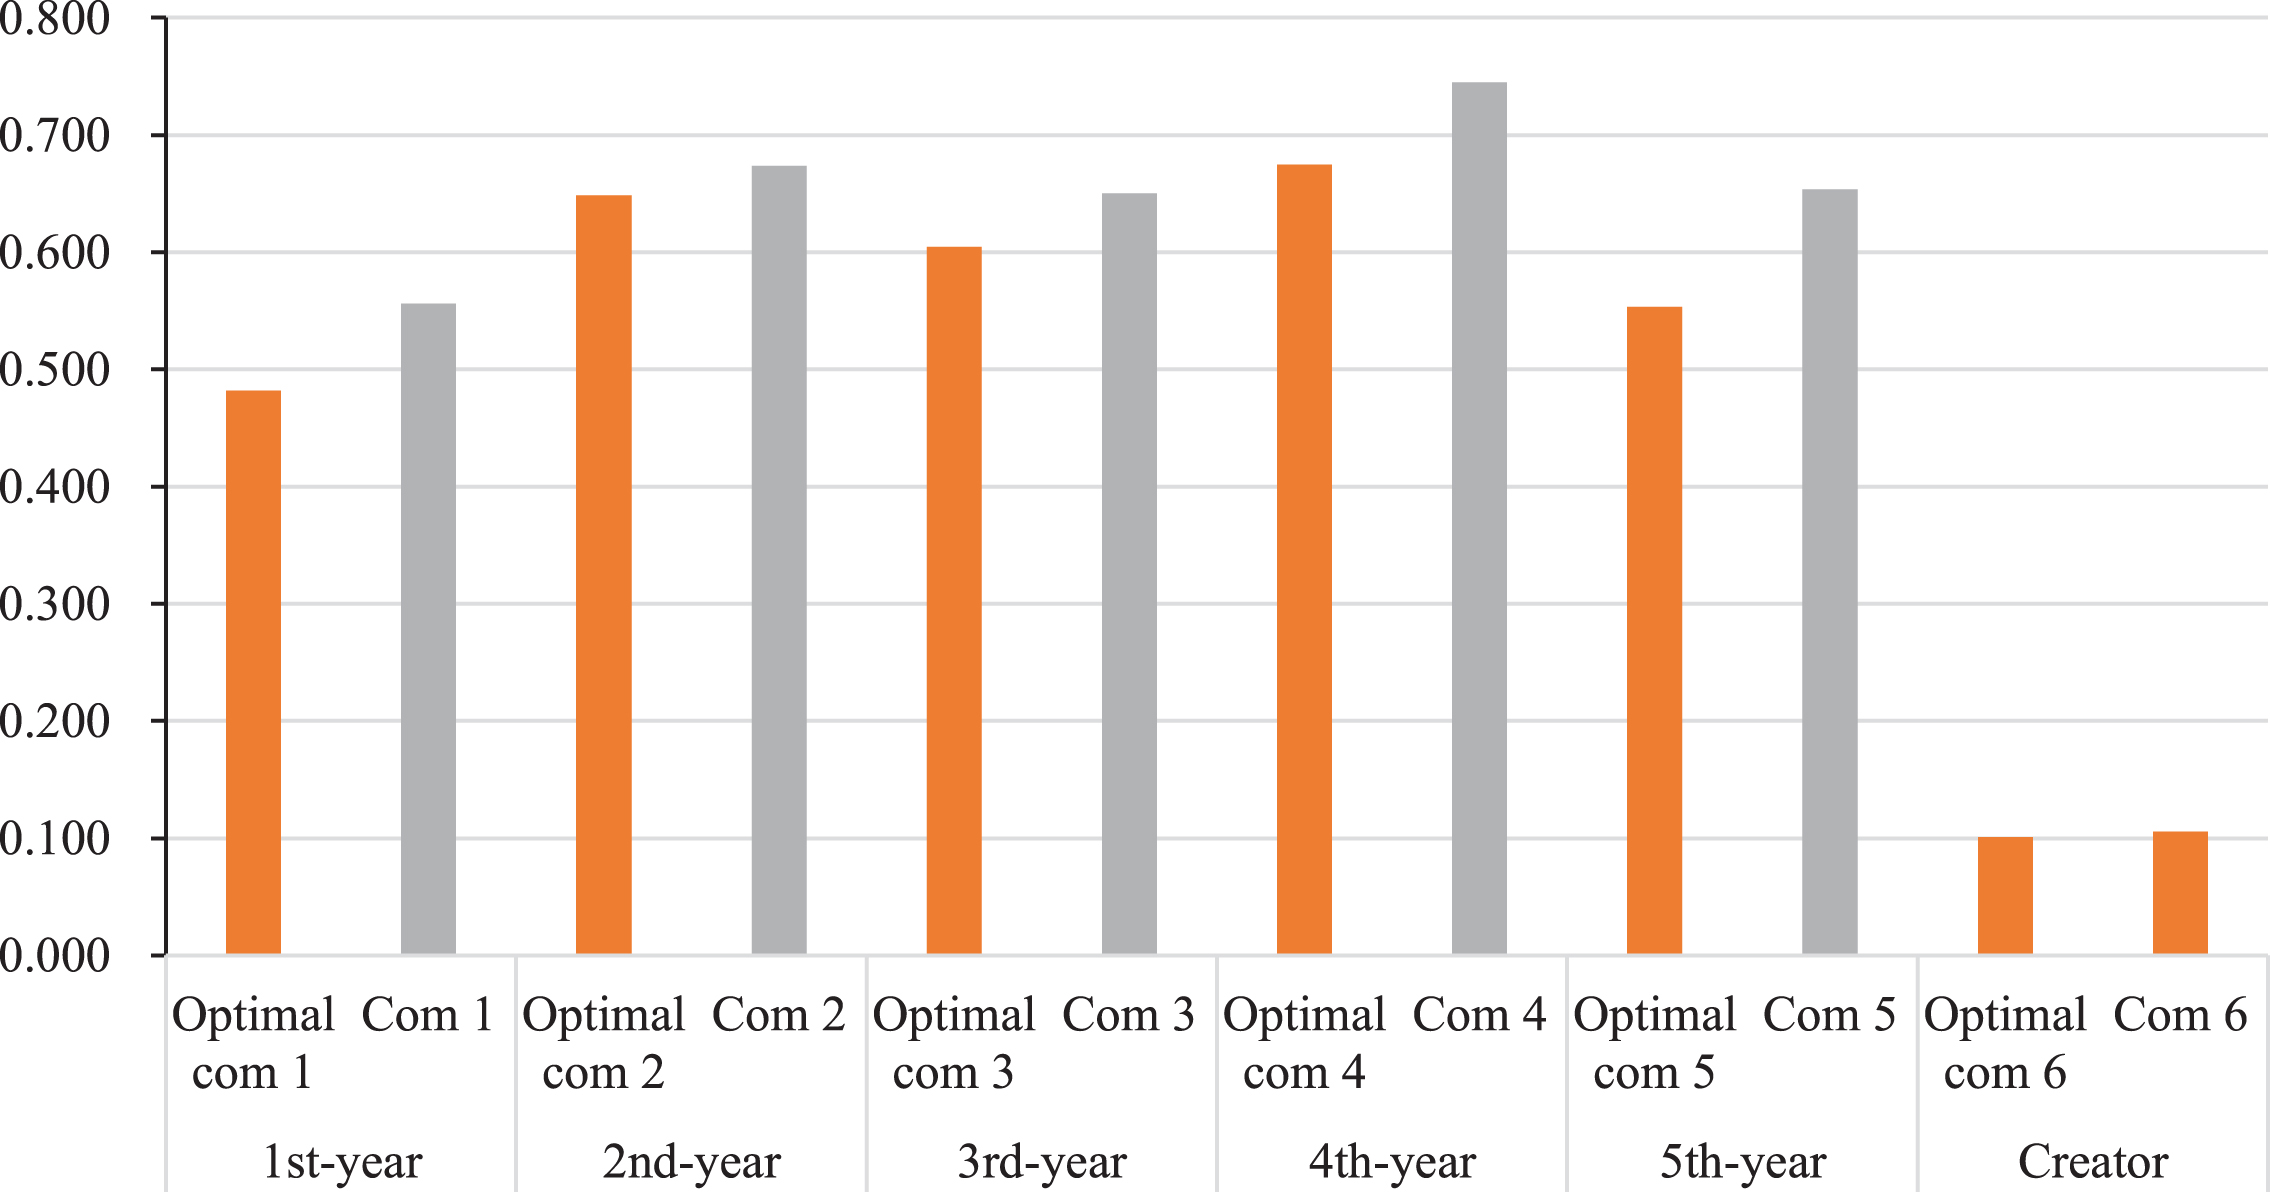
Performance comparison through the log loss on six datasets.
As shown in Table 7, the optimal classifier composition corresponding to each dataset was compared with a benchmark ensemble model for bankruptcy prediction based on the EXGB model proposed by Zięba et al. [55]. In the study by Zięba et al. [55], only AUC was adopted to evaluate the model performance, whereas ACC, AUC, F-score, and log loss were adopted for model evaluation in this study. The value of AUC is shown in bold if the optimal classifier composition performed better than the benchmark EXGB model for each dataset. The results showed that the optimal classifier composition performed better than the EXGB model for each dataset. The detailed quantitative increase in the thousandth is indicated by a plus sign with the quantitative value in parentheses in Table 7.
Performance comparison between the optimal classifier composition and the benchmark ensemble model
Performance comparison between the optimal classifier composition and the benchmark ensemble model
Note: The value of AUC is shown in bold if the optimal classifier composition performs better than the benchmark EXGB model on each dataset. “/” indicates that the corresponding evaluation indicators are not presented in the study by Zięba et al. [55].
A performance comparison of the AUC between the optimal classifier composition and the benchmark EXGB model on five datasets is shown in Fig. 6. This shows that the optimal classifier composition performed better than the benchmark EXGB model on the same dataset.
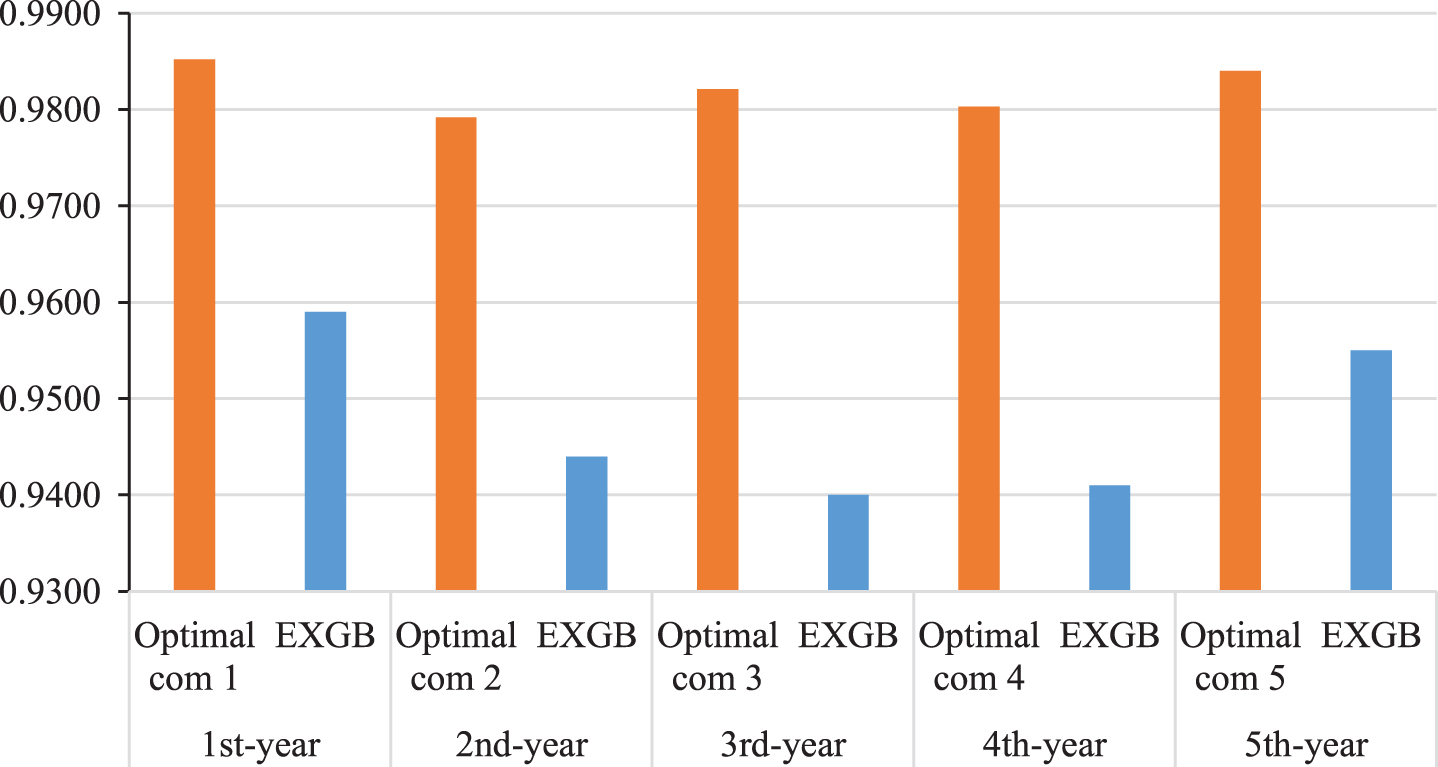
Performance comparison of the AUC between the optimal classifier composition and the EXGB model on five datasets.
The average running times (in seconds) and time standard deviations of the fuzzy clustering-based classifier selection method, RS-based classifier composition method, and GA-based classifier compositional optimization method for each dataset are shown in Table 8, indicating the small difference in running times among the 10 runs.
The average running times of the proposed model for each dataset
With the development of the international credit system and the improvements in capital efficiency, the credit funds of financial institutions have become the engine of the rapid expansion of manufacturing corporates. To improve the security of issuing credit and identifying high risk credit requests, the development of an efficient classification model has been encouraged. However, large-scale imbalanced data remains a barrier to bankruptcy prediction.
In this study, a novel multi-stage ensemble model with fuzzy clustering and optimized classifier composition to achieve good corporate bankruptcy prediction was proposed, combining the fuzzy clustering-based classifier selection method, the RS-based classifier composition method, and the GA-based classifier compositional optimization method. The proposed model was adaptive and outperformed benchmark models across all indicators studied. The performance of the proposed model was evaluated using four evaluation indicators: ACC, AUC, F-score, and log loss. The experimental results demonstrated the superior performance of the proposed model.
In future studies, it is essential to reduce the overall complexity and computational cost of the model. Additionally, large corporate financial data, real-time transmissions, and highly concurrent data flow pose major challenges to real-time analysis and predictive ability [44]. Therefore, a more effective and efficient financial prediction model of corporate bankruptcy that exhibits high performance and low time complexity must be developed.
Data availability statement
The experimental data used to support the findings of this study have been deposited in the Figshare repository (https://doi.org/10.6084/m9.figshare.12911336).
Conflicts of interest
The authors declare that there is no conflict of interest regarding the publication of this article.