
Abstract
Recommender systems have recently become a significant part of e-commerce applications. Through the different types of recommender systems, collaborative filtering is the most popular and successful recommender system for providing recommendations. Recent studies have shown that using multi-criteria ratings helps the system to know the customers better. However, bringing multi aspects to collaborative filtering causes new challenges such as scalability and sparsity. Additionally, revealing the relation between criteria is yet another optimization problem. Hence, increasing the accuracy in prediction is a challenge. In this paper, an aggregation-function based multi-criteria collaborative filtering system using Rough Sets Theory is proposed as a novel approach. Rough Sets Theory is used to uncover the relationship between the overall criterion and the individual criteria. Experimental results show that the proposed model (RoughMCCF) successfully improves the predictive accuracy without compromising on online performance.
Introduction
With the rapid development of the Internet, people can reach any kind of information quickly via electronic devices such as personal computers, tablets, smartphones, etc. People can operate their financial operations through the banks without going to branch, buy a book, movie, music album or cloth without going to malls or search for places to stay before their traveling. The services that people could reach are increasing more and more with the rapidly thriving technology. Even only a couple of online e-commerce web sites like Amazon and eBay have millions of products offered to their customers. However, this diversity of products and services makes it almost impossible for the customers to find the right product. Likewise, choosing the perfect restaurant in a city or finding the most efficient paper about any research is also a case to consider. To alleviate these kinds of problems, recommender systems are proposed [16, 26].
Recommender systems are the systems which produce prediction about the products that customers do not have any idea about them. In order to produce the predictions, the system needs to learn the characteristics of customers. There are different types of recommender systems according to their prediction approaches: Content-based filtering [33], collaborative filtering (CF) [5, 27], demographic filtering [13], case-based reasoning [6] and hybrid approaches [32, 39]. The most popular and widely used recommender system is CF system [28]. Today, this system is used in many areas such as e-commerce web sites, hotel recommendations, search engines, etc. The main idea underlying CF is that the customers who specify similar preferences to the same products will also have the similar inclinations in the future. Therefore, firstly, the system finds the most similar users - in other words, the neighbors - to the target user called as the active user then makes prediction to learn if the user will like or dislike the desired product by using the preferences of the neighbors for that product.
The traditional CF systems produce predictions by using the preferences that users have about products as a whole. Nevertheless, in some cases, considering the product as a whole may not reveal the customers’ real preferences. For example, when we review a movie, we evaluate it in different aspects, such as the director, fiction, cast, visual effects, etc. Two users who watch the same movie, one may have liked the movie because of its cast, while the other one liked it because of its visual effect, but they both may have similar opinion for the movie in general. In this case, the traditional CF systems may choose those users as neighbors, but actually, it may not mean that those users are similar. This situation prevents the system to make accurate predictions. In order to deal with that problem, the Multi-Criteria Collaborative Filtering (MCCF) systems are proposed [8, 35].
While producing predictions in multi-criteria data, there exist bigger problems in comparison with traditional single-criteria data. Since the data sets using in MCCF systems are multi-dimensional and most users rate very few items or none at all, the sparsity and scalability issues pose much greater problems. Due to these kinds of problems, the success and performance of the MCCF methods decrease. Although there are many studies in the literature to overcome these problems [10, 38], suggesting better and more effective solutions is still a necessity. Therefore, new approaches to minimize the sparsity problem can be proposed. Rough set theory (RST), which was set forth by Pawlak [1] in the early 1980 s, is a mathematical tool to discover hidden pattern in data while analyzing it. It is a popular approach analyzing incompleteness, vagueness, uncertainties in data in many disciplines such as data mining, pattern recognition etc. The success of RST in discovering the structural relationships within imprecise data is the most important reason for employing it in MCCF. Furthermore, unlike approaches such as Fuzzy Sets [41], Dempster-Shafer theory [37], Neutrosophic Set [34, 36] the RST does not need any membership function or additional information about data. So, it is another important reason for using it in this research field. Finally, to the best of our knowledge, this is the one of few studies employing RST in this research field and showing the potential contributions of RST to MCCF.
The main focus in this research is to propose an MCCF system, which uses RST to infer weights of criteria for each product. By using RST, importance of each criterion over products are calculated and the weights are formed for all products. Then, these weights are used while making prediction for overall ratings of each product. In summary, an MCCF recommender system which makes criterion weighting is proposed in this study.
The rest of the paper is organized as follows. In section 2, we briefly explain MCCF systems and RST. In section 3, we discuss the related studies about our research field. In section 4, we describe how RST can be applied into the MCCF systems. In section 5, we present the experimental results of our proposed system. Finally, we summarize our paper in the last section.
Preliminaries
A. Multi-criteria collaborative filtering recommender systems
MCCF systems allow the customers to evaluate the products in different aspects and offer more personalized and qualified predictions compared to the traditional ones. In these systems, the data matrix has three dimensions as user, item and criterion. The system assigns e number of criteria for the products and asks user to give their preferences about those criteria of the product. There are also one more criterion besides those e number of criteria for overall ratings; thus, users may give their preferences about the product as a whole and for the other aspects except those criteria. With e number of criteria and the overall rating criterion, the users give e + 1 number of ratings about a product. The system collects those ratings into a three-dimensional User×Item×Criteria matrix and make prediction by using those data.
Multi-criteria recommender systems are often considered as the extended version of the traditional single-rating recommender systems and categorized into two major approaches [18]: Similarity-based and aggregation-function based. The similarity-based methods calculate the similarities for each criterion and choose worst or the average value for the overall ratings. Adomavicius and Kwon [8] proposed two different approaches for similarity-based overall rating estimation: using the average and minimum of the criteria similarities. The reason for choosing the minimum similarities is to determine the system performance in the worst-case scenario, while the reason for choosing the average similarities is to bring an objective approach. The aggregation-function based MCCF systems infer a function from criteria and then give prediction for overall ratings by using this function. The main idea underlying those systems is that there is a relation between the overall rating and the criteria of the product. The researchers think that each criterion somehow has an effect on the overall rating [19, 23]. In some systems, this relation may differ from user to user, while in some systems, it is constant for each user and determined by domain experts. The ratios of the criteria for each user may be established via some statistical methods like regression analysis or machine learning techniques. Once the ratios are established, the overall ratings are computed by combining the weighted ratings [8]:
In this equation, r0 represents the overall rating, w i represents the weights of each criterion, r i represents the ratings given for each criterion for the target item i of active user a and c is the constant estimated from the data.
One of the main techniques developed for interpreting the insufficient data is the RST. RST is a mathematical tool that overcomes the uncertainties in sets within missing, inconsistent or unnecessary data [2]. It helps us to reveal the hidden patterns inside of the data. Additionally, it is used in many operations such as selecting the core attributes, unveiling the core attributes or obtaining decision rules. RST’s great performance on these operations makes it preferable in many areas by the researchers.
Information system (IS) which forms the first phase of RST is a matrix that includes objects in its rows and attributes in its columns. Let U to be a finite set of objects called the universe, and let A to be finite set of attributes on U. The pair S = (U, A) is called an IS. Each object A is described by a function a: U ⟶ V
a
such that V
a
, for each a → A, is the domain of attribute a. Each subset B ⊆ A of attributes specifies a relation IND
s
(B), called as the discernibility relation, defined as follows:
If X set of objects could not be precisely identified by using the features of B ⊆ A, the lower and upper approximations of X are computed by the system, such assumptions can be explained as follows:
1- B-Lower Approximation set, shown as R(X), is the set of objects which is exactly a member of X:
2- B-Upper Approximation set, shown as
According to the literature review, MCCF systems are categorized into two approaches as similarity-based and aggregation-function based. While similarity-based MCCF approaches work like an extension of traditional CF systems with a little bit difference on metrics used to reveal similarity, aggregation-function based MCCF approaches focus on learning regression functions to reveal the effect of criteria over products or users. Similarity-based approach: Main goal of the multi-criteria recommender systems is to predict an overall rating to the items that users give their preferences for those items in different perspectives. Multi-criteria environments are the multi-dimensional version of the traditional single-rating systems. Thus, MCCF systems can be extended from traditional CF. The similarity-based approach proposed by Adomavicius and Kwon [8] is the baseline for multi-criteria recommendation. Aggregation-function based approaches: This type of approaches focuses on the assumption that there exists a relationship between the overall item ratings and individual item ratings. Technically, overall ratings can be determined by a function that expresses the relation of individual criteria ratings. Aggregation-function based methods can be divided into three main categories depending function extraction approaches: methods based on regression, machine learning and other theories.
Methods based on regression: The regression is used for extraction of the relation between individual criteria ratings and the overall ratings. For example, Jannach, et. al. [12] proposed a support vector regression model to determine the relative importance of different criteria combining the user-based and item-based regression models with a weighted approach. Nilashi et. al. [19] proposed a MCCF method incremental SVR and clustering techniques. The customer segments are detected using clustering and importance weights are learned for the different quality factors through regression. The combination weights are optimized for the cluster-based functions by minimizing the prediction error. Jhalani et. al. [23] used multi-linear regression for weighting individual criterion and computing the overall ratings of each item.
Methods based on Machine learning: This kind of methods is based on the usage of machine learning algorithms for revealing the aggregation function. Liu, Mehandjiev and Xu [11] applied ANFIS for MCCF to extract fuzzy rules combined with subtractive clustering and dimensionality reduction. Nilashi et. al. [24] produced a method which uses Adaptive Neuro-Fuzzy Inference System (ANFIS) combined with subtractive clustering and Higher Order Singular Value Decomposition (HOSVD). They also proposed a hybrid method for hotel recommendation using dimensionality reduction to enhance the predictive accuracy by using ANFIS [28]. Nassar et. al. [42] proposed a novel MCCF method using deep learning for obtaining both users and items’ features.
Methods based on other theories: All other methods proposed to solve MCCF problems are populated in this category: soft computing techniques such as fuzzy sets [25], neutrosophic sets [34, 38], RST for function extraction [29] and hybrid approaches for solving multiple problems [10, 21].
Considering all the studies mentioned above, it is seen that there are studies which focus on RST for multi-criteria decision making [2, 40] but there is only a few applications [29] for MCCF systems that have operated RST so far. In this study, RST is used to uncover the weights of criteria for making overall rating prediction.
Multi-criteria collaborative filtering using rough sets theory
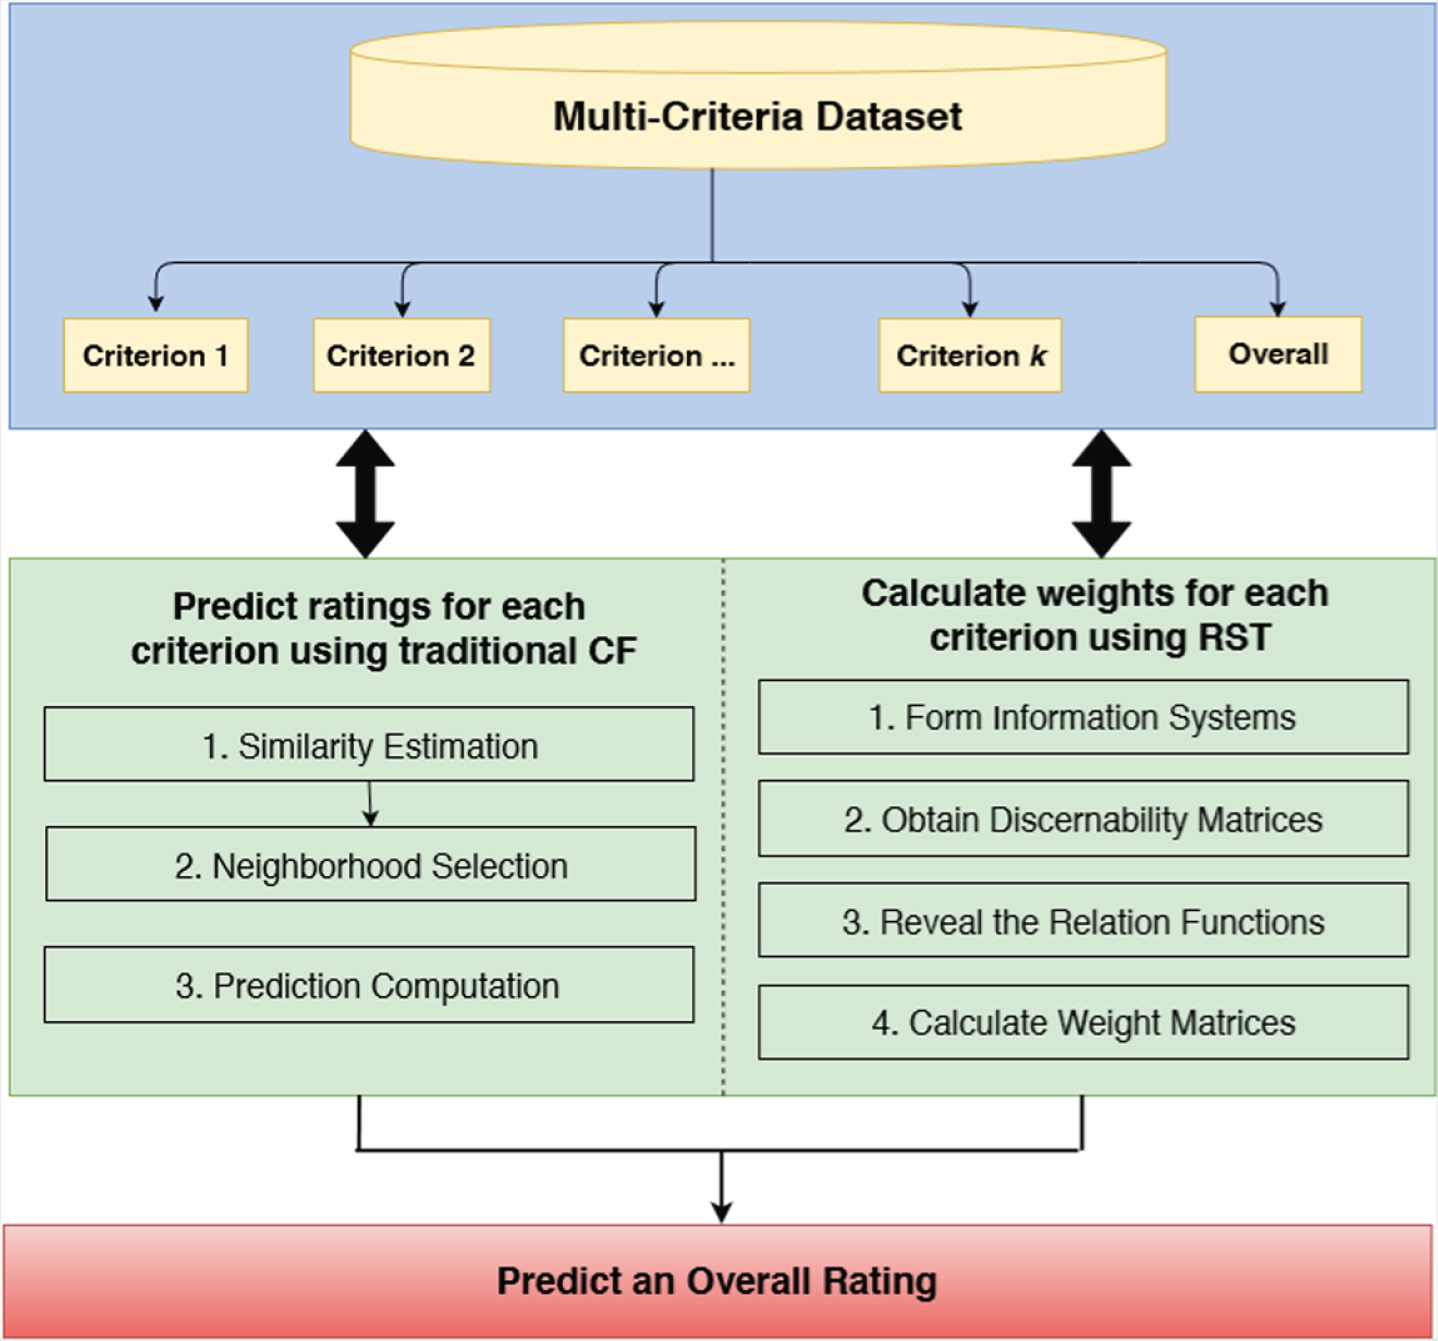
As mentioned previously, MCCF systems are divided into two categories as similarity-based and aggregation-function based upon the overall rating prediction estimation. Similarity-based MCCF systems are considered to be k-dimensional traditional CF systems together, and each step in the prediction process is similar to the traditional one. Aggregation-function based methods inspect the relationship between the overall item ratings and the individual criteria ratings. The system tries to reveal the regression function from the criteria and uses it to give rating for overall criterion. At this point, RST can be used for uncovering the regression function. If we assume that each criterion is an attribute and the rating is a value of the attribute, we can say that RST can give us the correlation between each criterion by using the ratings within.
The general framework of proposed model is shown in the Fig. 2. From this figure, in the first step, the ratings provided by the users are predicted using traditional CF for each criterion except the Overall. Then, in the next step, the individual weights are derived using RST. In the last step, the ratings and the weights are combined to predict the overall ratings. Each step is described in detail in the next section.

Concept of Rough Sets Theory and its Approximations.
Overview of the Proposed Method (RoughMCCF).
For making predictions to the e number of criteria, traditional CF system is applied. The system has three stages: similarity estimation, neighborhood selection and prediction. In similarity estimation stage, the system weights all users with respect to similarity with the active user. Weights are defined by Pearson Correlation coeffcient metric. PCC examines the linear relationship between two entities. It has a value between –1 and 1, where 1 is total positive linear correlation, 0 is no linear correlation, and –1 is total negative linear correlation. For example, if the PCC similarity between two entities is 0.7, then we know that these two entities are 70 percent similar. The formula of the PCC is represented as follows [6]:
Once the weights are calculated, they are sorted in descending order, and k number of weights is selected as neighbors to the active user [30]. Finally, the system combines the ratings from neighbors to compute a prediction.
The first step in predicting ratings for traditional CF systems is to weight all users with respect to similarity. In the literature, there are several similarity metrics, such as Jaccard, Cosine, Euclidean, Pearson Correlation coefficient (PCC), Spearman correlation, etc. We used PCC in our system to reveal the weights between users.
Neighborhood selection
Once the similarities between entities are set, the system can tell which entities are more related for the target item or not. The entities with the highest similarity are chosen as the neighbor to the target entity. Mainly, there are two types of approach to choose the neighbors: k-Nearest Neighbor (kNN) approach and threshold decision. In kNN approach, the distance of each record in the database with other records is calculated and only the k number of distances is taken into account [30]. For example, if k is chosen as 10, the system is interested in the most 10 similar entities to the target entity and ignores the rest of it. If system decides to take a threshold value, then every entity which has higher value than the threshold value will be chosen by the system [3]. In this study, kNN approach is used for the neighbor selection.
Prediction computation
When the similarity estimation and neighborhood selection steps are performed, computing prediction stage can be handled with the help of the ratings given by the neighbors. At this stage, prediction from a weighted combination of selected neighbors’ ratings is computed with the equation below [5]:
This section introduces the second part of our proposed method: Calculating the weights using RST. In order the accomplish the process, firstly, the system creates the IS for each item by using the ratings of users. Then, the discernibility matrix is formed by using the data stored in the IS. The discernibility matrix helps us to discover the relation functions for each of the product. Once the system unveils the relation functions, the next step is finding the core attributes –in other words the criteria –using Boolean algebra methodology. After finding the core attributes, the weight matrix which shows the significance of each criterion over the product is formed. Finally, the overall ratings are computed by combining the weights calculated by RST and the predictions are calculated by CF using an aggregation function.
Form the information system
The first stage of the proposed method is to form IS for each of the product. IS uses the user-criterion ratings matrix S(i, c) to represent items’ information. S(u, c) is a u × c matrix, in which u rows denote u users, c columns denote c criteria, and S(i, c) is the rating of the item on criterion c. In Table 1 and Table 2, there is a sample data set to illustrate this estimation process.
A Sample User×Item×Criteria Matrix
A Sample User×Item×Criteria Matrix
Information System of The Item 1
In Table 1, there is a data set with seven items i1 to i7 and six users Alice, Bob, Charlie, David, Yvonne and Zoe. In each cell, there are four ratings which indicate the four specific criteria. We may consider that each item is a movie and those four criteria are story, action, directory and visual.
In Table 2, there is an IS for the item i1. Since four users give ratings for the first item, there are four rows in its IS which are Alice, Bob, David and Zoe. The users who do not give any rating for particular item cannot be in the IS. In the columns, there are criteria, and in each cell, there is a rating value that the users give for the criterion of the specific item.
In this section, composing the discernibility matrix of the items from IS is explained. Let U be a non-empty finite set of objects called as the universe and R be an equivalence relation on U, then R ⊂ U×U, is an indiscernibility relation. The elements belonging to the same equivalence class are said to be indiscernible with one another [24]. Explanation of the discernibility relation is the opposite of indiscernibility relation; therefore, the elements belonging to the different equivalence class are analyzed in this system.
The system composes n×n discernibility matrices for all items by settling the users to the rows and columns. By starting from the first row to the last, each row in the IS is compared with one another, and the criteria that do not have the same value are written to the cells. The user compared with herself remains empty in the matrix. For example, Table 3 shows discernibility matrix of the item1. Since the item has ratings of four users over six (total number of users in the data matrix), a 4×4 matrix is composed for this item. Note that dimension varies from item to item since different users give ratings in each item. The discernibility matrix of the item1 is constructed in the following way. The set of criteria which discerns the users Alice and Bob contains criteria c1, c2, c3 and c4. That means dAlice,Bob = dBob,Alice = c1, c2, c3, c4. The element dBob,David = dDavid,Bob = c3, c4. The system only considers the matrix’s lower diagonal part because it is a symmetrical matrix (d ij = d ji ) [4]. All cells are filled by this way to complete the discernibility matrix of the item1. Once the matrix is filled, it can be used to calculate the relation function using Boolean function which is explained in the next section.
Discernibility Matrix For The Item 1
Discernibility Matrix For The Item 1
Using the discernibility matrix, the reducts and cores which lead to reveal the weights is computed. For each row, the data located in the cells are linked by logical operators disjunction (∨) and conjunction (∧) [4]. We represent the values in the discernibility matrix in conjunctive normal form. For example, the relation function for item1 is constructed in the following way: each criterion in the set of criteria is linked with disjunction, and each set of criteria is linked with conjunction with each other. For example, attribute sets dDavid,Alice and dDavid,Bob are presented as (c1 ∨ c2 ∨ c3 ∨ c4) and (c3 ∨ c4) respectively. These attribute sets are linked with conjunction operator as: (c1 ∨ c2 ∨ c3 ∨ c4) (∧ (c3 ∨ c4). The system combines all set of attributes using those logical operators and gets the relation functions. For the discernibility matrix presented in Table 3, the relation function is composed as follows:
From the resulting relation function, it can be understood that criteria 1 and 2 have no importance, but criteria 3 and 4 have equal importance on particular item since only one reduct of the considered set of attributes is found; however, generally the relation function has more than one reduct which allows us to analyze the IS in alternative ways. After finding reducts for each item, the system forms the weight matrices once for all.
Weight matrix calculation
In this section, weighting process for scoring the criteria for each item is explained. The results from the core and reducts of the attribute values inferred from discernibility matrix are collected in a matrix called weight matrix. Once the system finds the weights of criteria of each item, it can be used for making prediction of overall criterion.
Firstly, the system needs to reveal the frequencies of each criterion in discernibility functions. Let f
i
be the discernibility function of item i, Count (f
i
, c
j
) is the frequency of the criterion c
j
in f
i
. In order to find the density of each criterion over each object, the formula proposed by Cekik and Telceken [20] is used:
The total amount of criteria for each item in resulting matrix is proportioned to 1 to get the fraction as 100 percent. Relation function of each item is used to calculate the weights in following way, and finally, weight matrix of the data set is composed. An example matrix can be seen in Table 4.
An Example Of Weight Matrix Calculated For The Data Set
The last step of the proposed method is combining the weights of each criterion with its prediction score calculated by the system as shown in Equation 1 to come to a conclusion for overall criterion as follows:
For example, let us assume that the example weight matrix in Table 4 above is composed after running the algorithm. The table can be expressed as: The data inside of the first row means that only criteria 3 and 4 have importance for the first item. Let us say that a person with the name “Daphne” gives ratings 5, 3, 4, 5 to the first item, respectively, and that our system applies traditional CF to those criteria and comes up with the result as 4.75, 3.92, 4.25, 4.12. The overall rating prediction of the first item for this person will be: p1,Daphne= (4.25×0.50) + (4.12×0.50) = 4.18. The data in the second row means that each criterion has the same importance for the second item. Let us assume that a person with the name “Robin” does not have any idea about that product yet. The system gives ratings to the four criteria as 3.25, 4.22, 2.25, 4.40. The overall rating prediction of the second item for this person will be: p1,Robin= (3.25×0.25) + (4.22×0.25) + (2.25× 0.25) + (4.40×0.25) = 3.53 For the last item, the weights of the criteria are 0.40, 0, 0.20 and 0.40, respectively. A person with the name “Tom” gives 4, 4, 5, 3 to the last item, respectively, and the system gives prediction to those ratings as 4.37, 3.85, 4.90, 3.80. The overall rating prediction of the last item for this person will be: p1,Tom= (4×0.40) + (5×0.20) + (3×0.40) = 3.80.
The system applies these five stages once for all users. Whenever a new user is added to the system or a user gives rating for a new item or changes an existing one, the system only updates the necessary parts at these stages.
Experiments
In this section, we report results from applying the RST into MCCF systems for generating predictions. A set of experiments were performed on a public benchmark data set Yahoo! Movies. The proposed method was compared with the state-of-the-art studies using the evaluation metrics and the outcomes were investigated.
A. Data sets
Yahoo! Movies data sets, public benchmark data sets for the movie domain, were used in the experiments. The main characteristics of the data sets can be expressed as follows: The data set has three different variations as YM5-5, YM10-10 and YM20-20. In YM5-5 data set, each item was rated by at least five users and each user rated at least five items, while this number is 10 in YM10-10 and 20 in YM20-20. There are two types of rating scale in the data set as a standart grading scale from 1(F) to 13(A+) and its converted ratings from 1 to 5: A-, A, A + is converted to 5, B-, B, B + is converted to 4 and so on until F is converted to 1. Both rating scales were conducted in the experiments because they were both used in other studies. YM5-5 data set includes 5,978 users and 3,079 items. There are 82,599 user ratings per each criterion in the data set. YM10-10 data set includes 1,827 users and 1,471 items. There are 48,026 user ratings per each criterion in the data set. Finally, YM20-20 data set includes 429 users and 491 items. There are 18,504 user ratings per each criterion in the data set.
B. Evaluation metrics
As statistical accuracy metrics, we used mean absolute error (MAE), root mean squared error (RMSE) and Precision@k, which had shown that our system was successful and comparable with the other studies. MAE and RMSE are calculated as follows:
Another evaluation metric used in the experiments is Precision@k. Precision@k is the proportion of recommended items in the top-k set that are relevant. It represents the percentage of truly high ratings given by the user among those that the system predicted [8]. The higher Precision@k value means the more accurate results. It is mathematically defined as:
We performed a set of experiments to analyze the performance of the proposed method, compared its prediction accuracy with some methods proposed in the literature. The methods utilized in the experiments for comparison are given in Table 5.
Methods Utilized in the Experiments for Comparison
Methods Utilized in the Experiments for Comparison
The first experiment in this study is performed to examine the MAE and RMSE results of the proposed system over entire data set which can be seen in Table 6 below:
Mae and Rmse Results For Our Model On YM5-5, YM10-10 and YM20-20 Data Sets
This experiment was performed to see the general behavior of the proposed method over entire data set. Traditional CF is applied to four criteria –story, action, directory and visual –by using PCC as distance metric and k value was set as 14 in neighborhood selection. Choosing the best k value is another case to consider, so this value has been chosen as 14 in many parts of the experiments, which reasonably gives the best result for accuracy and performance issues. Eventually, RST is applied to each item to reveal the weights of criteria for overall ratings.
In second experiment, MAE and Precision@k accuracy metrics were used at original 1–13 scale for YM10-10 data set using five-fold cross-validation to compare the performance of the proposed method with the others in apples-to-apples comparison. Table 7 shows the MAE and Precision@k results of our method RoughMCCF in comparison with other methods doing the same data set division methodology and using the same accuracy metrics to be able to compare them in the same perspective. The bold numbers indicate the best results which show that our proposed algorithm performs the best when compared with other studies. Since some studies use random subsampling in the data set or the user / item choice in each study may differ, it is virtually impossible to tell which algorithm is the best in every case. Therefore, the system was executed for 100 times to truly represent the general behavior of the algorithm.
Mae and Precision@k Results Over YM10-10 Data Set at Original 1–13 Rating Scale
In third experiment, RMSE results of each data set was calculated with the coverage numbers. To get the RMSE results, the algorithm was executed by splitting the data into 95% train and 5% test data and using random subsamples for each time. Coverage values were found using two-tailed paired t-test.
Table 8 indicates the results of RMSE from our model RoughMCCF, in comparison with different studies. Bold numbers indicate the best results. These RMSE results also confirm that the proposed method provides better predictive accuracy than proposed single-rating or similarity-based approaches.
Rmse Comparison of Different Studies Over Overall Rating Prediction; Coverage Numbers Given in Parantheses
The results indicate that the MCCF system gains significant improvement when RST is involved in criteria weighting. The proposed system produces better results when compared with traditional similarity-based or aggregation-function based approaches.
In this study, we proposed an aggregation-function based multi-criteria collaborative filtering method to further improve the predictive accuracy. In order to find the user preferences for the components of an item, we employ Rough Sets Theory. Weight factors for each item is found with the help of RST and the weights are used to predict the overall assessment of an item. The performance of the proposed method is compared with some benchmark studies and the experimental results confirmed that proposed method helps to improve the accuracy. The proposed method produces single aggregation-function for each item so the weights are not user-specific. The quality of recommendations can be further improved when the weights of the item’s components are different for each user.
In our future work, we plan to evolve RST to be able to extract user-specific aggregation-functions and thus a system which can make more personalized predictions would be implemented. We also want to see how RST works to handle missing values in a multi-criteria rating environment.