
Abstract
With the large-scale construction of urban subways, the detection of tunnel cracks becomes particularly important. Due to the complexity of the tunnel environment, it is difficult for traditional tunnel crack detection algorithms to detect and segment such cracks quickly and accurately. The article presents an optimal adaptive selection model (RetinaNet-AOS) based on deep learning RetinaNet for semantic segmentation on tunnel crack images quickly and accurately. The algorithm uses the ROI merge mask to obtain a minimum detection area of the crack in the field of view. A scorer is designed to measure the effect of ROI region segmentation to achieve optimal results, and further optimized with a multi-dimensional classifier. The algorithm is compared with the standard detection based on RetinaNet algorithm with an optimal adaptive selection based on RetinaNet algorithm for different crack types. The results show that our crack detection algorithm not only addresses interference due to mash cracks, slender cracks, and water stains but also the false detection rate decreases from 25.5–35.5% to about 3.6%. Meanwhile, the experimental results focus on the execution time to be calculated on the algorithm, FCN, PSPNet, UNet. The algorithm gives better performance in terms of time complexity.
Introduction
With the rapid development of the urban subway in China, more than 30 cities’ urban subway has come into service in recent years. However, the surface and internal structure of a subway tunnel may be damaged due to aging, thermal expansion, human-caused damages, terrain changes, etc., leading to the appearance of cracks.
Cracks are an early sign of tunnel defects. They reduce rigidity and bearing capacity of the lining structure, and more seriously, may expand into a crack channel and cause corrosion of the steel rails. By further reducing the durability of the lining structure, cracks can become a vicious cycle and affect normal operations, and threaten the safety of the tunnel. At present, defects on the tunnel lining rely mainly on human inspection, which is subjective and inefficient with a high probability of missing. Besides, because of poor lighting conditions in the tunnel, it is difficult for the inspectors to see cracks from a distance. Thus, automatic crack detection and classification methods are urgent to solve the problem.
The methods of crack detection can be divided into traditional detection methods based on features and new detection methods based on deep learning. Traditional feature-based detection methods include mainly threshold-based detection methods [1–3], Gabor filter methods [4, 5], edge detection methods [6–8], and seed-based area growth methods [5, 9] and their improvement methods.
Akagic et al. [1] proposed a crack detection method based on gray histogram and OTSU [10]. This method divided first image into four independent sub-images of equal size. Then, according to the ratio of Otsu’s threshold to the maximum histogram value of each sub-image, a crack search was performed. Finally, stitched all the sub-images. Medina et al. [4] proposed an improved method based on Gabor filter, which could detect cracks in any direction. Liu et al. [8] combined Canny algorithm and Rosin algorithm, used the local structure information of the pixel itself and its neighborhood to establish a two-dimensional histogram of the image.
Wang et al. [6] proposed an asphalt pavement crack detection algorithm based on multi-scale ridges. According to the multi-scale characteristics of ridge edges, a multi-scale Gaussian filter was used to detect the multi-scale ridge edges, and the detection results of each scale were fused at the pixel level. Then, combined with the crack length, width, direction, continuity, linearity and other characteristics to remove pseudo cracks. Zhou et al. [11] proposed an extended and optimized seed-based crack detection method, which included two main steps. The first step was to preprocess the road image. the method marked the lane line as a non-crack area and corrected the uneven background of the image. In the second step, the crack seeds were selected through grid cells, and then connected by constructing a minimum spanning tree. In addition, according to the path length, delete unnecessary small targets, such as the smallest branch and noise. Generally, the main advantage of traditional feature-based methods is that they do not need to label and train, so they are easy to implement, but the biggest disadvantage of this method is that most features are manually created on some given data set. Generally speaking, they cannot consider all the changes of the image in real life. When the external environment changes, uneven light and noise interference, the performance of crack detection will be affected.
Compared with the traditional crack detection algorithms, deep learning approaches are introduced into crack detection algorithms, and many studies have achieved good results [12]. These methods show a strong ability to learn automatically features without using manual features, and have achieved excellent performance in image classification [13, 14], object detection [15], and semantic segmentation [12, 16]. In general, crack detection methods based on deep learning can be divided into object-based detection, area-based and pixel-based methods.
Object detection is an important task in computer vision. Its main task is to find all objects of interest in the image and determine their positions. A typical example of these methods is DDLNet [17] proposed by Li et al. However, object detection technology uses rectangular frames to locate objects, and the distribution and shape of cracks are irregular. Therefore, only considering the object detection method to detect cracks, the recognition accuracy is limited.
Image classification, distinguish different types of images based on semantic information. The area-based method selects a small area of the image each time to determine whether there is a crack in the selected area. The use of image classification technology to classify each small part of a specific image, combined with the sliding window technology to form the detection of the entire image, can achieve better results. Cha et al. [18] proposed a CNN and applied it to 40,000 regions with a resolution of 256*256 pixels. The algorithm detected cracks by classifying each area separately, and scanned the image using different window sliding strategies to complete the detection of the entire image, which could find effectively cracks in the image. Gopalakrishnan et al. [19] used a trained deep CNN model and applied transfer learning to crack images. Their algorithm can identify whether the images have cracks. Dorafshan et al. [20] cut the 2592*4608 resolution image, and then used the DCNN algorithm to segment and classify each sub-image block in turn, and then further used the edge detection algorithm to detect the crack area of the crack sub-image. The algorithm can detect most crack areas, but the edge detection algorithm proposed in the article has higher requirements for image imaging quality. When the background of the detected image has a lot of noise and insufficient illumination, the algorithm is poor and cannot adapt to environmental changes autonomously, which limits the application scope of the algorithm. At the same time, due to the algorithm’s high dependence on high-resolution images, the processing time is too long to meet the real-time requirements of tunnel detection. Hoang et al. [21] compared the CNN model with the metaheuristic optimized edge detection algorithm. The results show that the performance of CNN is significantly better than edge detectors, but this method is difficult to provide pixel-level concrete crack detection. This is an unavoidable defect of this method, because the accuracy of detection depends on the degree of area division. To achieve higher accuracy, it is necessary to divide the area more accurately. However, if the area is more accurately divided, the information may not be sufficient to determine whether a crack exists, and the classification error will increase, thereby reducing the accuracy of detection.
Since the area-based method can only provide the existence and rough shape of the crack according to the size of the area, it cannot give the exact shape and location of the crack. To solve this problem, the pixel-level detection of crack images is required. Ni et al. [22] developed a method involving two deep neural networks. The first neural network was called GoogLeNet, which was a feature extractor. Then, a bilinear deconvolution layer was used for pixel-level crack detection. Huang et al. [12], Yang et al. [23] used a fully convolutional neural network (FCN) semantic segmentation algorithm to process the tunnel image to achieve pixel-level detection. Through the encoder and decoder, ensuring that the output size was the same as the input. Therefore, the prediction was included in the output probability map. However, for objects with small scales such as cracks, relative to objects with unbalanced background categories, the above method may not consider low-level and high-level feature fusion, and it is easy to lose some local information, so that the segmentation results in the edge is not enough fine, the image is too blurry or smooth. Therefore, it is impossible to segment completely the details of the target image. At the same time, compared with the rectangular frame marked by the sample of the object detection algorithm, the shape of the crack is complicated and the labeling cost is relatively high. On the other hand, the cracks in the tunnel are more serious diseases, which need to be discovered and processed in the early stage. Compared with the traditional method, the segmentation of the elongated crack image is the weakness of the deep convolutional neural network [24].
Besides computer vision applications, laser point cloud information [25] and infrared information [26] are also used to detect cracks. Unlike computer vision, the effects of uneven illumination may be ignored in crack detection. However, the amount of data processing is large and the computation cost is quite high. Thus, it is not considered in this paper.
Because of the current research status, the existing traditional detection algorithms often do not consider the interference of environmental changes. Some algorithms focus mainly on the detection research when the crack area occupies the main body of the image. In the real scene of the tunnel, the frequency of crack diseases is very high, but the crack diseases only occupy a small part of the whole image, and the existing algorithms are based on the whole image processing, which is prone to misdetection and inefficiency. The use of deep learning alone to detect tunnel cracks cannot get rid of the constraints of small crack size, slender and narrow features on detection. Therefore, this paper combines deep learning object detection with an adaptive segmentation algorithm. In this way, on the one hand, it can reduce the cost of manual labeling of samples, on the other hand, it can improve the universality of the algorithm in the complex environment of the tunnel, and extract accurately the crack area.
Specifically, the algorithm proposed uses the following steps: Combine detection with an efficient deep learning network, and extract quickly the high-level semantic information to identify the type of defect in the current image. Obtain defect location information and narrow the range of defect detection. Filter background noise from the source and reduce computation redundancy. These can provide a good basis for different types of defect-specific treatment strategies. Further reduce the ROI detection area by the adaptive border ROI. Merge ROI of the bounding box after the object detection. A mask is used to reduce the amount of data processing and remove data redundancy. At the same time, interference sources are isolated. Use a proposed optimal adaptive selection algorithm to transform the tunnel crack detection into a discrete optimization problem. By searching for the optimal solution of the current state in the policy set, the adaptability of the tunnel detection algorithm in complicated environments is improved. Compare this method’s detection area with three commonly used detection methods: iterative method, OTSU method and watershed algorithm when exposed to six different interferences. Finally, calculate the false detection rate to assess its improvement. And the segmentation result can be used to provide information for the analysis of tunnel health by calculating the area, length, width and other information of the crack.
Research design
As shown in Fig. 1, the detection algorithm proposed in this paper can be divided into three parts: The tunnel video collected by the automatic inspection vehicle is captured according to the position of the tube to obtain the original tunnel image. Further, reduce the ROI detection area by the Adaptive Border ROI. For the Bounding Box after the target is identified, the ROI is merged, and the mask is used to reduce the amount of data processing significantly, reduce data redundancy, and isolate the interference source to some extent. Convert the problem involving the segmentation process into a problem suitable for a discrete optimization problem. Its goal is mainly to enhance the generalization performance of the segmentation algorithm. Firstly, the ROI is divided according to the default solution. Then the scorer judges the result. If the result does not meet the default criteria, the optimal segmentation parameters are searched through the grid search in the strategy set. Finally, the optimal segmentation effect under current conditions is obtained.

Detection network.
As shown in Fig. 2, the shield tunnel inspection system consists of Laser sensor, Gyro cloud platform, HD motion camera, Crawler chassis, Obstacle avoidance module, RFID landmark, Magnetic track navigation, and so on.
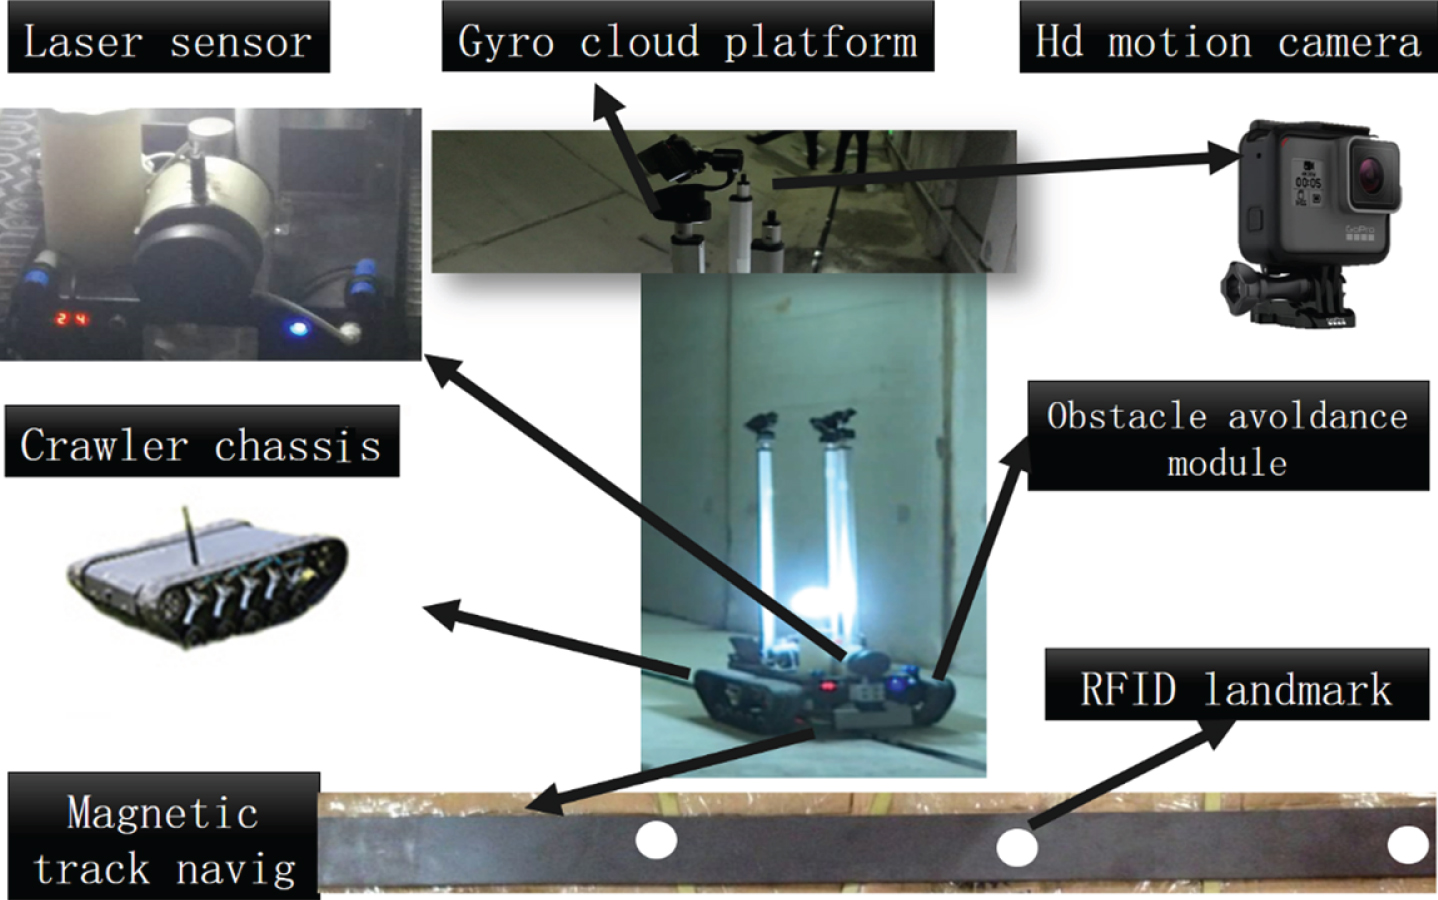
The shield tunnel inspection system.
Three high-definition motion cameras capture the tunnel video. The camera’s optical image stabilization technology and the Gyro cloud platform can reduce the image jitter caused by way of the inspection vehicle body. A high-power light source is placed at the bottom of the inspection vehicle, and the purity of the captured image is ensured by supplementing the illumination in the tunnel where the light is insufficient. However, due to the limited number and actual working conditions, the captured video images inevitably have shadows and dim corners. The laser distance sensor is used to measure the distance between the surface and the camera, which provides the basis for calculating the actual physical parameters (area, length, width) of the crack defect.
After collecting the surrounding images on the way of the tunnel, firstly, the inspection vehicle performs frame rate extraction according to the length of the field of view, then an algorithm performs distortion correction and noise reduction on the image. There are a lot of useless details in the collected high-resolution images. To reduce the subsequent workload, those images are compressed. Finally, the processed images are input into the detection algorithm.
For the acquired tunnel image, firstly, we need to obtain the crack type and location. In this paper, Keras is used to construct the RetinaNet [27] network structure suitable for crack defect object detection. As shown in Fig. 3, the RetinaNet network is a sigle network consisting of a backbone network and two sub-networks with specific tasks. The backbone network is responsible for calculating the convolutional features of the entire image. The first subnet performs image classification tasks on the output of the backbone network, and the second subnet is responsible for the convolution boundary regression. RetinaNet solves the problem of category imbalance by changing the cross-entropy error of the original training regression task to FL (Focal Loss) so that the object detection accuracy and speed reach an appropriate balance.

Crack detection.
In YOLOv3 [28], according to the author’s analysis results, the RetinaNet algorithm performs best in terms of detection accuracy relative to Faster RCNN, YOLO, SSD, and DSSD in the AP (Average-Precision). Compared to the Faster RCNN algorithm, the AP of the RetinaNet algorithm is 4.2 higher.
In model training, we ensure the effectiveness of training through the following methods: Compress the crack picture into a low bit to solve the memory overflow and training problems caused by the frame rate image being too large; Using image augmentation methods to generate more samples, increase over-exposure, occlusion, camera shake, and even blur, distortion situation recognition rate, improve the probability of defect recognition; Mark the samples after the data is expanded and make non-defect area markers for the repaired area; Create a deep learning object detection data set: generate a vector of the upper left and lower right coordinates of the defect image, create an XML file, and mark the names of different crack types.
A deep learning model obtained through 50,000 iterations using 2000 crack data samples was used to detect the image and predict the crack type and coordinate position.
The types of cracks are generally divided into horizontal, vertical, oblique, and complex, the crack characteristics in different directions are consistent, and the complex cracks are different from the unidirectional cracks. Therefore, in this paper, we divide the types of crack into two kinds, one-way crack, and complex crack.
The Bounding Box predicted by crack detection is combined with the classification information. In an image, the RetinaNet network tends to predict multiple Bounding Boxes. However, if we process directly these Bounding Boxes, it will increase the data processing capacity of the segmentation network and the computational burden. If we input the whole picture directly into the segmentation network, not only the computation amount will be increased, but also the interference sources (such as shadow, spider web, pipeline) will directly participate in the operation. So the segmentation algorithm is insufficient to identify these Bounding Boxes. These Bounding Boxes will reduce the accuracy of the algorithm.
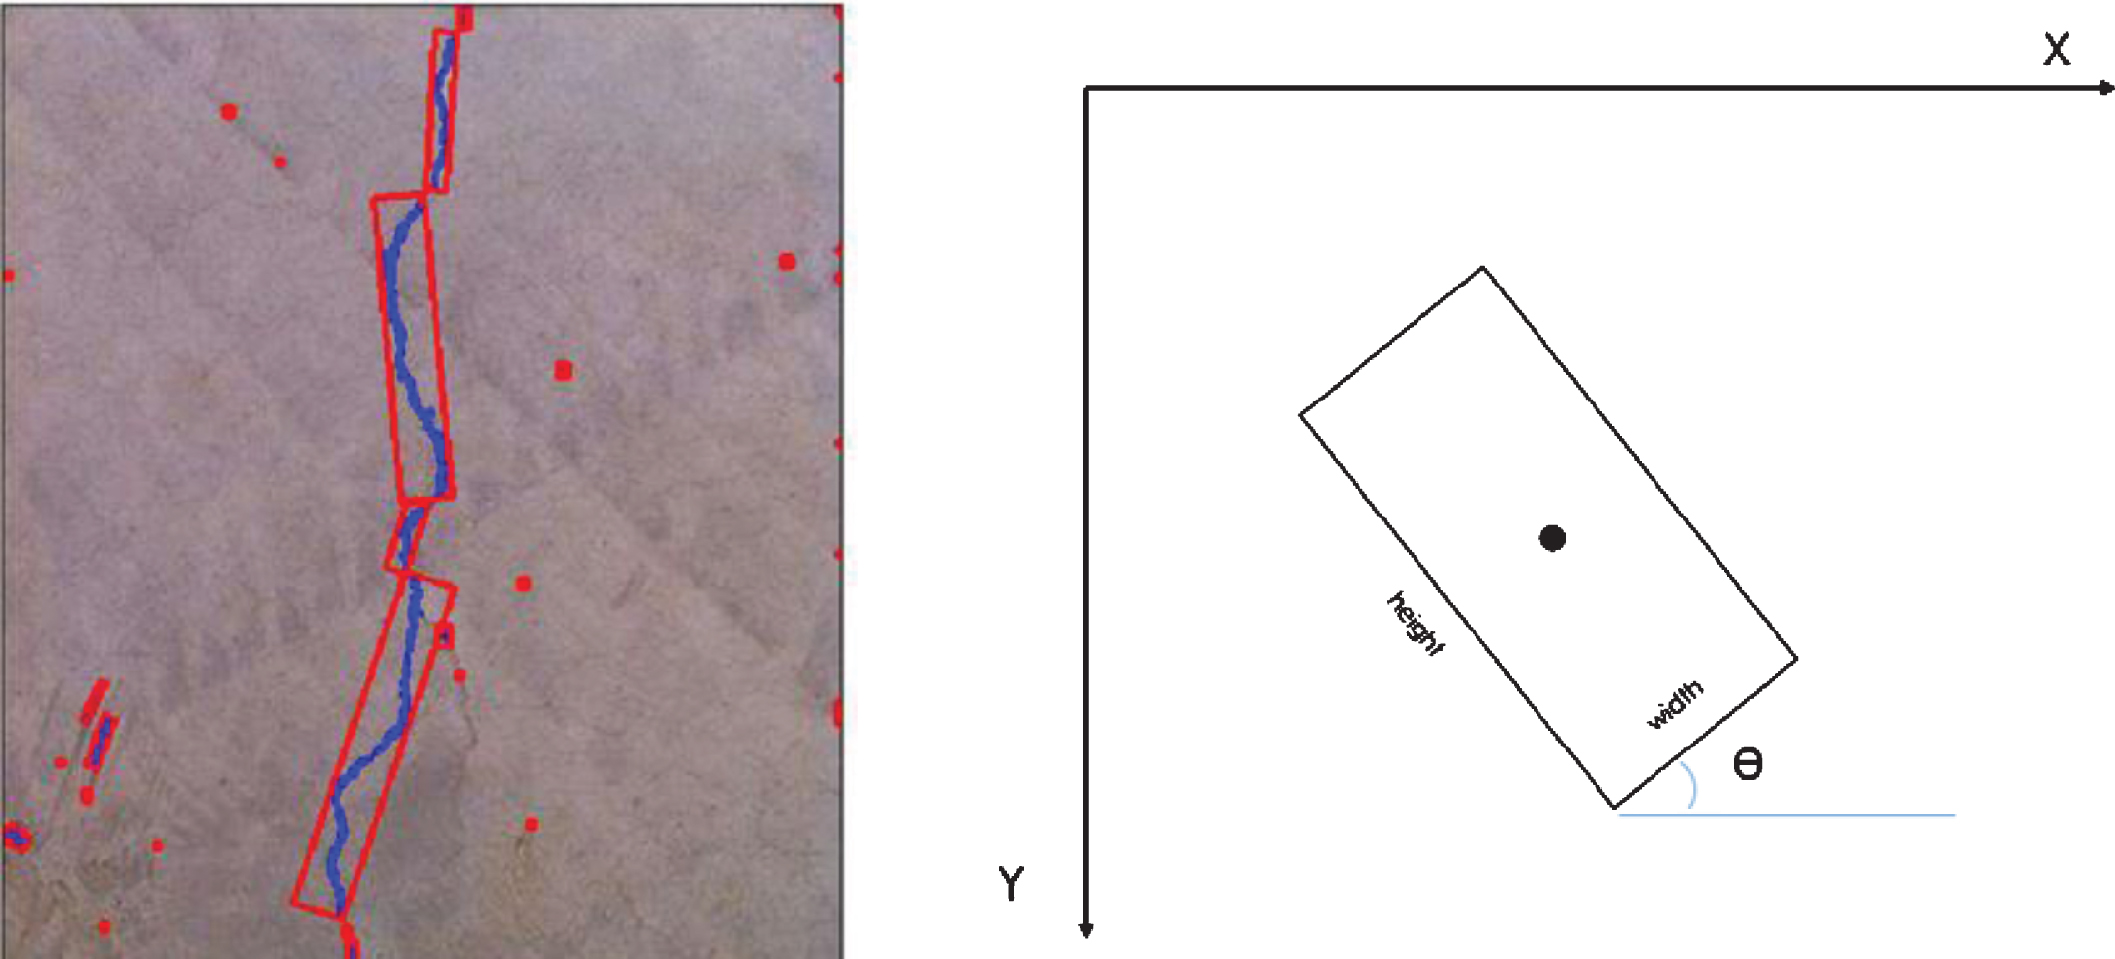
In this regard, we sort the coordinate points of the Bounding Box, as shown in Fig. 4. We get the coordinates of the upper left and the lower right poles in the Bounding Box group, extract the maximum region merging P determined by these two poles. According to Equations (1)–(4), we mask the region merging P, isolate the interference from the non-crack region R1, retain the crack region R0, and obtain the region merging R.

ROI merge.
Traditional crack segmentation detection methods use mostly preset fixed parameters to process images. These methods have better detection effects under certain conditions, but the effects tend to deteriorate when the environment changes or other interference occurs.
Complex lighting conditions, various interferences such as pipelines, steel frames, stones, spider webs, leaking water accompanying cracks, and other factors cause the detection environment to be wrong. The traditional segmentation detection method cannot effectively detect the cracks. Therefore, an optimal adaptive selection algorithm is proposed, as shown in Fig. 5. Firstly, according to the crack type detected by deep learning, a segmentation detection method is selected to complete a round of rapid processing of the crack, and then the processing result is sent to the scorer for scoring. The subsequent processing flow is selected according to the score. If the score reaches the expected standard, the detection result is directly output, and else, the optimal parameter is searched in the grid to obtain the optimal detection effect under the current condition.

Detection network.
The fast segmentation detection method includes the following processes, shown in Fig. 6:

Fast detection.
Image filtering processing. The tunnel lining surface is affected by the concrete material, environment, etc., resulting in a large amount of noise in the captured image. These noise interferences bring many difficulties to the detection of cracks. The primary interference of crack detection comes from the influence of the noise of the pit and other points on the lining surface. Direct detection of the original image can extract cracks, but at the same time, a large amount of noise is detected, and some noise will cause excessive branches in the crack shape near the crack, especially the noisy image, which makes it difficult to extract the crack. After filtering the image to remove noise, the detection effect is better. Convert RGB images to grayscale images. The R, G, and B color components of the image are mapped to the diagonals of the R, G, and B cubes respectively, and the pixel gray values are calculated as Equation (5):
Lighting balance. Since the tunnel is dark, in order to collect a clear image, it is necessary to add a light source, which brings uneven illumination. This phenomenon affects the threshold and parameter selection during image threshold segmentation. Especially for overexposed images, cracks with small contrasts are submerged and difficult to segment and extract. In order to solve the problem of uneven illumination, the morphological bottom cap transformation is used to process, that is, the result of the closed operation is obtained by subtracting the original image. As shown in Fig. 7, the crack area is highlighted after lighting balance. Image threshold segmentation. The total pixel of the image f (x, y) is N = ∑
i
N
i
, The probability of each gray level appearing is

Lighting balance.
The average gray levels of the two regions are u0 and u1. The average gray level of the whole image is u. Calculate the variance between the variance regions between classes. The formula is given by Equation (7):
The maximum variance of the divided two regions is determined to be the best separation state for the two regions. Eliminate isolated points or isolated blocks. In the image acquisition process, due to factors such as fouling, external light, concrete surface defects, and background correction algorithms, there may be isolated points or isolated block noise on the segmented image. In order to identify the crack information, these isolated points or isolated blocks must be eliminated, which can be eliminated by using the morphological region opening operation. The formula is given by Equation (8):
Where ⊖ is erosion and ⊕ is dilation. Edge detection. The edge detection method is used to obtain the crack region.
As shown in Fig. 8, In the pre-process scheme, different algorithm combinations and parameter selection have a significant impact on the final detection effect. Due to the interference of complex factors such as illumination, occlusion, and water leakage, the effect of cracking images at different locations using the same processing scheme is unstable in the same tunnel. The general detection algorithm is poorly universal. Based on using adaptive optimization selection on filtering algorithm, illumination balance method, segmentation method under the current conditions, we can improve the universality of the algorithm and solve the drawbacks of the traditional algorithm. Therefore, we can transform the segmentation process into a discrete optimization problem (a kind of Binary Linear Programming Problem [29]), and its goal is mainly to enhance the generalization performance of the segmentation algorithm.
Comparison of different methods.
We set the pre-process scheme to an unordered collection of K sub-policies. In the initial processing, the default strategy is firstly used on the current image, and then the calculating results are scored by a scorer. When the score meets the preset criteria, it is determined that it meets the calculation requirements, and the processing result is directly output, which reduces subsequent processing steps and reduces the amount of calculation. Grid searches optimization strategy in a sub-policy set when processing scores do not meet expectations. The parameters of filtering method, illumination balance, threshold segmentation, and noise elimination are adjusted to apply to the current image, and the feature parameters are extracted and sorted by a scorer in turn, and the scheme with the highest score in the scoring result is set as the segmentation scheme.
1. The YCbCr color space is widely used in digital video images. The Y component stores luminance information, and Cb, Cr stores color information of the image. Where Cb is the difference between blue and reference values, and Cr is the difference between red and reference values. The conversion relationship between the YCbCr color system and the RGB color system is as Equations (9), (10) and (11):
In the YCbCr color space, the effects of cracks and background are obvious. Extract the Y component information of the crack region.
Within the statistical distribution of YCbCr color space in the crack region of the existing data set, the color distribution Cb, Cr is scattered due to the shadow, while the Y value distribution of the crack tends to be concentrated. Based on this, we extract the color space distribution parameters of the segmented crack region: Firstly, calculate the geometric moment of the connected domain and obtain the centroid of the connected domain:
Determine whether the centroid is in the connected domain, and if so, extract the connected domain centroid Y value Y(x0,y0), otherwise extract the Y value of the midpoint of the connected domain and the f = y0 line intersection. Positive correlation processing is performed on the areas falling within the statistical subset of the crack color space, and vice versa. Calculate the proportion of the positive correlation crack region and obtain the color space correlation coefficient δ.
Where C is the crack sample color space. Subsequently, calculate the color space distribution coefficient S of the positive correlation crack region:
2. The number of crack closure areas of the image intercepted by deep learning is within a range. When the pre-process effect is weak, more noise signals are generated, or the cracks cannot be correctly identified so that the number of detected closed regions is much smaller than the standard value. The number of crack closure areas after statistical detection can provide a basis for the design of the scorer.
Since the position of the inspection vehicle from the wall is between 1 m and 3 m, the resolution of the collected image is fixed at 2592*4608. According to the inspection experience, the crack must be distributed within a specific range. In the segmentation experiments on existing data sets, we calculate the relative area R of the image crack in the area A of the crack area and the number i of the crack area, where A is the area of the crack area extracted by the front-end depth learning network:
The number of closed regions after statistical crack region segmentation is concentrated in the range of 84–800, which is taken as a stable correlation parameter for the number of crack closure areas, we can calculate whether the relative area falls within the range of stable correlation parameters. If R falls within the range, take
The scoring value is calculated according to Equation (17):
The color parameter characteristics, distribution characteristics, and closed-area parameter characteristics of the crack after pre-process are extracted, and the scorer scored the pre-process effect. When the score meets the preset criteria, it is determined that it meets the calculation requirements, and the processing result is directly output. It can reduce subsequent processing steps and the amount of calculation. When the image resolution is 2592*4608, the average processing time of each image is 10–30 ms, which can achieve the purpose of rapid processing. When the processing score is not in accordance with the expectation, the optimal parameters are searched in the present scheme, the filtering method, the illumination equalization, the threshold segmentation, and the noise elimination parameter are adjusted, then using the scorer to score each treatment effect. We set the highest score in the scoring result as the segmentation scheme.
Classifier
After the opening operation in the preprocessing, most of the misidentifications will be deleted, but some larger non-cracks still exist. When the threshold is large enough, these partial regions can be removed, but a too large threshold will remove the discontinuous part of the crack, thereby reducing the detection accuracy, and extracting its features can be used for crack division. In this paper, we use the features of perimeter-area ratio, relative size, and aspect ratio, select these multi-dimensional features for classification, and divide the closed area of the image into two types: cracks and non-cracks, and remove the rest of the non-cracked area to obtain a more accurate crack image.
(1) Perimeter-Area Rate Law
For a flat rule graphic or a smooth surrounding line, the perimeter and area have the following relationship:
Where A is the area of the planar area and P is the length of the boundary, ratio:
It is only related to the shape of the graphic, regardless of the size of the graphic. That is, for a family of similar graphs, α is a constant.
The results of today’s research have shown that the cracks of objects (ceramics, rocks, pavements, concrete, etc.) are fractal structures with good self-similarity and satisfy the fractal law. By analyzing the fractal law of the area-perimeter relationship of the concrete crack image, the crack area-perimeter feature can be used to screen the crack more effectively.
(2) Relative size
For the processed crack closed region, the relative size of the closed region is obtained by calculating the ratio of the number of pixels in the region to the image size. The number of pixels of a noise object is always smaller than the number of pixels of the crack. The statistical results of 200 objects show that the 30 objects with the largest number of pixels are cracks. Considering the effects of image cropping, scaling, etc., the relative size is chosen as the feature.
Where Σa is the number of pixels in the closed area, w is the image width, and h is the image height.
(3) Aspect ratio
It can be seen from Fig. 9 that the crack has a slender and continuous feature, and the aspect ratio of the crack closed region is obtained by the smallest circumscribed rectangle of the crack. A portion of the noise can be filtered out by screening the areas that conform to the elongated features.
Crack shape.
In practical applications, there are many limitations to the design of the classifier. Time cost and classification effect should be taken into account. The above features of the extracted crack sample are input into the One-Class SVM [30, 31], training a one-class classifier to detect the abnormal closed region and remove the crack point.
Judging criteria
(1) The standard defect false detection rate refers to the ratio of the number of pixels detected incorrectly to the total number of pixels in the image. The calculation formula is Equation (21):
Where: P i is the false detection rate of algorithm i, N i is the number of pixels in which the algorithm i is wrongly detected, and N total is the total number of pixels in the image.
For each type of crack, TP (True Positive) denotes the number of positive samples correctly classified, FP (False Positive) denotes the number of negative samples wrongly labeled as positive samples, FN (False Negative) denotes the number of positive samples wrongly labeled as negative samples, and R (Recall), P (Precision), F1 (F1-score), Accuracy and Mean Intersection over Union (MIoU) are calculated according to Equations (22) ∼ (26).
(2) Average Precision (AP) represents the area between the curve and the coordinate axis. Mean AP (mAP) represents the average value of three kinds of AP. In this paper, AP and mAP are used as evaluating indicator of model performance.
In practical engineering applications, since Shanghai Urban Operation Company’s current products for crack detection are still traditional methods, the method proposed in this paper is compared with traditional methods. The corresponding experiments are carried out under the computer configurations of Ubuntu 16.04, CUDA 8.0, cuDNN7.1, NVIDIA GTX1060 6 G, Intel i7-7700HQ, and 16 G memory systems.
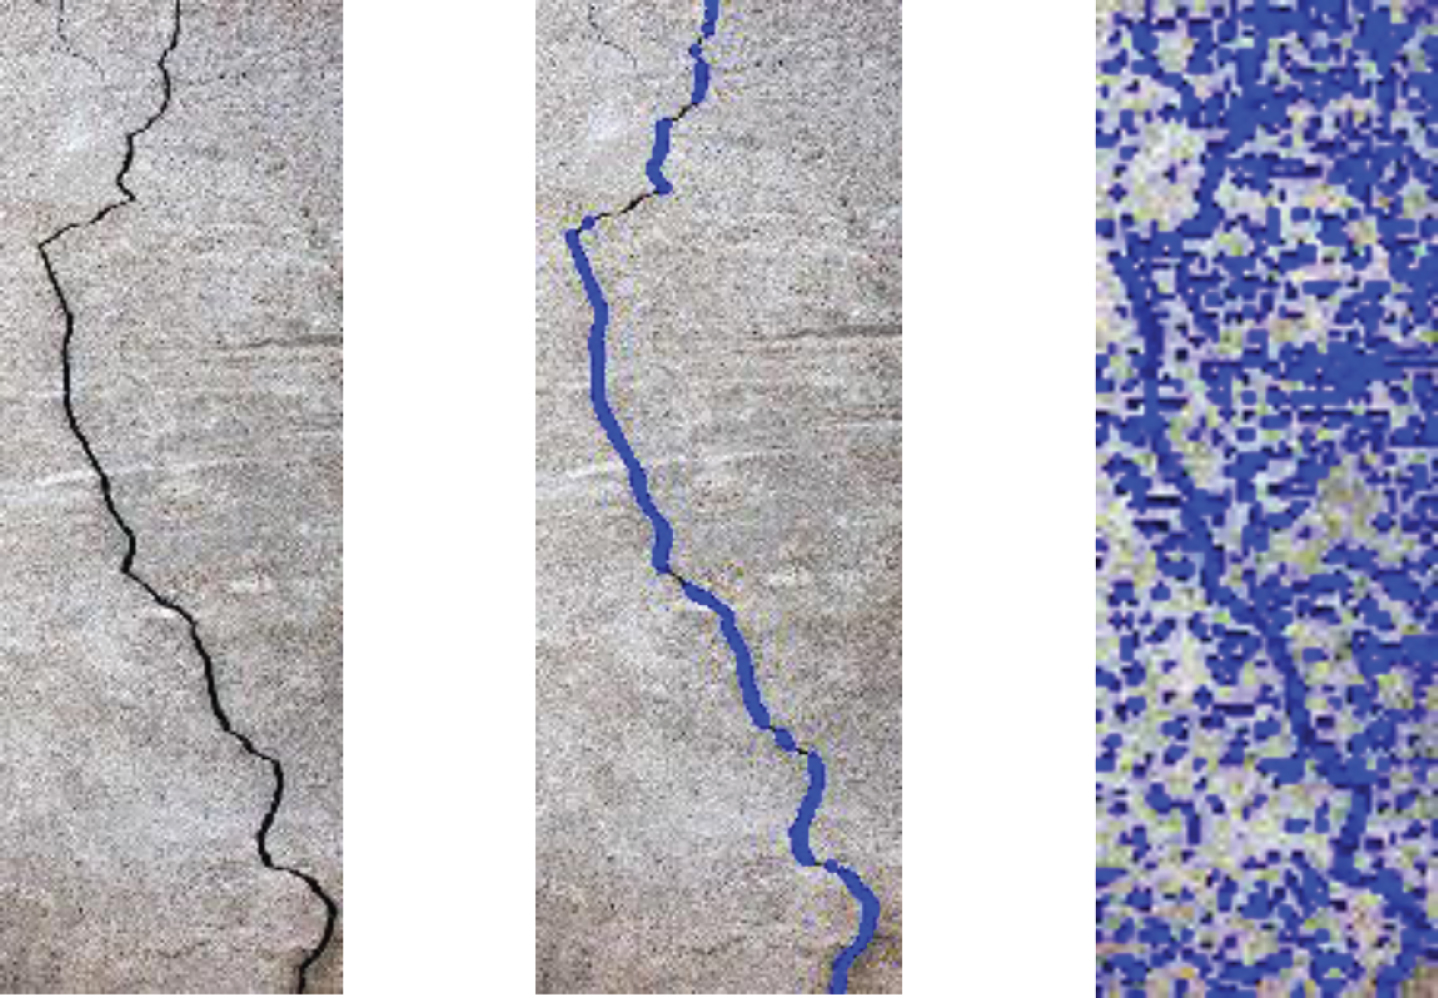
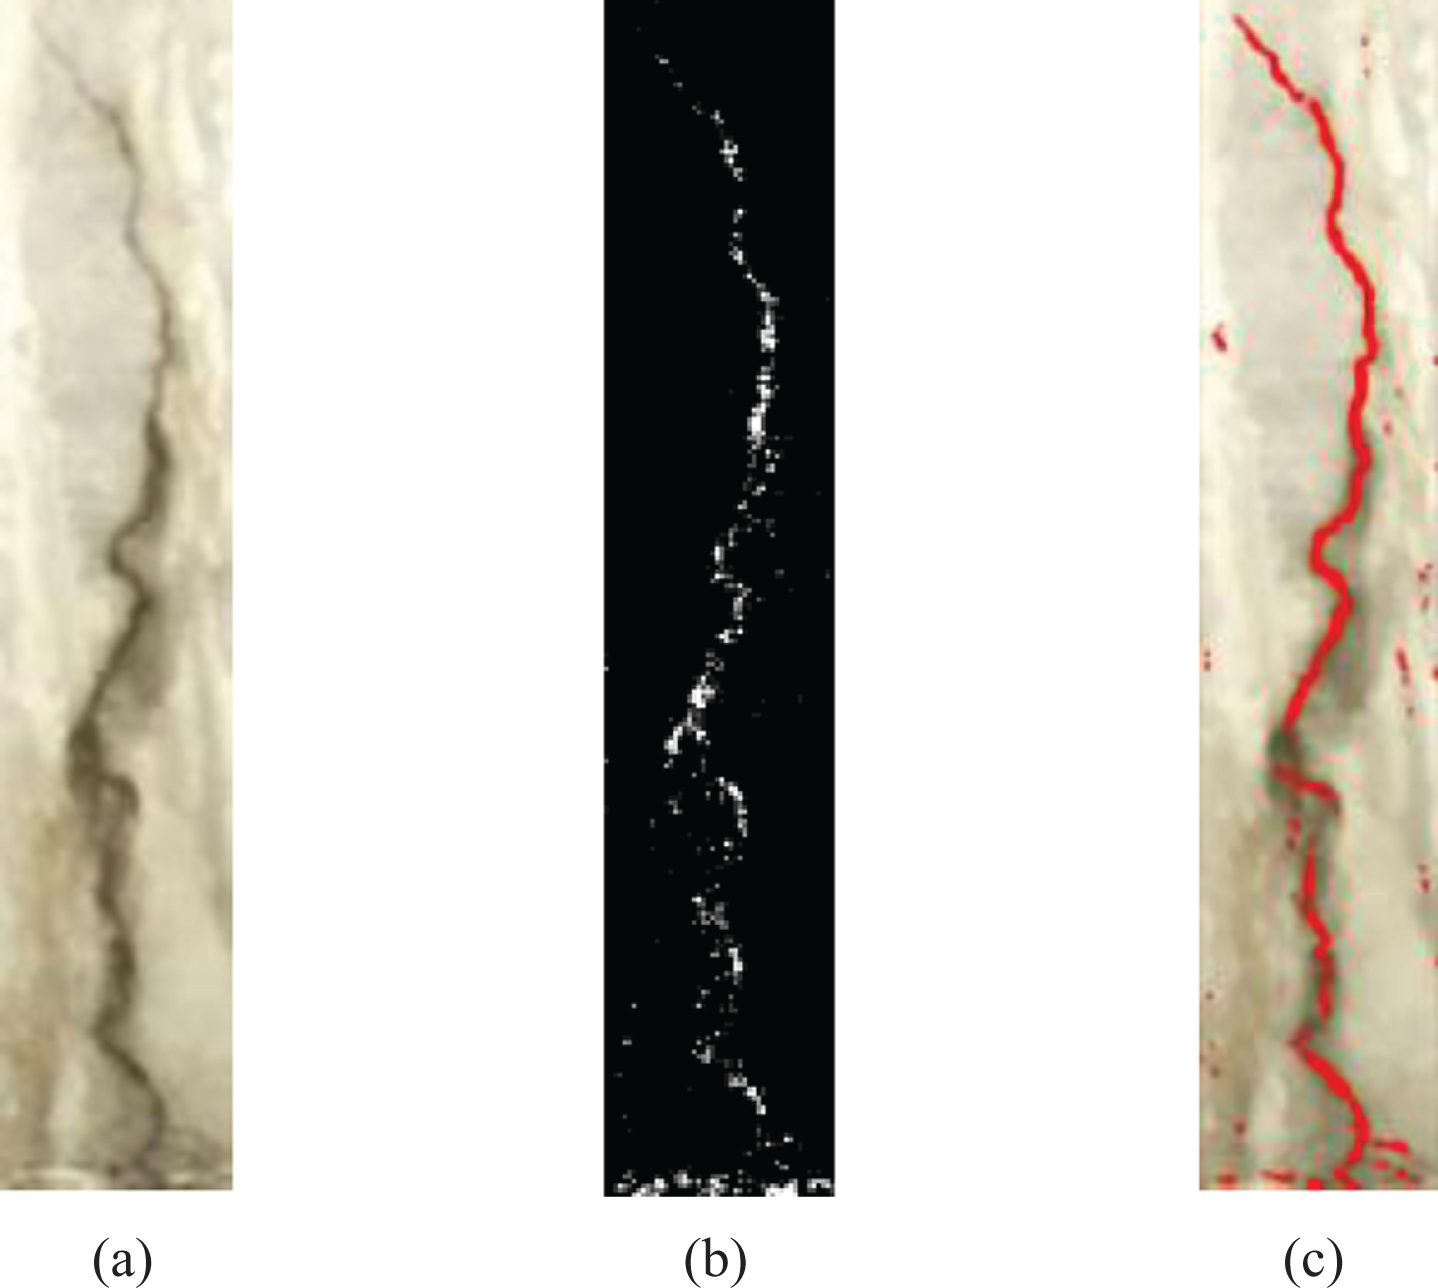
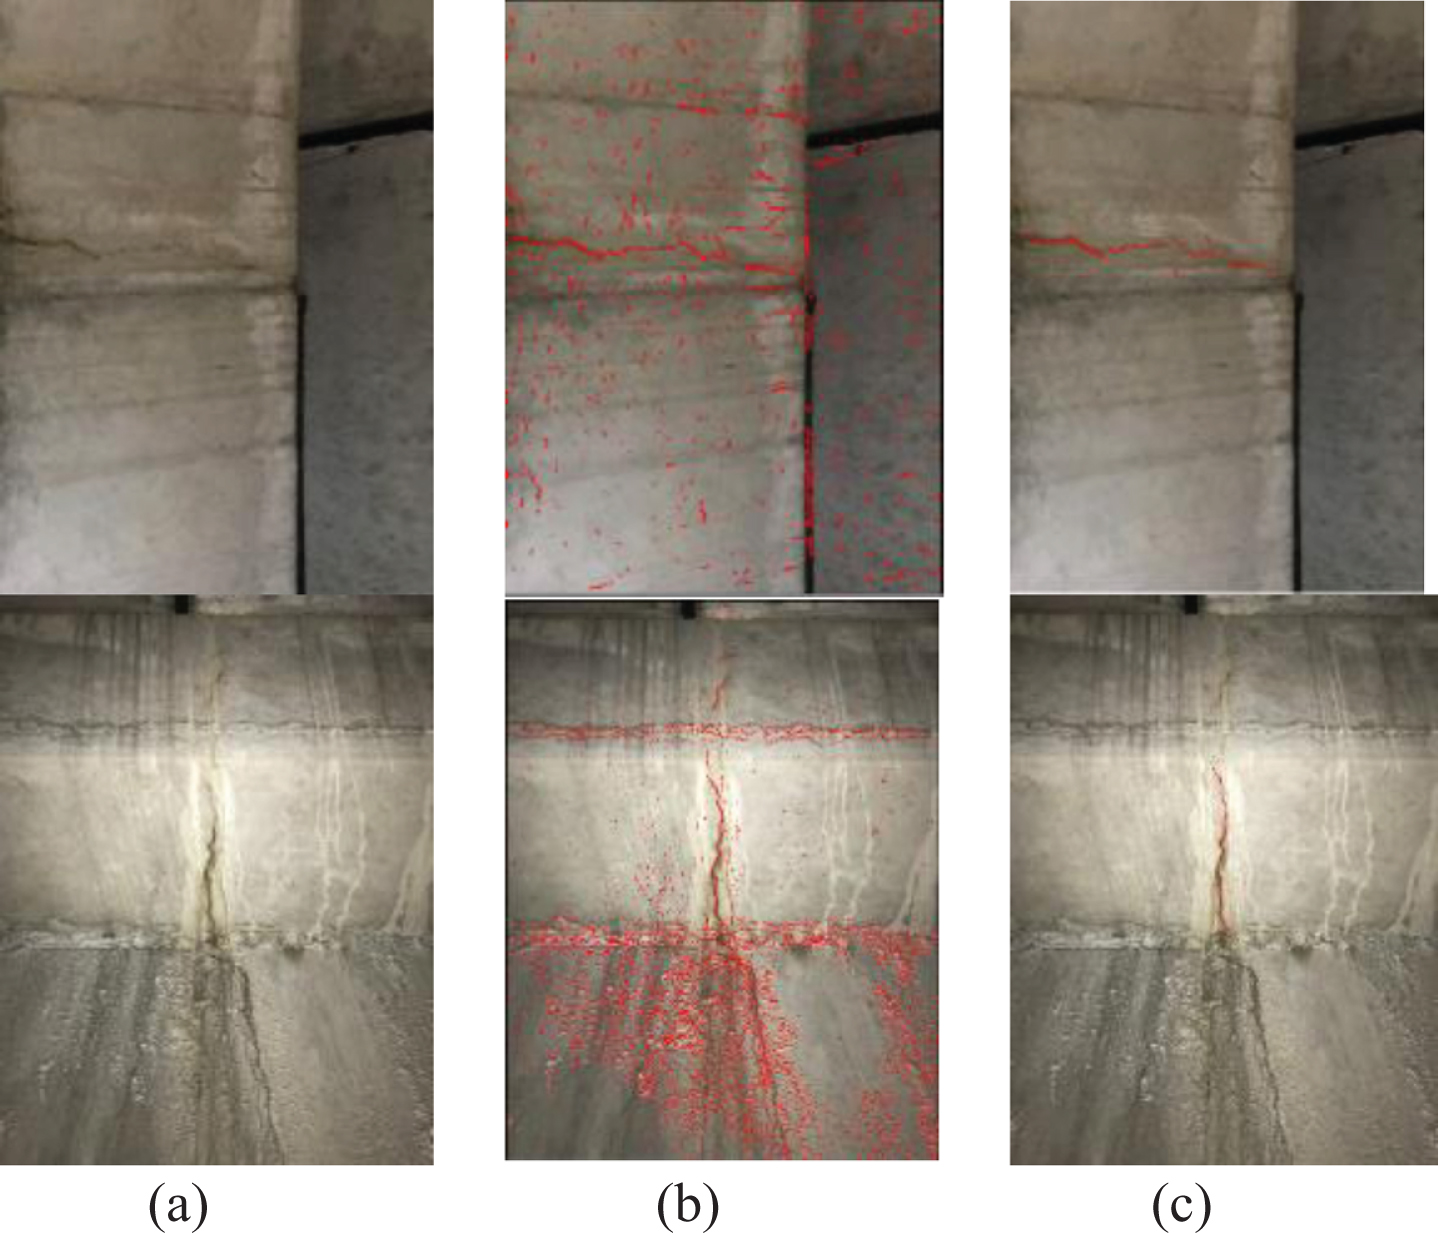
Figures 10(a) and 11(a) are the original images, Figs. 10(b) and 11(b) are the best-performing LoG images mentioned in the paper [7]. Our adaptive images of segmentation are Figs. 10(c) and 11(c). It can be seen that LoG and the proposed algorithm can detect crack regions well when the illumination is uniform, the background is not disturbed, and the image purity is high. However, the LoG algorithm detects that some non-crack regions around the crack edge are incorrectly divided. In the real tunnel environment, the crack area is often accompanied by leakage of water, dust, and other noises. The captured image is uneven in brightness, and the purity is low, as shown in Fig. 11(a). Compared with LoG and the algorithm, we can see that the LoG algorithm has more discontinuities, and there are more missed detections. However, our algorithm can identify most of the crack regions, and there are fewer discontinuities.
(a) original image (b) LoG edge detection (c) ours.
(a) original image (b) LoG edge detection (c) ours.
Six images in different environments of the tunnel are selected, for a more accurate comparison, we use the ROI detected by the deep learning as the raw image, shown in Fig. 12. Our algorithm is compared with OTSU, iterative method and watershed [32], and we also analyze the false detection ratio under different algorithms.
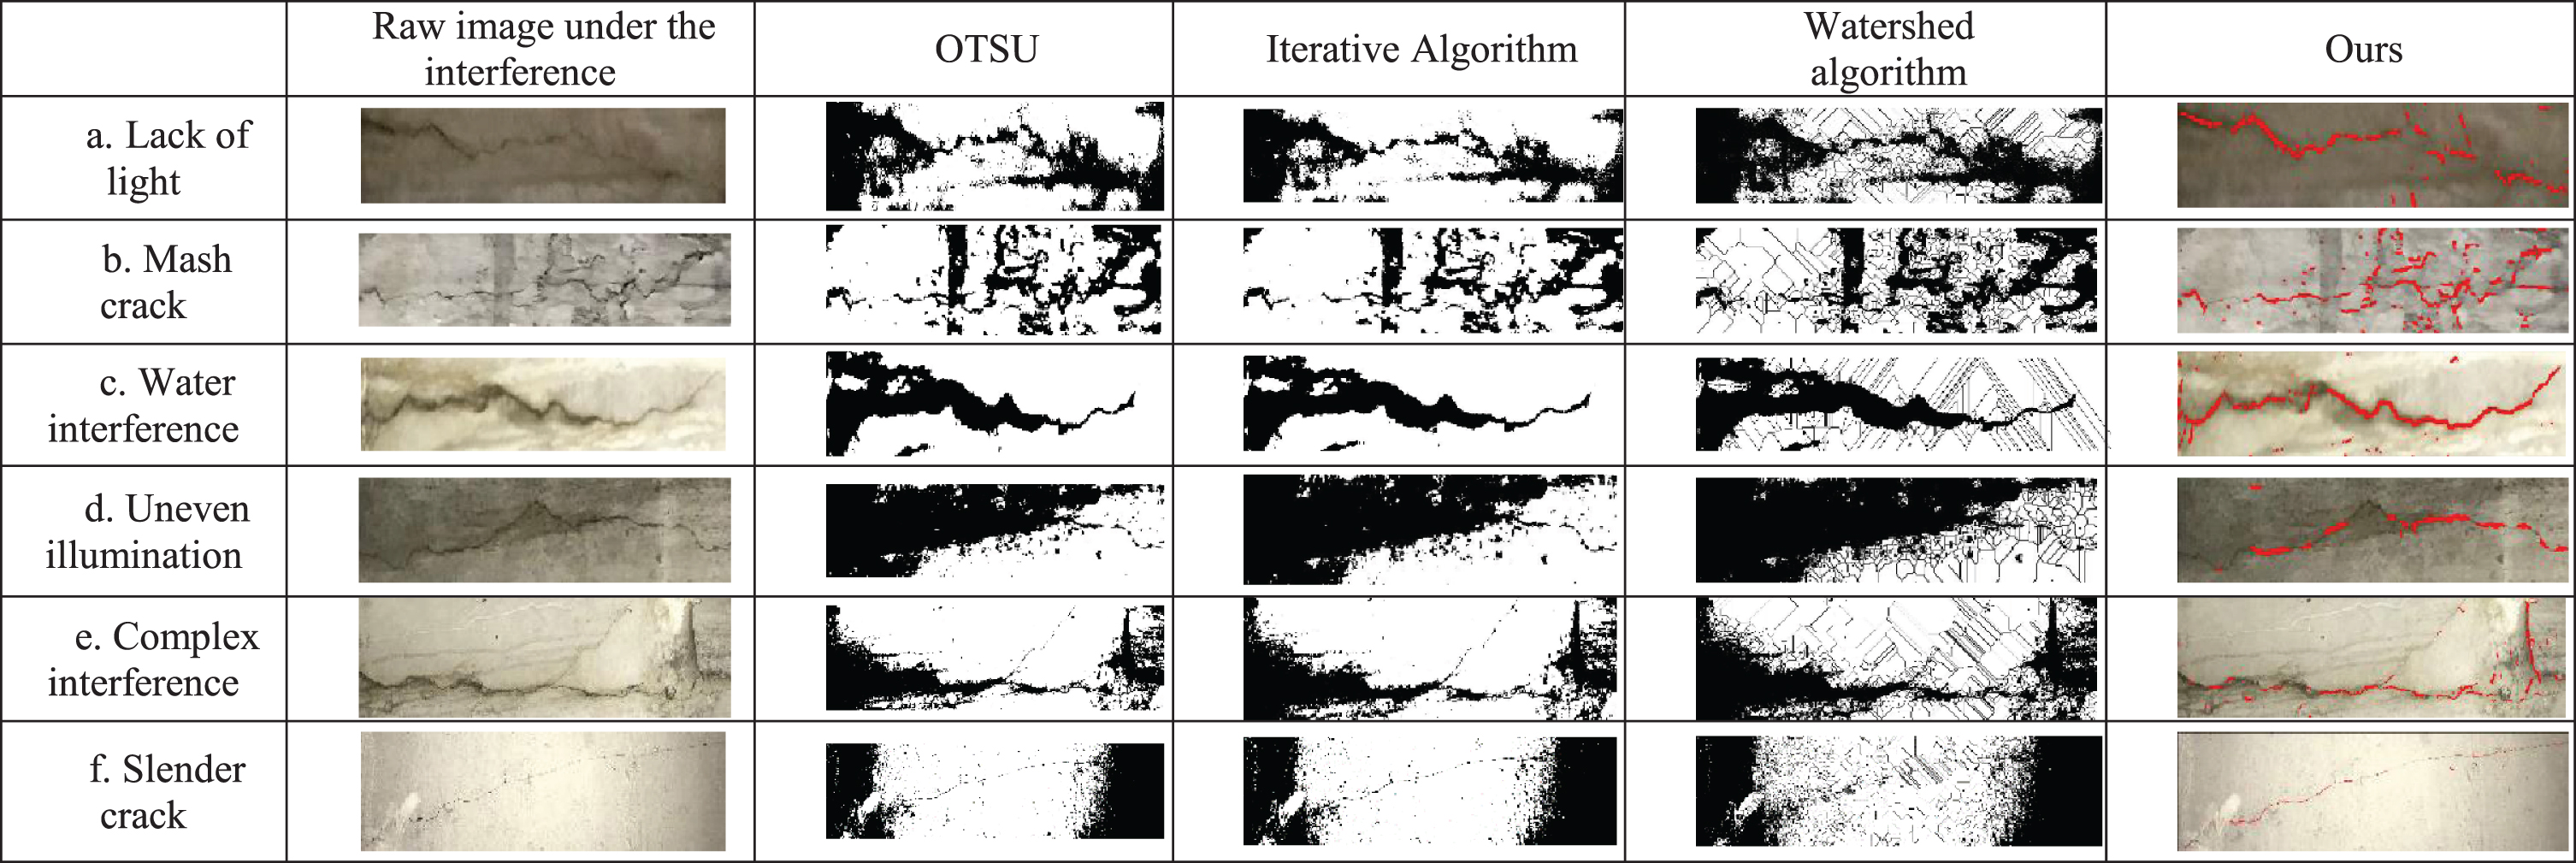
Comparison of the segmentation effects of different algorithms and the algorithm of this paper on crack.
As shown in Fig. 12a, in the case of insufficient illumination, the whole picture is grayed out the area.
As shown in Fig. 12b, OTSU and iteration method can segment most of the mesh cracks, but because of the warping of the crack wall, under the light mapping, there are more shadows around the cracks in the original image, which makes it difficult to identify them. In this paper, the algorithm avoids the surrounding shadow area and only extracts the crack itself, but for the wall pits, the filter is insufficient, and some of the wall pit noise are extracted incorrectly.
As shown in Fig. 12c, tunnel cracks are often accompanied by water leakage, and it is difficult to distinguish the crack area due to water leakage. OTSU, iterative method, and watershed algorithm mix leaking water and crack. The algorithm in this paper resists the interference of surrounding seepage water.
As shown in Fig. 12d, the uneven illumination image, the upper part is darker due to insufficient light, and the lower part is brighter. OTSU, iterative method, and watershed extract all the lower dark areas, and the crack area is not visible. The algorithm in this paper avoids this problem by the illumination equalization method, but there are some breakpoints after detection.
As shown in Fig. 12e, the tunnel lining usually attaches to the cobweb dust and stains. They are adjacent to the crack in the color space, and the web shape of the spider web is also indistinguishable from the crack. It can be seen that OTSU, iterative method and watershed have better detection in the middle, but the spiders and other stains are misidentified in the upper and lower parts of the picture. The algorithm in this paper correctly filters out the interference of spider web dust and stains.
Figure 12f shows that the width of cracks is usually small in the initial stage, which is characterized by slenderness. By comparing the segmentation results, it can be seen that OTSU, iteration method, and the algorithm in this paper identify correctly the slender cracks, while the detection results of a watershed algorithm contain too much noise information, causing the picture to be unclear and the cracks to be submerged in the noise.
As shown in Fig. 13, in six different interferences, the detection area false ratio of the algorithm in this paper is always maintained at a very low level, while other algorithms fluctuate sharply with the different interferences.

Detection area false rate of different interference for crack recognition.
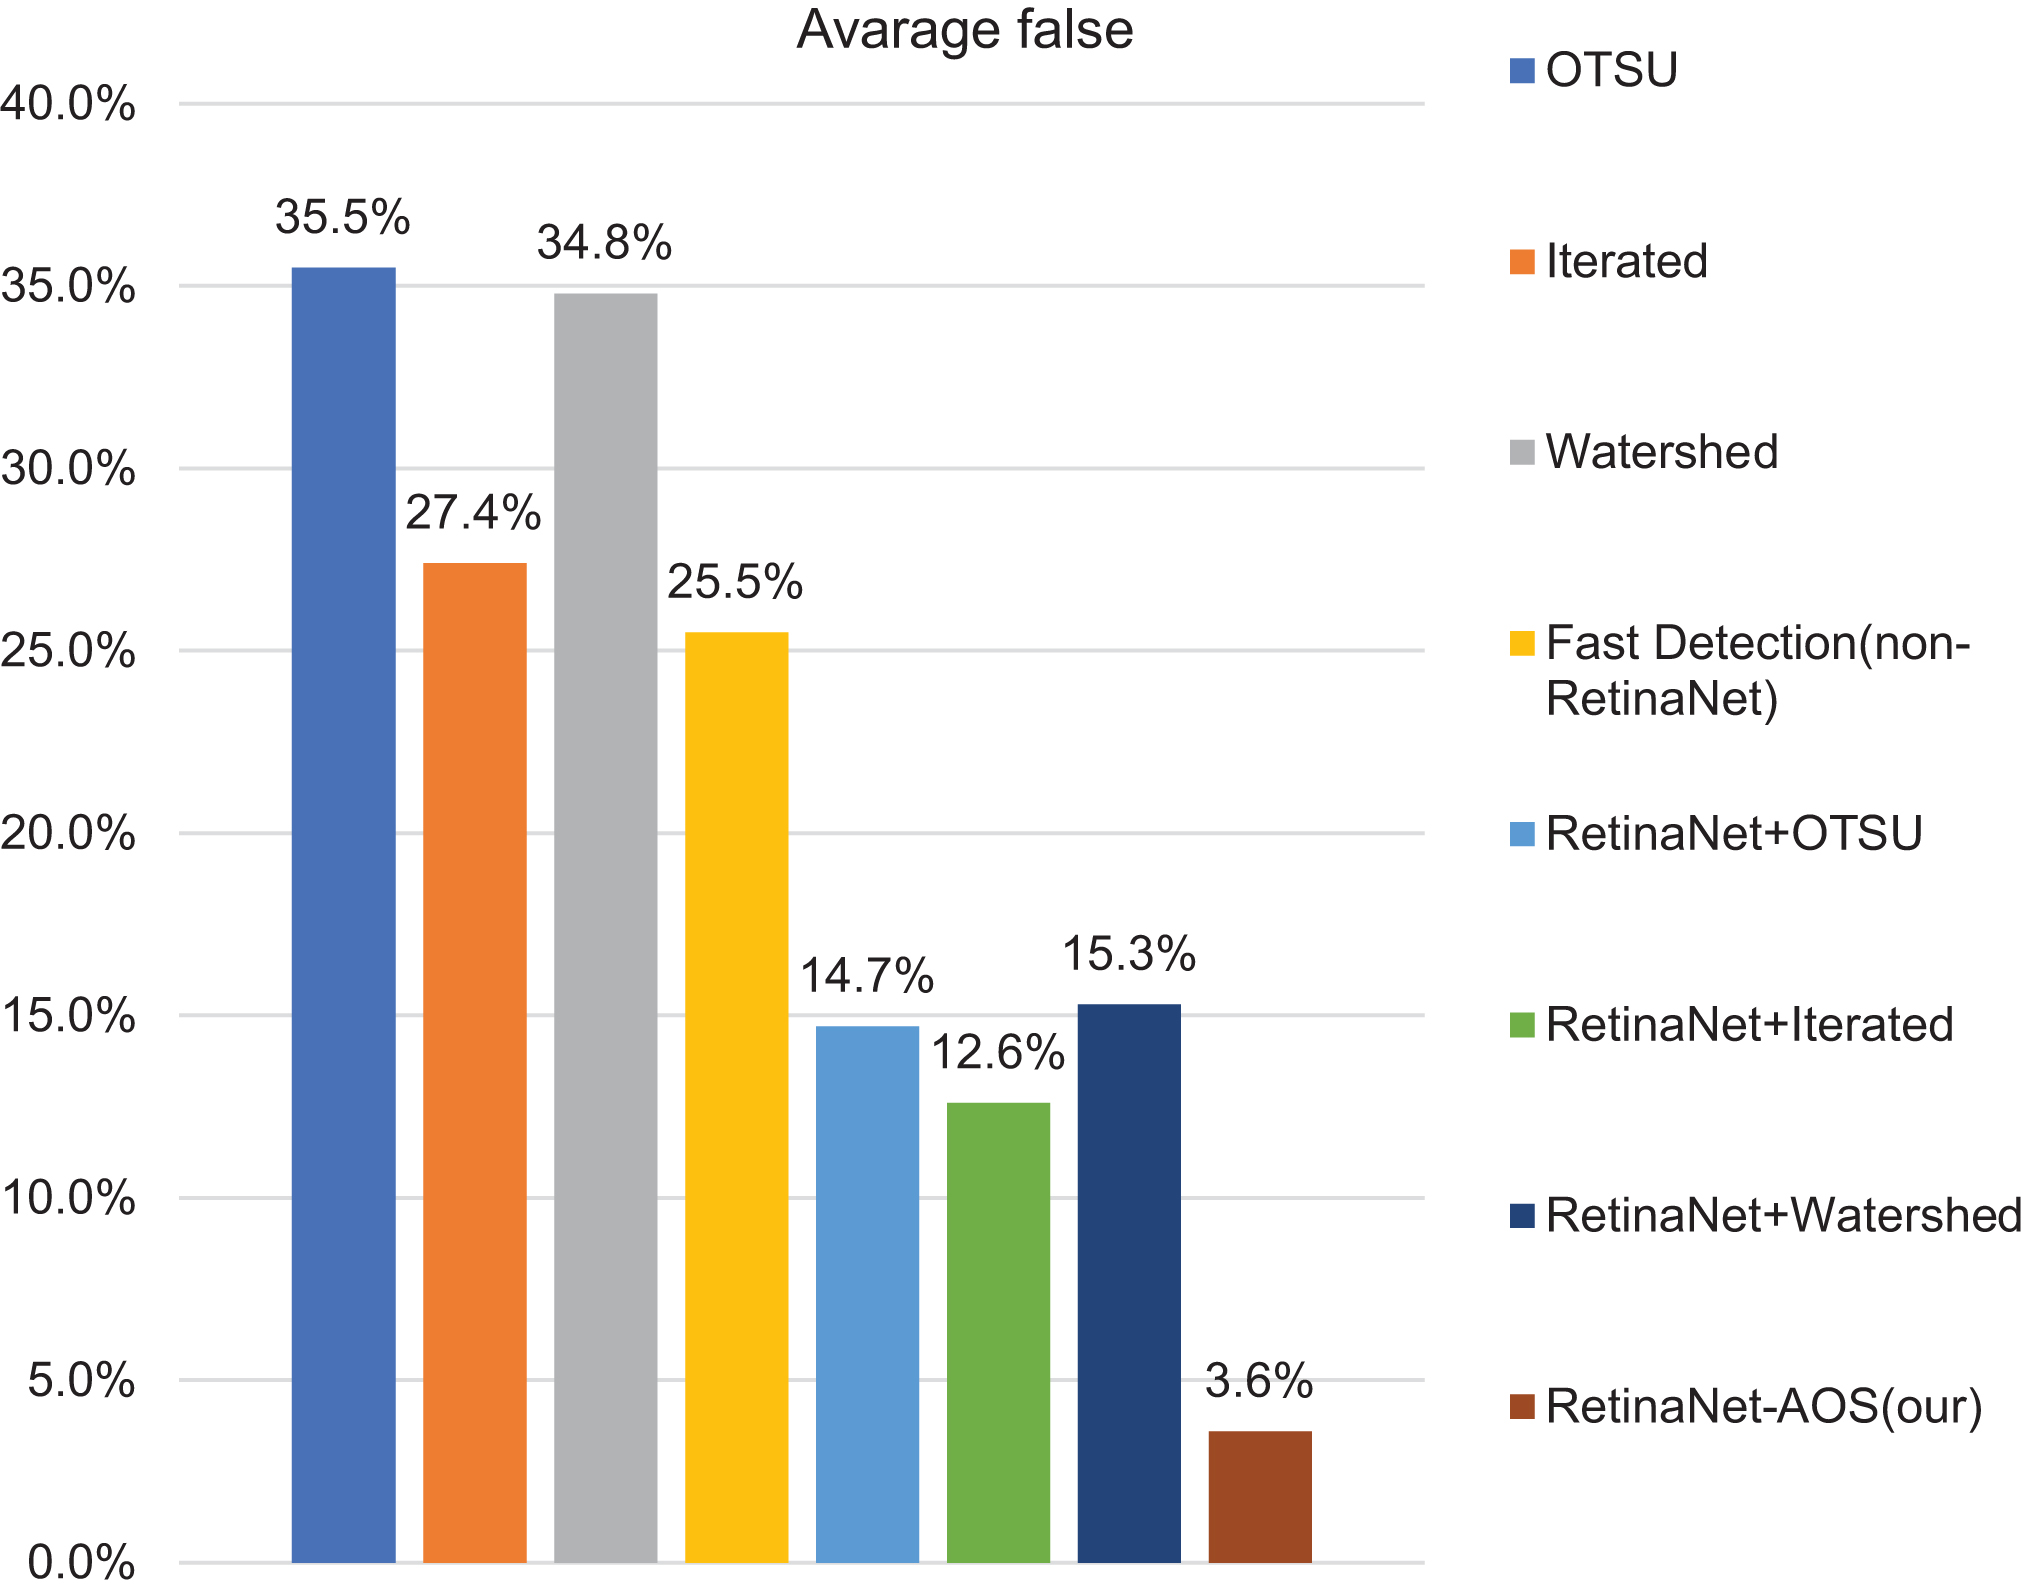
As shown in Fig. 14, in order to test the stability of the algorithm more intuitively, we choose more than 40 crack images extracted for detection, the false detection rate is averaged. Compared to the other three methods, our false detection rate is lower. For example, the OTSU false detection rate is 0.36 on average, watershed algorithm is 0.35 and iterated algorithm is 0.27, while our false detection rate is 0.04 on the average.
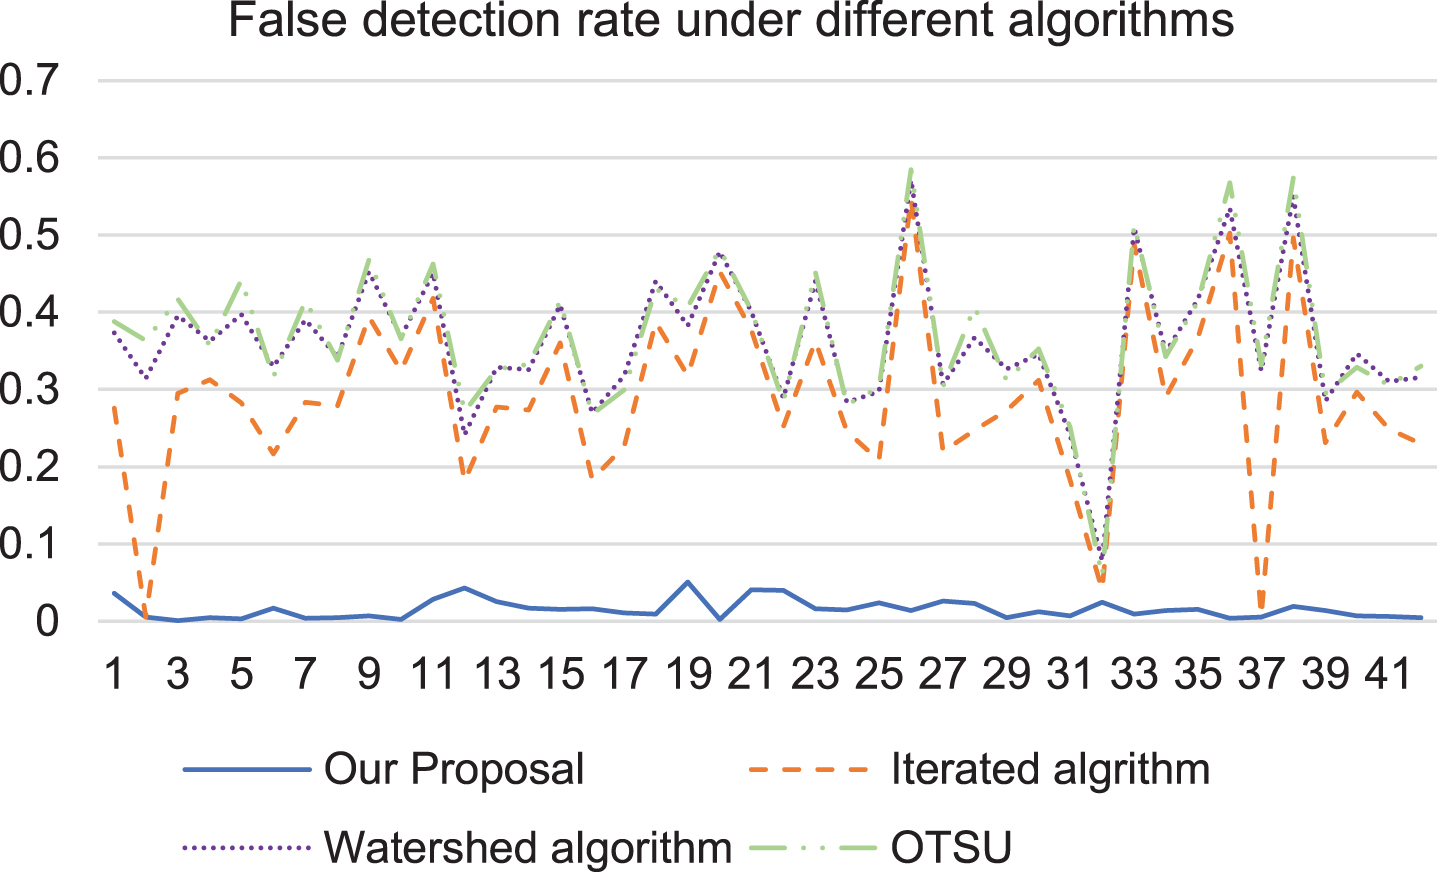
False detection rate under different algorithms.
Table 1 shows the measures of variation, compared with our algorithm and the other three algorithms, the results show the other three algorithms fluctuate considerably. In the detection, more back-end information is attributed to the crack region, resulting in a high false detection ratio. The algorithm in this paper calculates the optimal solution under the current conditions through an adaptive method and ensures the accuracy of the detection to achieve the stability of the algorithm under complex and variable environments.
Measures of variation
Compare this paper’s adaptive segmentation algorithm with three popular semantic segmentation algorithms: (1) FCN [33], The earliest proposed fully convolutional neural network for semantic segmentation. (2) PSPNet [34], Multi-scale pyramid pooling is used to extract the network of multi-scale features. (3) UNet [35], Completely symmetrical network, using feature decoding coding mode.
The corresponding experiments are carried out under the computer configurations of Centos 7.6, CUDA 9.0, cuDNN7.6, Keras 2.2.4, NVIDIA Tesla P100, Intel Xeon Silver 4110, and 64 G memory systems.
In this paper, the open source dataset DeepCrack [24] is used for experiments. DeepCrack has 300 training pictures, 237 test pictures, and the picture size is 544*384, The quantitative results on the DeepCrack test dataset are shown in Table 2.
DeepCrack Dataset Experimental Results
DeepCrack Dataset Experimental Results
The segmentation algorithm has achieved 93.55%, 71.24%, 80.89%, 83.50%, 99.10% on P, R, F1, MIoU, and accuracy indicators, respectively. Precision is 3.48% higher than PSPNet, and the Recall, F1, and MIoU indicators are slightly lower than UNet. It is superior to the other three methods in Accuracy and FPS, especially in detection speed. The visualization of the detection results is shown in Fig. 15. In general, the segmentation accuracy of the algorithm in this paper has reached a usable level, and it is more suitable for tunnel crack scenes with high real-time requirements.
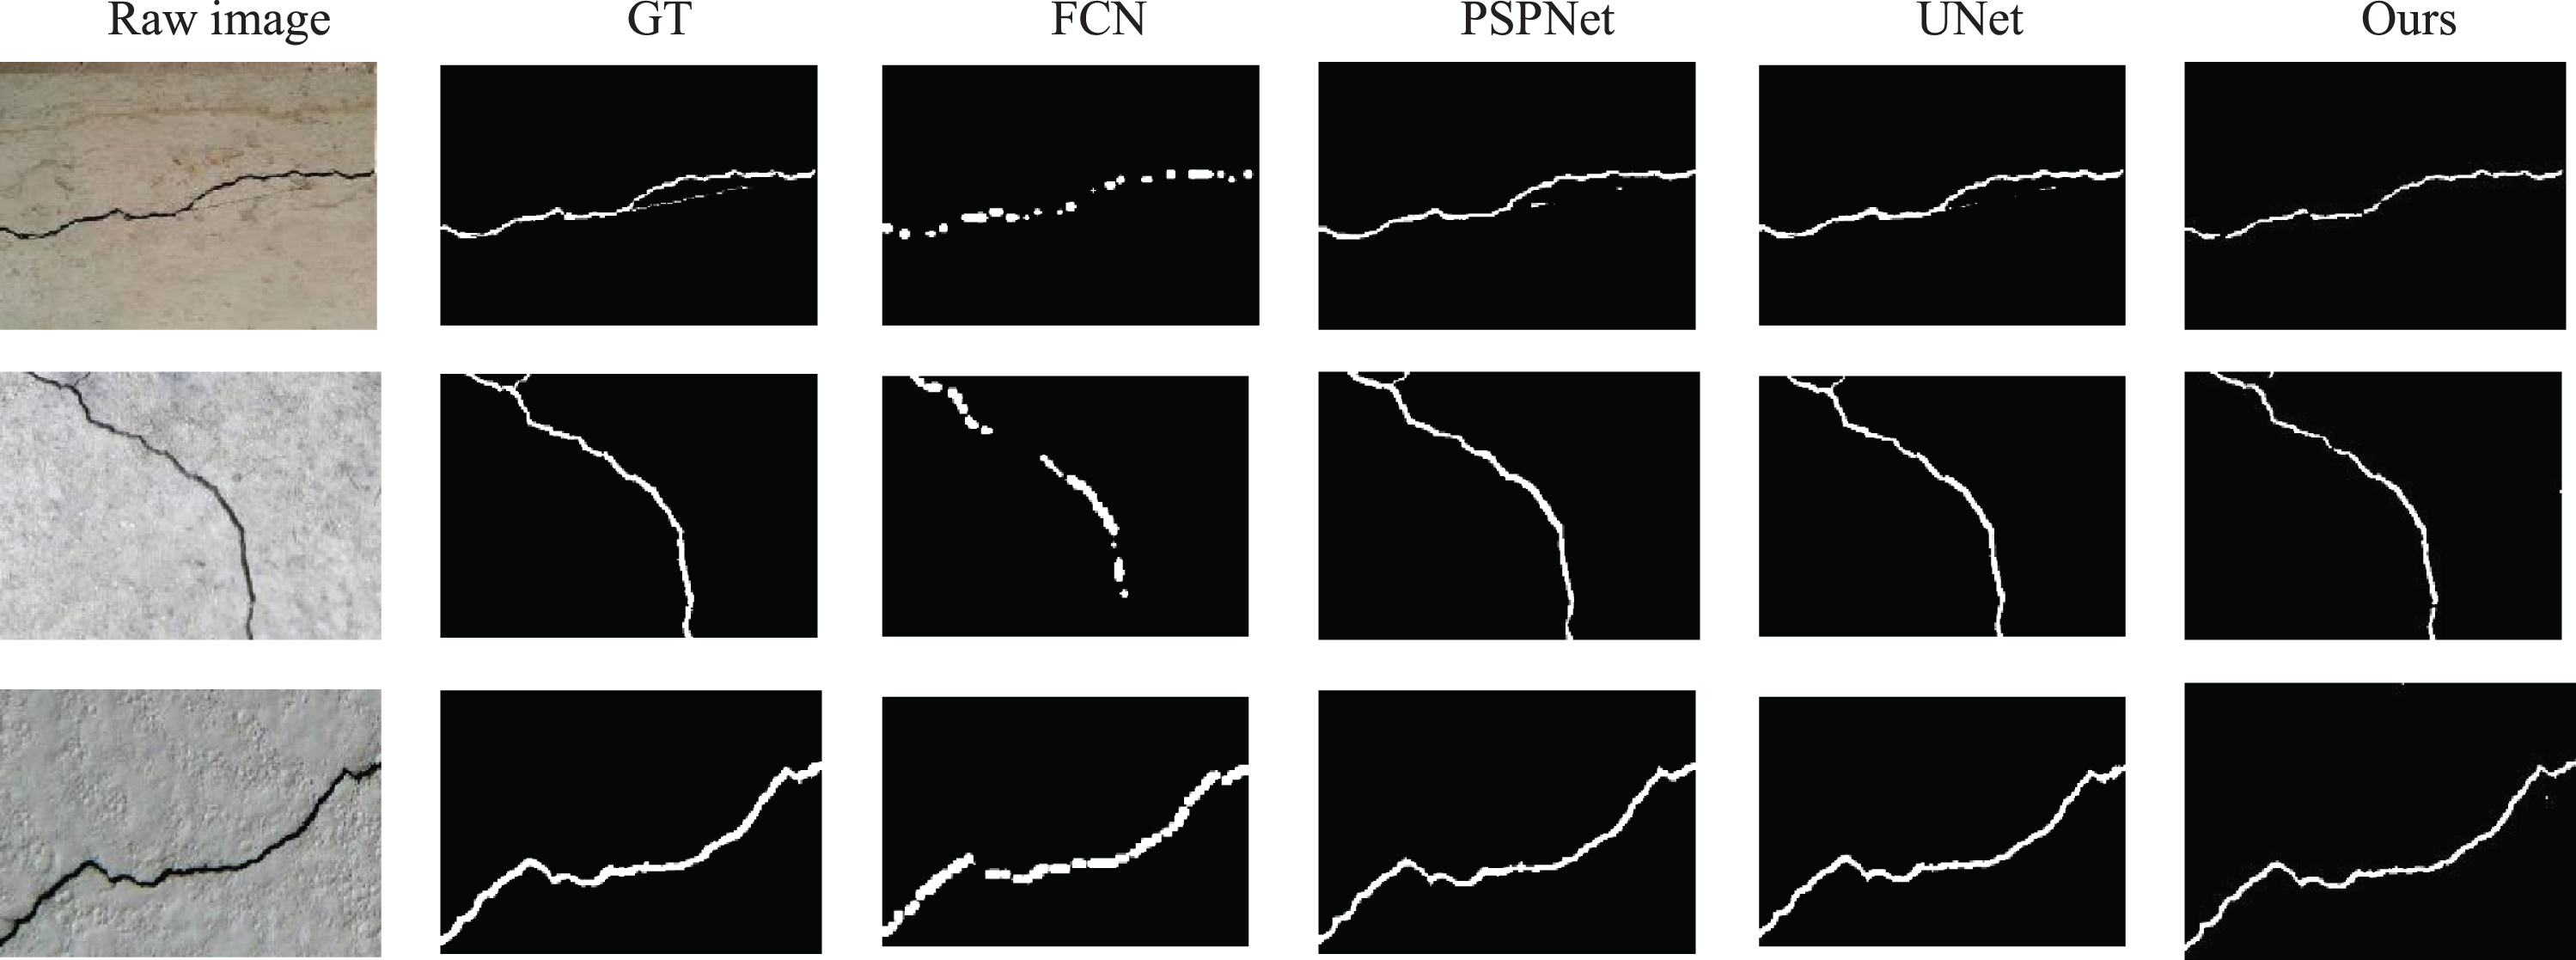
DeepCrack Dataset Segmentation Visualization Results.
Faster R-CNN [30], YOLOv3 and RetinaNet algorithms are used to detect the tunnel crack data set in this paper. The experimental results are shown in Table 3. It can be seen that RetinaNet algorithm performs best in three kinds of crack detection. But in the detection speed, it is between Faster R-CNN and YOLO algorithm, which achieves the balance of speed and accuracy.
Comparison of different algorithm
Comparison of different algorithm
In the previous crack detection papers, most of the articles tend to focus on the direct segmentation of the acquired images, however, because the small features in the initial formation of the cracks are not distinct, direct processing of the entire image drag down the processing speed, and contain numerous suspected misidentifications. In this paper, firstly, we use the pre-deep learning network to detect and delimit the smaller defect area. At the same time, we use the regions of interest merge processing to reduce the regions to be significantly processed, which can improve the detection speed and reduce the interference of the irrelevant regions to the segmentation effect. As shown in Fig. 16, we can see that Fig. 16(b) is generated by dividing the whole picture, resulting in a large number of misidentification areas.
Comparison between undetected direct processing and post-extraction processing.
In Fig. 16(c), the processing of the pre-detection network reduces the difficulty of subsequent processing and improves the accuracy of the final result.
As shown in Fig. 17, our Fast detection (without RetinaNet pre-detection) has the lowest false detection rate in OTSU, iterative algorithm and watershed algorithm,25.5% of the false detection rate is challenging to accept in engineering. By adding the pre-deep learning network, the average false detection rate has been dramatically reduced, reaching 3.6%.
Average false of different algorithms.
Using ROI merge algorithm, we further reduce the algorithm processing time (from 892.6 ms to 658.4 ms).
In this article, we propose a novel crack detection algorithm based on deep learning object detection and adaptive optimization. First, the ROI region of interest merging algorithm is used to filter out a large amount of irrelevant background interference information. This algorithm is shown to not only reduce the amount of image processing but also avoid the possibility of subsequent error processing to some extent. Second, because of the poor adaptability of traditional segmentation algorithms, an adaptive optimization method is proposed in this paper. Based on rapid detection, the method uses a scorer to measure the effect of ROI region segmentation to achieve optimal results, and further optimized with a multi-dimensional classifier. Finally, this article uses an optimal adaptive selection based on the RetinaNet algorithm for different crack types. The training model used here uses small sample data set collected in the field with good pixel level clarity, and the test results show that this method delivers good performance in terms of detection accuracy and speed.
By comparing the performance of Faster R-CNN, YOLO, and RetinaNet algorithms on the fractured data set in this paper, the effectiveness of the network is verified. Compared to traditional algorithms, even with six types of interference, our algorithm performed better than three traditional image recognition algorithms such as OTSU, watershed algorithm, and iterative algorithm for detecting tunnel cracks. The environmental space may have other types of interference and can potentially lead to errors. The false detection rate decreased from 0.36, 0.35, 0.27, 0.04, respectively, in OTSU, watershed algorithm and iterative algorithm, and the proposed algorithm.
Compared to the related deep learning algorithm on the DeepCrack dataset for the pixel-level crack detection, the algorithm achieved 93.55%, 71.24%, 80.89%, 83.50%, 99.10% in P, R, F1, MIoU, and accuracy indicators, respectively. Precision is 3.48% higher than PSPNet. It is superior to the other three methods in accuracy and FPS, especially in detection speed.
Next, we can improve the algorithm in the following aspects: (1) We know that the amount of data in the same framework directly affects the accuracy of the deep learning algorithm. In the future, we can enrich the existing defect dataset through continuous sample collection and improve the deep learning detection effect. (2) The scorer directly affects the subsequent detection effect. By enhancing the design method of the scorer and increasing the more effective scoring basis, the robustness of the algorithm processing can be improved. (3) Since the method in this paper is not compared with the existing deep learning methods in actual engineering applications, this is the lack of this paper. Later comparative experiments should be carried out in this area to verify whether the method in this paper is superior.
Footnotes
Acknowledgments
This work was supported in part by Science and Technology Commission Project: Intelligent recognition of shield tunnel state and optimization of control strategy (No.18DZ1205502), and is supported by Science and Technology Commission Project: Risk analysis of urban viaduct traffic safety (No.18DZ1201204)