
Abstract
Most of the electroencephalography (EEG) based emotion recognition systems rely on single stimulus to evoke emotions. EEG data is mostly recorded with higher number of electrodes that can lead to data redundancy and longer experimental setup time. The question “whether the configuration with lesser number of electrodes is common amongst different stimuli presentation paradigms” remains unanswered. There are publicly available datasets for EEG based human emotional states recognition. Since this work is focused towards classifying emotions while subjects are experiencing different stimuli, therefore we need to perform new experiments. Keeping aforementioned issues in consideration, this work presents a novel experimental study that records EEG data for three different human emotional states evoked with four different stimuli presentation paradigms. A methodology based on iterative Genetic Algorithm in combination with majority voting has been used to achieve configuration with reduced number of EEG electrodes keeping in consideration minimum loss of classification accuracy. The results obtained are comparable with recent studies. Stimulus independent configurations with lesser number of electrodes lead towards low computational complexity as well as reduced set up time for future EEG based smart systems for emotions recognition
Keywords
Introduction
Emotional states recognition plays an important role in research area of human computer interaction [1–5]. Electroencephalography (EEG) is one of the widely studied modalities for emotions classification [2, 6–15]. Gao et al. [9] conducted a study to record EEG data while participants were watching different videos and experiencing different emotions. From recorded data, features extraction and classification have been performed considering different frequency bands. In one of the studies, Li and Lu [11] concluded that higher frequency band plays significant role in emotion recognition while watching audio-visual movie clips. For EEG based systems, the dimension of feature vector increases drastically with higher number of electrodes and longer time segments. This high dimensionality often leads to the curse of dimensionality that ultimately affects the performance of the classifier [16–19]. In order to cater these issues, optimization of features is required that prove beneficial in reduction of overall dimensionality along with preserving the class-related information [16]. Generally, this aforementioned problem is considered as feature or electrodes optimization problem [17]. Ignoring the electrodes selection part while developing a real-time system [18, 19] can also lead to data redundancy [20–23] and higher equipment and computation cost of the system [13, 24]. To mitigate the issues, various methods and algorithms have been proposed [13, 25]. Qiu et al. have used Sequential floating forward selection (SFFS) for electrode selection with EEG based motor imagery data [24]. Lie et al. [25] have worked for the discrimination between right hand imagery and resting state. They achieved average accuracies of 95.25% and 93.50% with 30 channels (without channel selection) and top-five-channel configurations respectively. Concerning the domain of emotion recognition, there are ample studies focusing towards electrodes selection. Zhang et al. [13] conducted a study to classify emotional states with EEG data recorded with 32 electrodes and obtained 58.75% accuracy. They also worked on electrodes selection and achieved 57.67% accuracy with 12 electrodes only. Pane et al. [14] worked on EEG based emotional states dataset comprising of four emotions (happy, sad, angry and relaxed).The study successfully achieved higher classification performance using three pairs of six asymmetric electrodes comprising of C3–C4, O1–O2 and T7–T8.
Concerning the features optimization problem, we observe that in recent years evolutionary algorithms (EA) have been widely used by research community [26–32]. Genetic Algorithm is one of the methods amongst EA algorithms for optimization to determine whether a certain number of features would be the most efficient out of the whole set. The algorithm has been successfully applied in solving optimization problems in several application domains [29–32].
For real-time future emotion recognition systems, there is a need to generalize the findings for different scenarios. Databases like MAHNOB-HCI, DEAP and SEED [11, 13] have been used for emotion recognition quite successfully in research community. One of the common characteristics of these databases is that emotions are captured with single stimulus paradigm either videos, images or sounds. While conducting the experiments for specific scenario, it is quite important to determine the appropriate stimulus. Considering single stimulus for recognizing emotional states can lead to low ecological validity of the emotion recognition system. The question “whether different stimuli for same emotion elicitation generate any stimuli-independent neural dynamics and correlates” remains unanswered. Moreover, the research work should not be only targeted for healthy persons who can express emotions by viewing and hearing external stimuli. For subjects with physical disablitiy or deaf blindedness who are unable to communicate with normal muscular means, the use of external stimulus to evoke emotions becomes ineffective. It has been observed that studies on neural correlates of emotional imagery or self-induced emotions are scant [15].
Concerning entire aforementioned issues, there is a need to conduct studies in which EEG neural correlates could be investigated independent of stimuli presentation paradigms for emotion recognition. In this work, we have presented a novel dataset that records EEG data for fear, neutral and joy human emotional states evoked with four different stimuli presentation paradigms recorded with 64 EEG electrodes. Three paradigms are using external medium to evoke emotions that include videos, images and sounds. The fourth paradigm is based on emotional imagery or memory recall that does not require any external stimulus. Furthermore, a methodology based on iterative Genetic Algorithm in combination with majority voting has been used to achieve configurations with reduced number of EEG electrodes. The method in combination with common spatial pattern (CSP) performs feature extraction and classifies emotional states using Linear Discriminant Analysis (LDA) algorithm. Following are the contributions of the presented work: To the best of our knowledge, this is the first EEG study to assess neural correlates of human emotional states making use of four different emotion-evoking / stimuli-presentation paradigms. Identification of most relevant spectral bands and brain regions with respect to each paradigm. Specific to paradigm, we successfully achieved reduced electrodes configuration with improvement in classification performance Successfully achieved common reduced EEG electrodes configuration independent of paradigm with least possible compromise in classification accuracy.
This work is extension of our previous work [33] in which we have conducted experiments for dual stimuli based fear state classification. No study has been conducted focusing towards minimization of EEG electrodes while distinguishing different emotional states evoked with four different emotion inducing scenarios. Remaining paper is structured in following manner. Section 2 elaborates research methodology. Experimental setup is presented with description related to participants and protocol. Later on, the approach used to perform data analysis has been explained. Section 3 presents results and findings. In Section 4, obtained results are discussed. Section 5 presents the overall conclusion.
Methodology
The proposed methodology comprises of different phases. The first sub-section 2.1 is about ‘EEG data acquisition’ that includes explanation of experimental setup and protocol along with details of participant and EEG device used for recording data. The next step 2.2 explains the data analysis mechanism for EEG data acquired originally from all 64 electrodes. Later on in section 2.3, methodology to generate configurations with reduced number of electrodes on the basis of Genetic algorithm has been elaborated.
EEG data acquisition
We have conducted experiments with twenty young university going students (9 female; 11 male). Average age of the participants is 24.8 years. Before conducting the experiments, the purpose of study has been explained and consent form has been taken from all participants. The experimental study involving human participants described in this research work was approved by the local ethics committee of Bahria University, Pakistan. The data from two subjects were excluded. One of the excluded participant’s data has major movement artifact and other participant did not complete the experiments. EEG data is acquired using BrainAmp and ActiCap setup with 64 active electrodes positioned according to the 10–20 international system [34]. Signals were recorded with sampling frequency of 1000 Hz. The skin–electrode impedance was kept below 20 kΩ using the ActiCAP control software.
The experiments were conducted in a laboratory environment. In the first stage, a briefing was presented to the subjects with respect to the purpose of the experiment being conducted. They were informed that EEG signals will be recorded while experiencing four different emotion inducing paradigms. A questionnaire was given to each participant in which they wrote about any incident of their real life that is associated with fear or joy emotion. While performing the experiments, the participant was requested to stay still and relaxed. For stimuli presentation, LCD screen was placed at a distance of about 50 cm. Following are four scenarios / paradigms conducted with each participant: Paradigm – 1 – EI (Emotional Imagery / Self-Induced) Paradigm – 2 – VI (Videos Induced) Paradigm – 3 – SI (Sounds Induced) Paradigm – 4 – PI (Pictures Induced)
For each paradigm, three emotional states of fear, neutral and joy are considered. For each emotional state in each paradigm, we have conducted different number of trials with single participant as mentioned in Table 1. For emotional imagery (EI) and videos induced (VI) paradigms, there are total thirty trials are conducted. While in case of pictures (PI) and sounds (SI) induced scenarios, each experiment consists of 135 trials. Time duration of each of the trial is also mentioned in next row. For EI paradigm, single trial consists of 60 seconds. In PI paradigm, the image or picture is shown for 7 seconds. In case of videos-induced (VI) stimuli, the video clips of different time lengths are played ranging from 60 to 180 seconds. Sounds are played for 6 to 10 seconds in case of SI paradigm. Explanation of experiments for each paradigm is given in following sub-sections:
Blocks Distribution with respect to emotion inducing paradigm and emotional states
Blocks Distribution with respect to emotion inducing paradigm and emotional states
The trial in this paradigm starts with 5 s of baseline recording. Then the participant is asked to recall the relevant memory for considered emotional state specified in the questionnaire. The subject is verbally signaled by the researcher to start activity that continues till 60 seconds. EEG recording is then stopped. The participant is given a 30 second break after each trial and asked to rate arousal level and specify emotional state experienced during the experiment. Following is the sequence for a single trial: Baseline signal collection for 5 seconds The activity is initiated after a verbal signal. The incident/ memory / imagination mentioned in the questionnaire is recalled by the participant. The activity is stopped after 60 seconds. 30 s time is provided to rate arousal level and specify emotional state
Paradigm–2-VI (Experiments performed while viewing videos)
In this paradigm, different videos are shown to the participants in each trial. Total thirty videos are shown alternatively with respect to fear, neutral and joy. Following is the sequence for a single trial: Baseline signal collection for 5 seconds Video clip is displayed after verbal signal. The activity is initiated. Participant views the movie clip being displayed for 120 – 180 seconds The activity is stopped. 30 s time is provided to rate arousal level and specify emotional state
Paradigm–3- SI (Experiments performed while listening sounds)
During each trial of this paradigm, the participants listen different sounds. Total 135 sounds are played alternatively with respect to fear, neutral and joy. Following is the sequence for a single trial: Baseline signal collection for 5 seconds The activity is initiated after verbal signal and the sound is played Sound continues for 5-10 s The activity is stopped. 30 s time is provided to rate arousal level and specify emotional state
Paradigm–4-PI (Experiments performed while viewing pictures/images)
During each trial of this paradigm, the participants view different images/pictures on the screen. Total forty five pictures were shown with respect to each emotional state. Following is the sequence for a single trial: Baseline signal collection for 5 seconds The activity is initiated after verbal signal The picture / image is displayed for 5 – 7 seconds Picture disappears 30 s time is provided to rate arousal level and specify emotional state
The general sequence diagram for the experiments in each of the considered paradigms is elaborated in Fig. 1. The figure shows sequence of trial for each emotional state in each of the considered paradigm. Figure 1(a) shows sequence of trials for EI and VI scenarios. The Fig. 1(b) represents the sequence for PI and SI paradigms. While Fig. 2 provides general details of the single trial conducted. The next sub-section elaborates details regarding data analysis for acquired signals from 64 EEG electrodes.
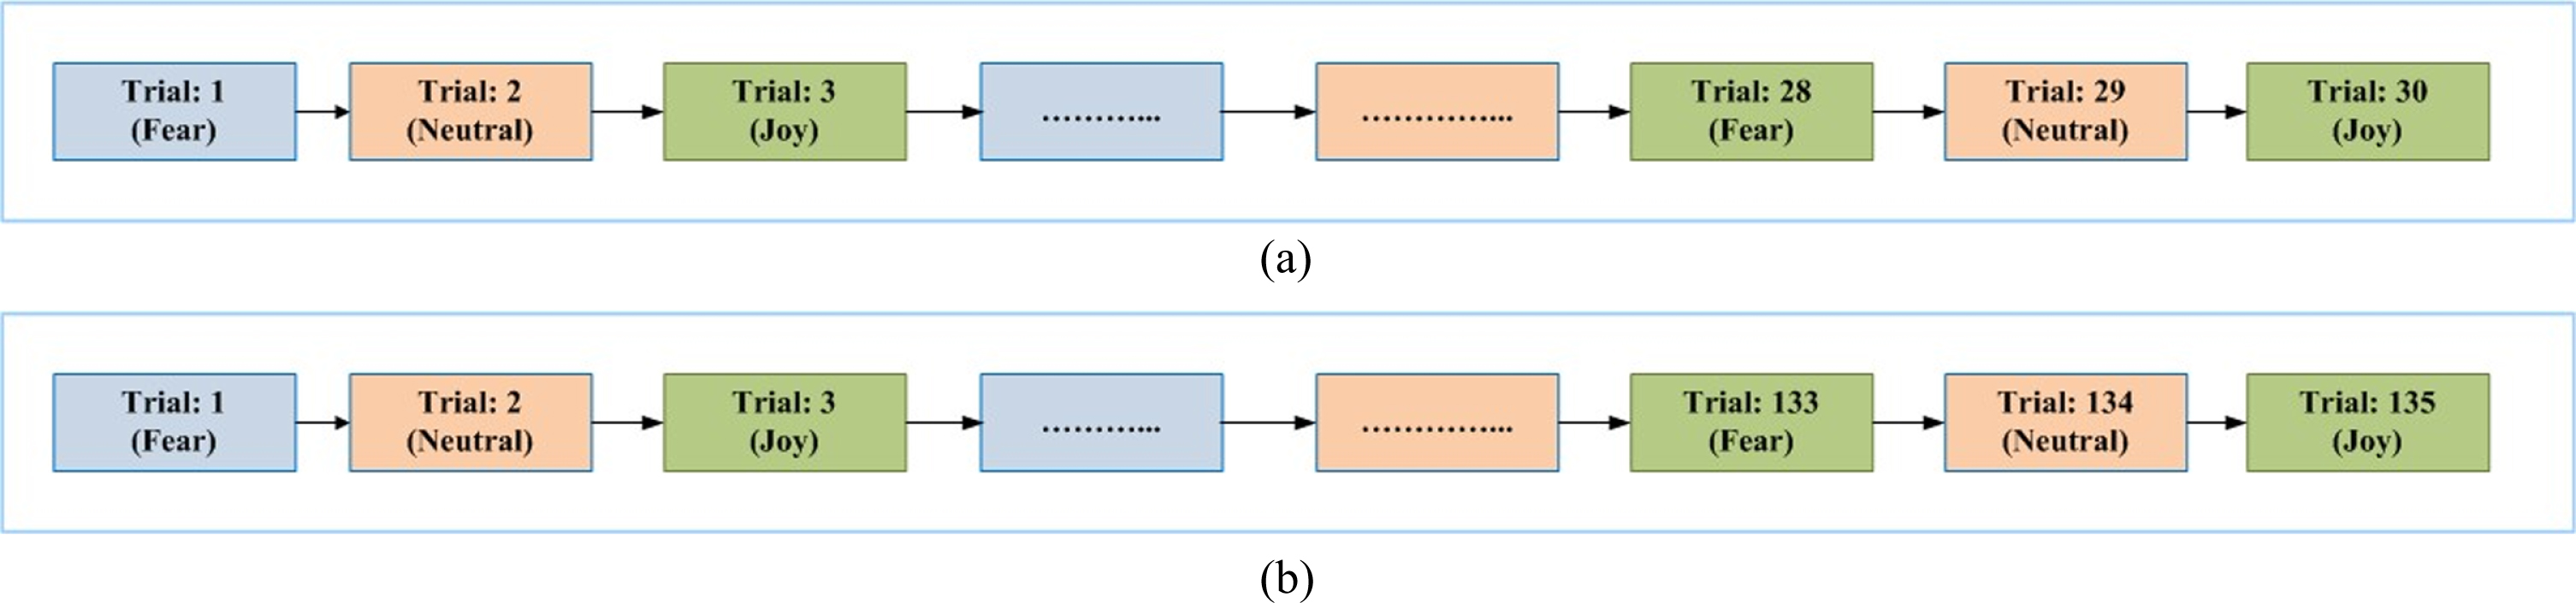
(a) Sequence of trials with respect to the emotional states in EI and VI paradigms (b) Sequence of trials with respect to the emotional states in PI and SI paradigms.
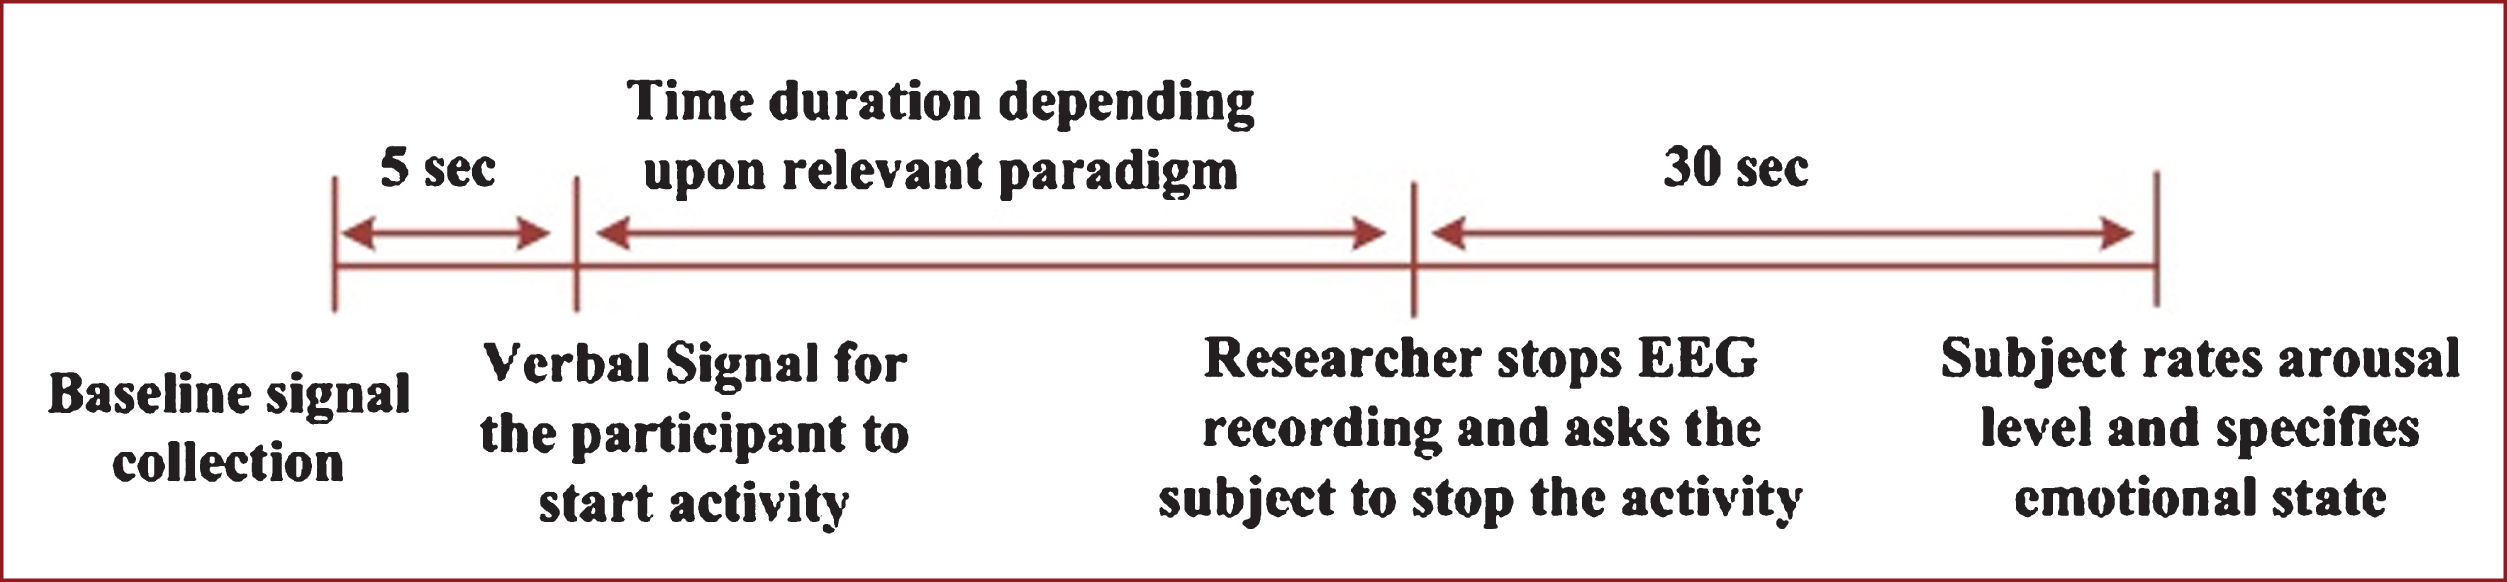
Block diagram of the experiment while conducting a single trial for any emotional states out of fear, joy and neutral.
In this work, we have performed data analysis by considering data for each stimulus paradigm separately. As mentioned earlier, this sub-section explains the data analysis mechanism for EEG data acquired originally from all 64 electrodes as mentioned in Fig. 3. Later on in Section 2.3, methodology to generate configurations with reduced number of electrodes on the basis of Genetic algorithm has been elaborated. In order to perform analysis, we analyzed recorded EEG data using MATLAB toolboxes EEGLAB [35], BBCI [36] and RCSP [37].

Block diagram explaining the Data Analysis for data recorded from all 64 electrodes.
As mentioned in Fig. 3, first stage for data analysis is related to ‘Segmentation of data into training and testing trials and epochs’. For each trial of any specific paradigm under consideration, features are extracted from the time duration mentioned in Table 1. For EI and VI paradigms, last 55 s are considered for data analysis. While in case of PI and SI scenarios, last 5 s of each trial are considered. EEG data in each trial is divided into non-overlapping time windows of one second (1 s) length that is referred to as an epoch. In this work, for emotional states classification we are working with 10 x 10 cross-validation strategy in which the epochs are distributed into ten partitions. Out of ten, nine partitions (i.e., 90% of the data) are considered for training purpose, whereas remaining one partition (i.e., 10% of the data) is considered for testing. The process is repeated for ten times with different dataset splits. Let’s consider the case for VI paradigm. We have total 30 trials in this paradigm as mentioned in Table 1. Now, for 10 x 10 cross-validation each subset out of 10 contains 3 trials. Now in each run for cross validation, any one subset i.e. 3 trials are considered for testing purpose and remaining 9 subsets i.e. 27 trials are considered for training.
Pre-Processing (Filtering, artifact removal and epochs rejection)
As mentioned earlier, each of the segmented trials from sixty four electrodes are recorded at a sampling rate of 1000 Hz. The EEG signals were then downsampled to 200 Hz. Prior to data analysis, artifacts generated from ocular and muscle movements are removed using independent component analysis (ICA) and max-min based approaches. In case of max-min approach an epoch is rejected if it has amplitude difference greater than 150μV between the maximum and the minimum amplitude values. ICA algorithm is one of the advanced techniques for artifact removal while working on EEG data. The algorithm has proven its capability for isolating neurally generated as well as artefactual sources residing in recorded EEG signals [11, 38]. EEGLAB function ‘runica’ [35] has been used in this work. As mentioned earlier, data analysis for each stimulus paradigm has been performed independently. In case of EI paradigm, on average 7% epochs are rejected. While for PI, VI and SI paradigms, 4%, 5% and 4% epochs are rejected respectively after artifact removal.
Now, the segmented pre-processed epochs are considered for baseline correction. As elaborated in previous section 2.1.1, baseline recording is performed for each paradigm for each trial. We have considered -200 ms prior to the stimulus onset as baseline interval. For this interval, average amplitude value is subtracted from each trial after stimulus presentation. Now, the baseline corrected EEG signals are bandpass filtered in different frequencies bands as follows: Delta (1-3 Hz), Theta (4-7 Hz), Alpha (8-13 Hz), Beta (14-30 Hz), Low Gamma (31-50 Hz), and High Gamma band (51-70 Hz). A butterworth filter of order 5 is used. This operation has produced six bandpass filtered datasets for each of the subjects under consideration.
Feature extraction based on CSP
Common Spatial Pattern (CSP) is one of the widely used algorithms for classification of EEG motor imagery data. In this work, we are using this algorithm for emotion recognition. The algorithm optimally differentiates two classes of EEG signals based on simultaneous diagonalization of covariance matrices for each class [10]. In this work three emotional states are being considered. We have three scenarios fear vs. joy, joy vs. neural and fear vs. neutral. Let’s consider the baseline corrected preprocessed EEG data in a single trial be represented as matrix XNxT where N is the number of EEG electrodes and T is the number of time points recorded in each epoch of 1 s time window from each of the considered electrode corresponding to two patterns (fear and joy). Here, CSP algorithm is employed to obtain a projection matrix. The first and last m columns of the projection matrix are considered to construct a new matrix ω€ XNx2 m. In conventional CSP approach, an input data matrix XNxT is generally transformed as:
The rows of ω and columns of ω-1 are termed as spatial filters and common spatial patterns respectively. The spatial filters obtained from CSP are optimized separately for each frequency band such that it maximizes the variance of the projected signal for one class whereas minimizing for other. The normalized spatial covariance matrix can be computed as:
The CSP projection matrix is computed based on eigen value decomposition. Small number of signals, m, can effectively differentiate between the classes while training the classifier. The signal Y q (q = 1 to 2 m) that maximizes discrimination is associated with the highest values for λ1 and λ2 [37, 39]. Feature vectors fq are computed as follows:
In this work, log variances based on CSP are generated as features for emotional states in consideration. Log-variance of band-pass filtered signals relates to the signal power in that corresponding frequency band for given emotional state.
Classification with linear discriminant analysis
For classification purpose, this work considers Linear discriminant analysis (LDA) assuming that the features extracted from CSP operation are based on different multivariate Gaussian distributions, with different known means, and a common known covariance matrix for each of the considered emotional state [39, 40]. Based on estimates of the common covariance C and class-wise means μ1 and μ2, the weight vector ω of the classification function is determined by
For multiple-class classification, researchers have worked with pair wise strategy that includes one-versus-one or one-versus-rest. Although LDA is basically designed for binary classification, but using pair wise strategy the algorithm has performed quite successfully within the domain of EEG data classification [41–44]. In order to implement 3-class emotional states classification using LDA, we adopted a one-versus-rest strategy yielding three binary classifiers. More specifically, each binary classifier is trained considering the epochs from a given emotional state as positive labels and all other epochs from the remaining / rest of the emotional states as negative labels. Discrete classification is performed such that a class is assigned to each epoch. Let’s consider the case for VI paradigm. In this case, features are calculated on a basis of 1-s epochs from the last 55-s of each trial, resulting in 55 x 10 = 550 epochs from the ten trials as mentioned in Table 1. Each extracted epoch is then associated with a label y(t) ∈ [+ 1,-1] as explained before. Since the sampling frequency is 200 Hz, each epoch is a matrix of 200 rows and 64 columns (as many number of electrodes). To perform classification, the trials are divided into training set and testing set. CSP operation is then applied to compute bandpass features for both training and testing datasets. Each epoch x(t) has been associated with label y(t) ∈ [+ 1, –1] such that epochs from fear state are labeled as +1 while epochs for joy and neutral states are labeled as –1. Similarly, in case of joy state classification, samples for joy are assigned +1 label and rest of the the epochs from joy and neutral states as –1. As earlier explained, in order to perform emotional states classification we are working with 10 x 10 cross-validation strategy in which the epochs are distributed into ten partitions. Out of ten, nine partitions (i.e., 90% of the data) are considered for training purpose, whereas remaining one partition (i.e., 10% of the data) is considered for testing. The process is repeated for ten times with different dataset splits. Let’s consider the case for VI paradigm. We have total 30 trials in this paradigm as mentioned in Table 1. Now, for 10-fold cross-validation each subset out of 10 contains 3 trials. Now, in each run for cross validation, any one subset i.e. 3 trials are considered for testing data and remaining 9 subsets i.e. 27 trials are considered for training purpose.
Electrode selection using genetic algorithm
One of the major objectives of this work is to find out minimum number of electrodes that facilitate to achieve acceptable classification performance for emotion classification in case of multiple stimulus induced emotional states data. Here the total number of electrodes used to capture EEG data is n = 64. Now, we need to find small subset of n named as m, such that the classification performance should not be compromised significantly. Logically, m has the following relationship with n such that
Keeping in consideration all values of n, there can be υ set of all the possible combinations of m electrodes considered under n. Since n = 64, therefore υ expands very fast with respect to value of n, thus causing the exhaustive search impractical [32]. For this reason, this work has proposed to employ Genetic Algorithm to find out the search space as defined by υ.
In order to find which electrodes contribute significantly in classification of emotional states, the methodology based on Genetic Algorithm presented by Vezard et al. [32] has been used.. The genome comprised of as many variables as that of the number of electrodes. The fitness function is defined as follows:
The Genetic Algorithm searches for the genome which maximizes g(u).When the algorithm converges, the best genome is considered for further data analysis. The algorithm stops or terminates if any of the following conditions gets satisfied: The number of iterations exceeds 1000 Parents remain same for consecutive ten generations. The best evaluation remains same for 50 generations.
Steps for execution of genetic algorithm
Following are the steps for execution of Genetic Algorithm to find reduced set of EEG electrodes: Generate random population of chromosomes based on total number of electrodes used for EEG data recording Evaluate the fitness g(u) for each chromosome in the population Produce a new population by executing following steps until new population is obtained. Select parent chromosomes from the population according to their fitness values. The chromosome with better value has better chance for the selection. Making use of crossover probability pc, cross over the parents to form new offspring. Using mutation probability pm, mutate new offspring. Place new offspring in the newly generated population Use new population for a further run of the algorithm If any of the end conditions is satisfied, stop, and return the best solution in current population else go to step 2
In Fig. 4, the whole methodology for data analysis and electrode reduction using Genetic Algorithm has been elaborated. The figure presents approach for one paradigm within any of the one considered frequency bands delta, theta, alpha, beta, low gamma and high Gamma. Similar approach is applied for remaining scenarios as well. Figure 4 actually makes use of Fig. 3 that explains data analysis approach based on data from all 64 original electrodes. The process starts with EEG data acquisition as mentioned in the figure. Firstly, data from all 64 electrodes is considered (mentioned in blue box). Classification accuracy is evaluated for data from all 64 electrodes as already explained in previous section. The Genetic algorithm starts with initial random population and executes the stages (as mentioned in green box). The output of the algorithm consists of configurations with reduced number of electrodes. These configurations used as input for data analysis (as mentioned in pink box). For each configuration, classification accuracy is determined. The Genetic algorithm stops execution when any of the termination conditions is satisfied.

Block diagram explaining the whole Data Analysis.
Classification performance
Classification accuracies based on different frequency bands with EEG data from all 64 electrodes are mentioned in Table 2. We observe that mostly the high frequency bands of beta and gamma are producing better results independent of paradigm. Li and Lu [11] also discovered in one of their study that beta and gamma bands play significant role in emotion recognition while participants are watching audio video movie clips. Other studies [2, 45] are also in agreement that higher frequency bands play significant role in human emotional data classification but all of them have worked with single stimulus. Our findings also favour for higher frequency bands for better classification performance but since we are working on multiple stimuli-presentation paradigms, deviations are also observed. As most of the studies have worked on single stimulus, our study can have different new results as compared to others one. One of the exceptions here is for SI paradigm in which fear has achieved higher accuracy in alpha band instead of beta or gamma. Actually, when we study EEG based emotion recognition studies, deviations in observations and results are found in neuro-imaging research community as well. In contrast to Li and Lu [11], Ramirez et al. [12] examined the effects of sounds stimulation via EEG and found that larger values of alpha activity in the left frontal region are associated more with emotional conditions classification. As reported by Güntekin et al. [46], some previous studies explored spontaneous EEG modulation of frequency band (and specifically alpha band) after application of emotional paradigm. Taniguchi et al. [47] have found that in case of auditory stimuli, there is an imbalance between right and left hemisphere over the central area in the alpha band. Same as in our case, we are having good accuracy for sound-inducing paradigm within alpha band (8-13 Hz) for fear emotional state.
Mean classification accuracies for different frequency bands with all EEG channels considered for all four emotion – inducing paradigms
Mean classification accuracies for different frequency bands with all EEG channels considered for all four emotion – inducing paradigms
As mentioned earlier, we have performed data analysis by considering data for each stimuli presentation paradigm separately. As a result of execution of Genetic Algorithm, different configurations of electrodes are generated for multiple values of ‘m’ starting from 4 up to 58. Each iteration of the algorithm takes computational time from 3 to 14 hours depending upon the value of ‘m’. If any of the termination criteria of the algorithm is achieved, the algorithm stops. Large sets of genomes are generated. From these sets, 15 genomes / configuration with highest mean classification accuracies have been considered for further data analysis. The single genome represents the subset of electrodes such that the bits with value 1 represent electrodes that are to be included. EEG data from these electrodes goes through stages of pre-processing and feature extraction using CSP algorithm as mentioned in Fig. 4.
Firstly the classification accuracies obtained from best genomes for two out of four emotion-evoking paradigms have been illustrated in Figs. 5 and 6. For reference, the classification accuracy with complete set of electrodes is mentioned as dotted line. In this work, one of the objectives is to identify configurations with reduced number of electrodes, therefore we will consider more importantly values of m from 4 till 20. However, classification results for m > 20 electrodes are also presented. Figures 5 and 6 illustrate results for EI and VI paradigms respectively. While observing the figures, we notice that the median classification accuracy in all box plots gradually increases from 4 in both the scenarios under consideration. In Fig. 5, we observe that median for classification performance gradually increases from 4 to 9. Then sudden rise is observed at m = 10. After this, again we observe gradual increase in accuracy from 14 to 40. However, small variations can also be seen and at the end a little decline can be observed from 40 to 60. Now, for the case of VI paradigm in Fig. 6, almost similar pattern can be observed but the transitions are observed in different values of m as that of EI paradigm. In Fig. 6 the drastic increase in accuracy is observed at value 7. After that, we find minor variations in classification performance from 10 to 58. In both figures, we observe decrease in performance between 50 and 60. This shows that amongst the ten variables/electrodes that are not included, some variables are very noisy and hence responsible to deteriorate the prediction performance. In both figures, for values of m from 6 to 15, the accuracy obtained by the algorithm seems quite satisfactory rather it surpasses the accuracy as that of all the 64 electrodes. It motivates us to consider using Genetic Algorithm based approach in future EEG based smart applications.

Classification accuracies obtained on the training set with Genetic Algorithm on EI induced emotions data for different values of m. The dotted line represents the accuracy of 75.07% obtained using 64 initial variables for the CSP calculation (i.e. with all 64 electrodes).
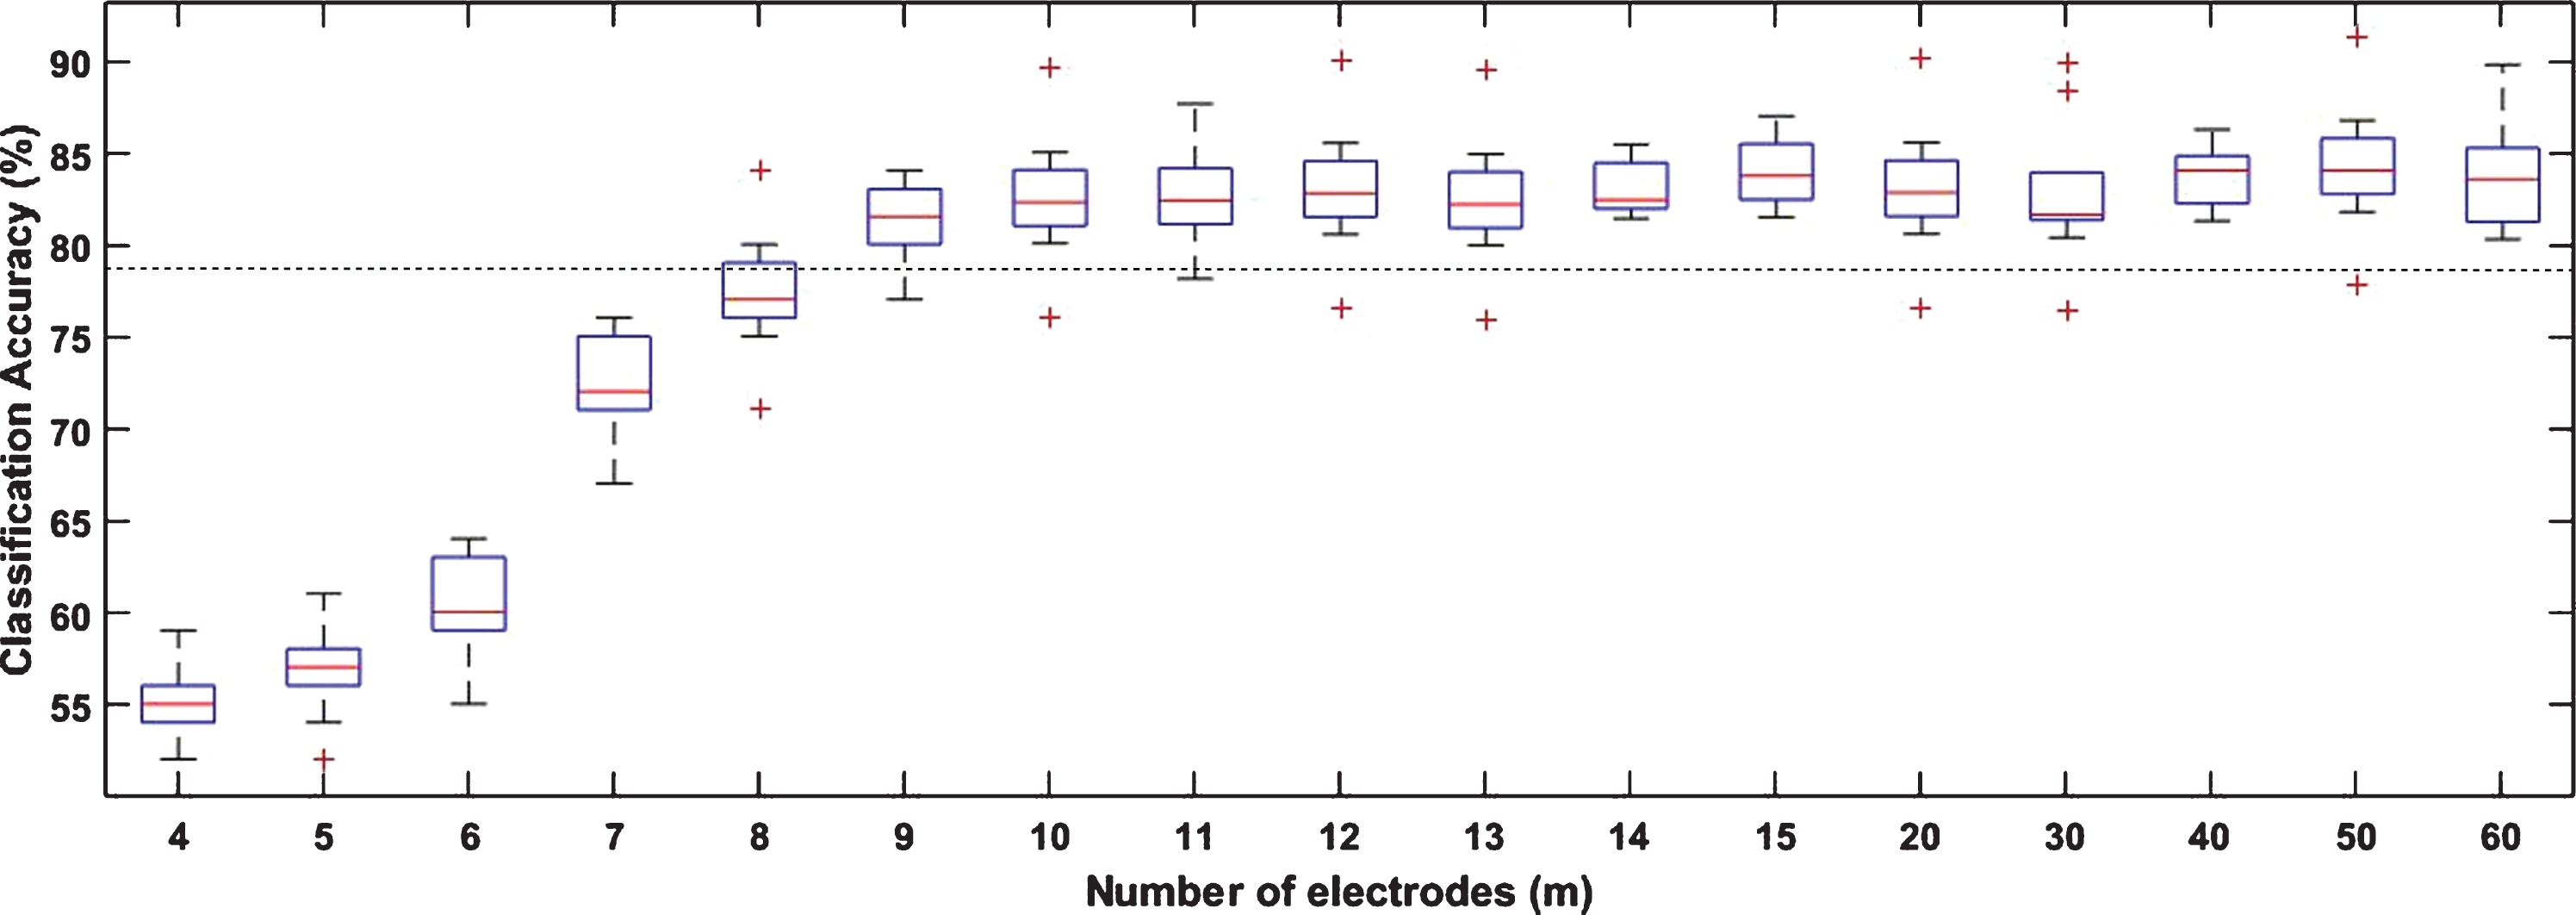
Classification accuracies obtained on the training set with Genetic Algorithm on videos-induced emotions data for different values of m. The dotted line represents the accuracy of 78.95% obtained using 64 initial variables for the CSP calculation (i.e. with all 64 electrodes).
Considering each value of m, we attempt to obtain twelve subsets that correspond to the best accuracy producing genome from Genetic Algorithm. In Figs. 7 and 8, different possibilities and combinations of these subsets of electrodes for multiple values of m are presented. The scale for showing frequency is presented through the colour bar. The bar is distributed in three different colour zones. Blue zone ranges from 1 to 4, green zone from 5 to 7 and brown zone ranging from 8 to 12. To understand it, let’s consider some examples. If an electrode colour is red, it means that the electrode appears in 10 genomes out of 12 best genomes selected. Similarly, if an electrode colour is orange, it tells that it appears in 8 out of 12 best genomes selected. If an electrode is found in each subset i.e. its frequency of appearance is 12 it will be assigned top most color in color bar.

a, b, c, d & e represent the number of selection of each electrode for EI induced emotions data in the 12 best genomes found by the Genetic Algorithm respectively for m = 4, 6, 9, 12 and 15.

a, b, c, d & e represent the number of selection of each electrode for videos-induced emotions data in the 12 best genomes found by the Genetic Algorithm respectively for m = 4, 6, 9, 12 and 15.
Figure 7(a) represents frequency for appearance as well as location of few of the selected electrodes in top twelve subsets found by the Genetic Algorithm for m having value 4 for EI induced emotions. Similarly Fig. 7 (b, c, d and e) represent frequencies of appearance of relevant electrodes for different values of m i.e. 6, 9, 12 and 15. While observing Fig. 7(a), we find that most of the electrodes have frequency of appearance in blue zone. Here, few of these electrodes are mentioned. These low values in frequencies of appearance reveal that several combinations or subsets of four electrodes can contribute for highest mean accuracy. As we move to next figures, with higher values of m, we notice that electrodes in higher frequencies zone for green and brown start appearing. Interestingly we observe that the electrodes that appear in green zone for m = 6 are found in brown zone for m = 9. Similarly, for m = 12 and 15 we can find same observations. This shows that any electrode which is mostly found for a specific value of m would also be found in subsets for higher values of m. This refers to a very important point since each run of the Genetic Algorithm is independent of other runs by considering the values of mutation rate and crossover probability. It shows that EEG data from electrodes selected by the algorithm contain useful and relevant information for the given emotion recognition task. Furthermore, for values of 6, 9, 12 and 15, the combination of electrodes selected based on majority voting seems highly stable and similar. In fact, most of the electrodes appear in brown zone representing their presence in all the best genomes for given value of m.
Now, we switch to Fig. 8 (a, b, c, d and e) that represent frequency of appearance of electrodes in best twelve genomes for videos-inducing scenario. Here again, we are observing similar findings as that of EI paradigm. From Fig. 8 (a) i.e. having m = 4, all the mentioned electrodes are in blue zone. Increasing values of m, we notice that same electrodes start appearing in higher zones of green and brown indicating that EEG data from electrodes selected by Genetic Algorithm contain useful and relevant information for the given emotion recognition task.
Now, in the next phase we are focused towards finding the common reduced electrode configuration that could produce good acceptable classification accuracies for all paradigms. For this purpose, we have again executed Genetic Algorithm but starting with only those electrodes that are selected for m = 15 as mentioned in Figs. 6(e) and 7(e). Moreover, we have obtained configurations for other two paradigms also. In total it contains following sixteen electrodes:
FC6,F7,P7,T7,O2,FC3,F4,C4,C6,P2,TP7,AF3,P8, AF7,P5,C1
By applying the genetic algorithm, we make an attempt to investigate if any common configuration with number of electrodes less than 16 could be found without significant degradation in classification performance. The results obtained after execution of Genetic Algorithm are elaborated in Table 3. As we have done earlier, the best genomes are selected for different values of m = 8, 9, 10, 12 and 14. The table lists configurations along with their respective mean classification accuracies. Here we observe that certain configurations have produced better results for EI criterion while for VI paradigm, the genome has not performed well. For example in case of m = 8, classification accuracy using last row configuration is 77% for EI but only 65% for VI paradigm. Similarly with m = 14 last row configuration achieved 81% accuracy for VI but 53% for EI. So, we need to find any genome or configuration where best compromise for all the paradigms could be achieved. These results are highlighted as bold rows with m = 9, 12 and 14. These findings reveal trade-off between number of electrodes and classification performance.
Common configuration selection for all paradigms
Common configuration selection for all paradigms
In EEG based studies, channels reduction is generally performed based on two criteria either to attain the best classification accuracy by eliminating redundant and noisy electrodes or to achieve the least number of electrodes keeping acceptable classification performance. Since classification accuracy is one of the most important parameters to evaluate performance of EEG based emotion recognition system, the first criterion is mostly implemented in electrodes reduction studies [13, 49]. In this work, three different configurations have been achieved consisting of 9, 12 and 14 electrodes independent of emotion evoking paradigm. Classification accuracies have been achieved in the range of 76–78, 75–77, 79–81, and 74–78% for EI, PI, VI and SI paradigms respectively. In a study conducted by Zhang et al. [13], they achieved 58.75% accuracy with 32 electrodes. However, after performing channel selection 57.67% accuracy was obtained with 12 electrodes only that showed just slight degradation. 83.99% accuracy has been achieved by Zheng et al. [2] with 62 electrodes, however 86.65% accuracy has been achieved from 12 channels. Wang et al. [50] conducted study for arithmetic task classification and achieved accuracies in similar range using configurations based on 14 and 4 electrodes. From the literature, we observe that reducing the electrodes less than 15 usually results in reduction of classification performance. But with studies having at least initial 25 EEG channels for data recording, reduction of electrodes mostly favours in improvement of classification performance as we achieved results in our case also. Narayanan et al. [51], Handiru et al. [48] and Bojana Mirkovic et al. [49] have concluded that the performance begins to drop significantly when number of channels are reduced up to 20 or 15 or lower.
In case of Genetic algorithm, firstly we have obtained results keeping both emotion inducing paradigms for emotional imagery and videos inducing separately in consideration as mentioned in Figs. 5 and 6. Here we have observed that smaller number of electrodes surpasses the trace from original 64 electrodes. Studies have elaborated that while recording data, EEG electrodes capture raw cortical signals that are generated from multiple independent sources [20, 23]. These recorded signals are then transformed into voltage signals by passing through different resistive devices in EEG electrodes at different cortical or scalp regions. These acquired voltage signals contain components from different cortical sources because of volume conduction. Furthermore for any given cognitive activity, not every EEG channel may provide relevant information. Rather, electrodes may generate overlapping redundant information [20–23]. This redundancy and overlapping information may degrade the classifier performance significantly. Sometimes, it may cause additional computation burden due to processing of same signal component multiple times in different electrodes [23]. Keeping these aspects in consideration, the graphs show that fewer number of electrodes in both the paradigms have outperformed the performance as that of original 64 electrodes.
Table 4 lists studies that are targeted towards electrodes selection for not only emotion recognition but also for other applications. As we discussed earlier, most of the studies have higher classification performance in case of reduced number of electrodes except for those studies where configuration consists of electrodes less than 10. In one of the studies mentioned, the author Zheng et al. [2] has been successful to achieve better results even for 4 and 6 electrodes. But in this case, electrode configuration is subject-dependent while other studies along with ours are targeted towards subject-independent common configuration. In last row, we have mentioned our own results where we find classification accuracy ranging from 76–78, 75–77, 79–81, and 74–78% for EI, PI, VI and SI paradigms respectively from same set of electrodes. From other studies in the table, we observe that no study has been conducted with multiple emotion-evoking paradigms as we have done in this work. Since, we are working on different multiple paradigms, exact comparison with other studies is not possible, but having mean classification accuracy above 75% for all considered paradigms shows the method based on CSP, LDA and Genetic Algorithm is able to produce good comparable results with other studies. Few limitations are associated with the study. Only three emotional states of fear, neutral and joy are considered in this work. In future, other emotional states like anger, pride can be considered to further enhance the results.
Comparison of Existing studies targeting towards electrodes selection with author’s work
Comparison of Existing studies targeting towards electrodes selection with author’s work
This study takes the step towards emotion recognition from EEG data while emotions are evoked with multiple stimuli. A method has been used based on iterative Genetic Algorithm in combination with majority voting to obtain minimum number of EEG electrodes keeping in consideration minimized loss of classification performance. With respect to classification performance in each of the considered paradigm, we didn’t come to single conclusion. The results show that depending upon the emotional state, the best suitable paradigm could be identified. For example, fear emotional state is best classified in case of sounds induced paradigm. While for joy state, emotional imagery has performed best. Concerning the configuration with lesser number of electrodes, we are able to achieve stimuli dependent configuration that have produced comparable results with respect to original number of electrodes for all the four paradigms. Compared to previous work, this is the first EEG study to assess neural correlates of human emotional states making use of four different stimuli-presentation scenarios. The results obtained are comparable with recent studies. Stimulus independent configurations with lesser number of electrodes lead towards low computational complexity as well as reduced set up time for future EEG based smart systems for emotions recognition.
Footnotes
Acknowledgment
This work is funded by Higher Education Commission (HEC), Pakistan and is being conducted and supervised under the ‘Intelligent Systems and Robotics’ research group at Computer Science (CS) Department, Bahria University, Karachi, Pakistan. The authors are highly grateful for cooperation from Prof. Dr. Benjamin Blankertz and Neurotechnology Group, Technische Universität Berlin, Germany for conducting the experiments.