
Abstract
Today, due to increasing dependence on the internet, the tendency to make smart and the Internet of things (IoT), has risen. Also, detecting attacks, and malicious activity as well as anomalies on the internet networks, and preventing them from different layers is a necessity. In this method, a new hybrid model of IWC clustering and Random Forest methods are introduced to identify normal and abnormal conditions. It also shows unauthorized access and attacks to different layers of the Internet of Things, especially the application layer. The IWC is a clustering and improved model of the k-means method. After being tested, evaluated, and compared with previous methods, the proposed model indicates that identifying anomalies in, its data has been efficient and useful. Unlabeled data from the Intel data set IBRL is used to cluster its input data. The NSL-KDD data set is also used in the proposed method to select the best classification and identify attacks on the network.
Keywords
Introduction
Today, the internet of things (IoT) is widely used for industry, health care services, individual, public domain, smart cities, and universities. The IoT is consists of several devices and sensors that are linked to the internet. Since the data-sharing rate is very high, it has become a challenging issue. This data can be compromised for a variety of reasons, such as attacks or errors; [1]. The most important disadvantage of this system is its false-positive rate. One of the main problems with current IDS technology is false alarms or ignoring suspicious items, especially in IoT systems. The detection speed is reduced due to irrelevant and additional features in the data set [2]. IoT, like other consumption technologies, has been designed without regarding the security, and this is now a major obstacle to the wider use of IoT services and networks [3]. Security mechanisms for intrusion detection are used to manage security breaches [4], which is a descriptor in various layers of IoT [38]. Based on KDD 99 analysis [4] and its next version, the malicious behavior or the same basic attacks in network intrusion are categorized into four basic branches as follows. Attacks are divided into four categories. DOS is an attack that attacks resources. R2 L is an attack aimed at controlling a device remotely and locally. U2 R is an attack that wants to change the authority from a normal user to a manager. Probe refers to the scanning activity that attacks to gather information about a target before attacking it [5, 6]. Signature-based IDSs generally outperform in detecting the previous attacks, but they are ineffective in encountering the multi-form and unknown attacks [7]. There is no predetermined pattern. Due to various devices used in the IoT network [8].
The main purpose of this article is to provide an intelligent, reliable and high-performance system that can automatically detect all attacks. Especially R2 L and U2 R in network and application layer. In this study, the successful identification of attacks with two-tier Random Forest classification in the NSL-KDD database, an attempt has been made to examine a combination of IWC clustering and the Random Forest method to detect normal and abnormal states and to identify unauthorized access and attacks on various IoT layers, especially the application layer.
The first step is to reduce the dimension, or in other words, reduce the number of features by using feature extraction for the basis of the MI (mutual information) method in the NSL-KDD data set as well as pre-processing in the Intel data set. Also, a combination of the classification algorithm is used to evaluate this feature set. Then, a reduction method is used to increase the efficiency and decrease the calculation time, increase the accuracy, and prevent anomalies in different layers.
The proposed model has the following features: Deep understanding of IoT and how it works. Deep understanding of IWC clustering and Random forest anomaly detection methods. A high rate of attack detection. Significant reduction in false positive and false negative error. FP, FN.
From the features of the NSL_KDD data set, only 21 features have been selected. The confusion matrix has been used as the most reliable method for evaluation. In the proposed model, the combination of Decision tree and Random Forest classification algorithms is used as one of the most efficient classification methods in the structure of the Internet of Things. This model is called IWCR, which means a combination of inverse weighted clustering and Random Forest.
An unlabeled data set from Intel Labs called IBRL was used for IWC clustering. The next part explains the related works. In the third part, we will explain the proposed model and the fourth part is the model evaluation. The fifth section is the final section and is related to the future of IoT and research topics. According to Fig. 1 that explains different parts of its network.

IoT architecture and drawing different layers [9].
Today, detection and prevention models generally use statistical methods [10] such as Markov Model (Hmm), Bayes method [11], package analysis [12], signal processing [13], and distance measurements [14]. The application layer uses different algorithms and methods to process data to detect intrusion like machine learning [15]. In this method, a free dataset containing more than 2 million records are collected by 54 sensors every 30 seconds. This method is important in detecting new cases [16].
It showed that their methods worked very well against unknown attacks [17]. In this method, the neural model of the automatic regulatory system (SOM) is also used in the normal activity filter. But false-positive rate detection in this method is very high [18]. This method proposes the forest algorithm and the k-means clustering method. In this model, normal and destructive network behavior is investigated and modeled. The inconsistent method presented in [19] balances the distance and the density of intrusion detection clusters. Toosi et.al [20] proposed a hybrid optimal random forest method with the k-means method that investigated and demonstrated normal and abnormal behaviors in the network. Osanaiye [7] introduced a multi-filter selection method based on the set which, by using four filters method, detects the DOS attacks in the cloud environment and provides a better selection compared to the NSL-KDD dataset [21]. Provided attack taxonomy for cloud services and proposed intrusion detection based on the cloud. [22] Proposed two-faced IDS that select an optimal feature on the selected algorithm. Their method was evaluated using three sets of measurement information [23] presented a multi-model and industrial consistency IDS based on the Hayden Markov Model which filters attacks and errors. [24] The K-means method was used to identify attacks and cluster attacks DOS, PROB, R2L, and U2R. In this method, three clusters were used. DOS, PROB attacks are easy to detect. The problem is detecting R2l and U2R attacks. Therefore, it uses the centroid production method. So clustering is done based on the distance between records and the similarity between records [25]. The number of clusters is decisive, in other words, the algorithm can create a centroid. If we have two clusters, in other words, the input data consists of two clusters, k = 2. K starts clustering data randomly. And this clustering is done based on the similarity between the records [25–27]. The K-means clustering problems said that the choice of centroids may not be correct, in other words, it may not be accurate at the end [28]. To solve this problem in this method, the IWC method was proposed. This method was proposed by the production of centroid to solve the problem of the K-means method, its improved method, IWC has been proposed. This method is performed again by producing the exact centroid after the end of the k-means algorithm. That is, first the exact centroid of each cluster and the distance between each data with the previous centroids are calculated. This method is very useful for clustering IoT data. It is run again after the end of the k-means algorithm [29, 30]. One common method for data classification is the decision tree method (DT), which is used for forecasting. In other words, the DT method is the result of the IWC clustering operation, which includes two categories of normal and abnormal. For the c4.5 method to be applied, we must have two categories of data: train data and test data. In other words, unlabeled test data is used to test the decision tree [4, 23].
According to the latest research conducted in IoT environments to identify anomalies and weaknesses of the network, compared to other classification methods, simple systems such as Decision Trees and Random Forests have more positive results than complex systems. In multi-class method, which is based on several classes, Random Forest is used for cyber attacks on the Internet [31]. According to Table 1, it is possible to compare the previous methods and their percentage of ACC.
Comparing ACC between previous studies in Iot systems
Comparing ACC between previous studies in Iot systems
In this proposed method, redundant and unrelated features are excluded by using two Techniques of Pearson correlation feature selection and mutual information. After the method of reducing the number of features, which will be explained in Section 3.1. The IBRL data set is clustered by the optimal K-means method and the train and test data are divided. The description of the IWC method will be described in full 3.2, and then the training data will be tested to select the best classifications. After performing experiments and using different classifications, the Random Forest method is used as the classifier. The name of our method is IWCR. It means IWC and Random forest.
In the proposed method, we also present a model with the aim of identifying anomalies between IoT devices in the application layer. Therefore, we design a model that receives data as input from IoT devices and then predicts whether the data is normal or abnormal before entering the application layer [17]. Because tagged data in the IoT det system shows that it is difficult to influence, we used the unlabeled IBRL dataset. Because clustering is based on similarities between records, the data are divided into training and test groups. In the NSL-KDD data set, using the MI method, the number of properties is reduced to 21, and after two-stage combination classification of DT, RF to identify R2L and U2R attacks and use normal, abnormal detection and increase its detection efficiency. And diagnosis is compared with other methods. To ensure the most effective classification method, we use a combination of the IWCR method to identify anomalies in IoT systems. In the above method, among 11 features, 4 features are considered, including temperature, humidity, voltage and light, which are remarkable to the previous method, which focused on only two features.
Pearson linear correlation feature and Mutual-information
Mutual information is used for feature selection. Irrelevant and additional features are set aside. Formula One is used for investigation. First, by using the common entropy formula that follows, we calculate the reciprocal information of each feature with the target features. The concept of common information is shown by I(Y, X). If two features of X, Y be in the close relation, the value of [34].
One of the good and useful methods in improving the selection of features is the use of mutual information method. In other words, MI is a method for information theory that is used to measure the relationship of attributes and shows how much information is shared between attributes. Irrelevant attributes should be removed because it causes incorrect classification will be. What makes it difficult to cssify or reduce the DR error rate in intrusion detection data is noisy and irrelevant data. It aims is to minimize the redundancy between the selected attributes.
The improved IWC method is the k-means method, which performs the best clustering based on the similarity between the records after the end of clustering by the k-means method by producing new centroids and averaging.
Because the clusters are not labeled, a method must be selected to label the centers. The centers in this method are obtained using the following formulas.
Where e.g., and Tkn are as below
Consider the following performance function in IWC [28]:
The k-means clustering method is performed by averaging between clustering data. In the IWC method, clustering is done by re-averaging after the end of the algorithm by creating new centroids. m
k
is re-averaging. J
I
is Euclidean distance.
M1 is calculated, because it is the closest point to both values of the data, is therefore transmitted in the first iteration. And m2 is also moved to a location between two points. And this continues until complete recovery. Formula 9 [6, 35].
First calculates m1
According to Fig. 2, the method IWC is made from the method the k-means and eliminates the disadvantages of the previous method of performing the method. This continues until the clusters and centroids are fixed. When the k-means algorithm is stopped, the IWC recalculates were the exact centroid of each cluster and the distance of each data from the centroid of the previous step, and thus the algorithm is run and improved again. And as shown in Fig. 2, clustering is done accurately and without error [28, 35].
Accuracy of clustering for two clusters.
A simple yet powerful machine learning algorithm is called the Random forest among the methods, which can be used and implemented in both classification and regression. In this method, it is not just a single tree, in other words, we have several growing trees that are divided based on characteristics and similarities. In this method, the forest that has the most demand or votes is selected. In the regression method, results can be obtained through averaging. Random forest works in 4 parts. First of all, samples from the data set are selected randomly. Next, a decision tree is generated for each sample. From each sample, a prediction is made by each decision tree. A vote is performed between all the decisions. The prediction with the highest is vote is the outcome.
Implementation of random forest of application layer
In this paper, this algorithm is created and propagated for the first time from several trees instead of a single tree. Normal data or abnormal data determine the classification and classification of each tree. The Random forest chooses the category that has the most support. (Higher in number) over others in the forest. According to Fig. 3, we first read the data set using the built-in read method. Next, we split the data into two groups. One group is for a train and the other is for tests. 80 percent of the sample is a train set and 20 percent of the data is test set. The data is trained with a Random forest Classifier and later. First, the accuracy of the method is checked and the test result is determined. Using Random Forest, we have received the best accuracy among all the other algorithms used.

Random forest diagram.
According to the studies on the data in the research method, it was concluded that according to the following forms and comparison between the methods, the Random Forest, we have received the best accuracy among all the other algorithms used. As shown in Fig. 4 the comparison between the classification methods and the comparison shows the accuracy of the classification of the data. The method has the greatest accuracy among the different classification methods of Random forest method. According to Table 2 data is labeled and compared to check the accuracy of the classifications. And the random forest method is chosen as the best method. Combining the optimization and classification method will help to increase the error detection rate significantly.

Comparing the accuracy of classifications according to the input data in NSL-KDD.
Comparing precision and recall in different classifications methods
In the implementation section, it is about how to implement the proposed method for detecting anomalies in the IoT application layer and IoT systems. Matlab 2018a software was used to implement this model. The implementation process consists of three parts 1- preprocessing data to select Sthe best features from characteristics will be selected. 2- Using the IWC clustering method to increase accuracy. 3- Classification and data testing of the Random forest method. The collected data in the Intel laboratory are first in the pre-processing stage and then after clustering, it is converted into two groups of normal and abnormal. Then the accuracy of the classification is examined also a variety of rare attacks. Before entering the application layer, it is investigated and predicted. Matlab medium is used for implementation.
Data sets description
In method uses two data sets, NSL_KDD and IBRL from Intel Lab. The IBRL dataset has 11 features, of which 4 properties are taken to classify the sample as normal and abnormal. After running the IWC algorithm on WSN input data from the Intel Labs dataset, the entire data were divided into two categories, including Class 1 and Class 2 for labeling data. The model aims to identify an anomaly in IoT networks before entering the application layer. In other words, we want to detect and reduce the emanating data exchanged between IoT devices, which can also be by a cloud or fog layer. Or “abnormal” predict. This laboratory contains 54 sensors. Each sensor measures and gathers 4 attributes includes Temperature, humidity, light intensity, and voltage. The data gathered in the laboratory by sensors every 31s. This data set is free. In the NSL-KDD dataset has 41 features. First, with MI we select the best feature and reduce features from 41 to 21.
Experimental results in IBRL data set
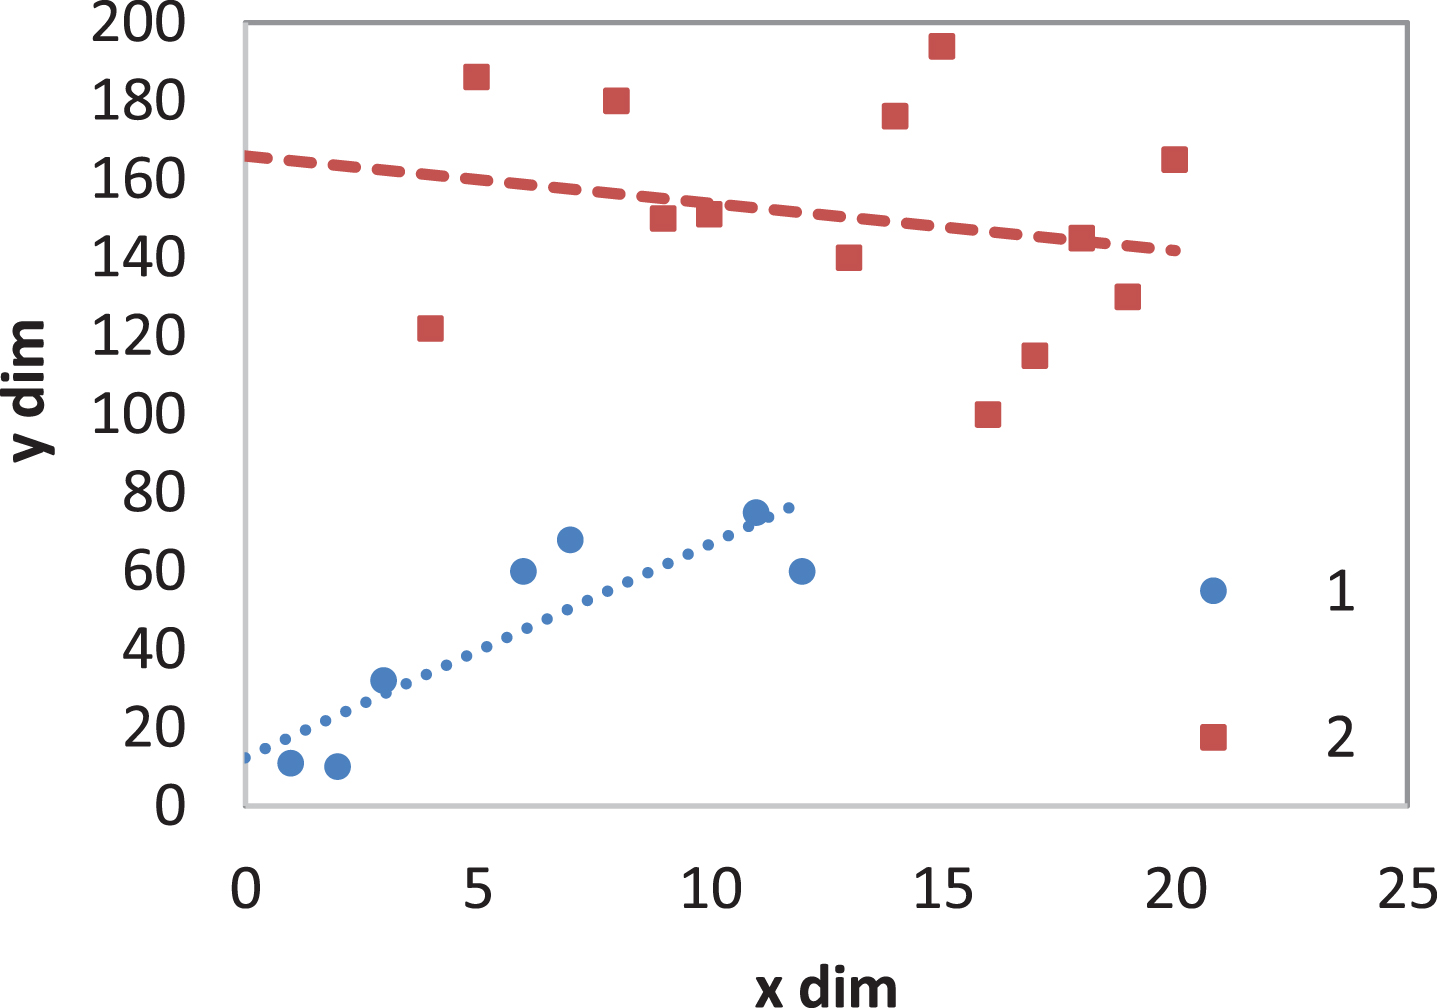
According to the Intel Lab datset described in the previous sections, which have about two million records gathered by 54 sensors in various locations, after pre-processing we consider the number of features to be 4. 7072 random records are selected from among the records. 524 records with anomalous mode are added to them, so the total number of records is 7617. This data is divided into two groups. Train and test by the cross k-fold method. Training data is used to construct a random forest tree and the accuracy of the method is checked by test data. In other words, we have k = 2. We have two clusters that contain normal and abnormal data. Which is identified by numbers 1 and 2? After clustering, we have three columns, two columns for attributes and one is Cluster Id.
In Table 2 describes the precision, recall, and the CA (accuracy) between classifications according to Fig. 4, in which CA indicates the classification accuracy. The precision of the correct positive ratio of TP among the samples classified as positive. Recall shows the correct positive ratio among all positive samples. The precision of the correct positive ratio of TP among the samples classified as positive. Recall shows the correct positive ratio among all positive samples. According to the latest studies and current studies an accuracy = 0.996, precision = 0.99 and recall = 0.99l and comparison with the above article shows that the Random Forest method or a combination of Decision Tree method or Random Forest can be successful methods for detecting anomalies in the Internet of Things.
When the confusion matrix is created, different classification on methods are evaluated and compared, and conditions such as TPR, FPR, AC, and the number of correct answers and the number of incorrect answers are obtained. As shown in Table 3, these methods have improved the accuracy and rate of positive and negative error detection. TPR is true a positive rate and FPR is a false positive rate [36] in the proposed method. The accuracy of this method is 0.994.
Comparing accuracy between classification methods in the confusion matrix
Comparing accuracy between classification methods in the confusion matrix
According to Table 4, training data are classified by Random Forest method and normal and abnormal data are now tested for reviewing the accuracy of the unlabeled test data using improved Random Forest method and then compared with the results tagged previously clustered. The accuracy of the method is shown in the results. In predicting normal cases. As you read, TP, TN, FP, FN in this part have considered. The rate of prediction anomalies and abnormalie has improved that shown the accuracy of this method. Confusion matrix is the best way to show these accuracies.
Prediction results in confusion Matrix at IBRL in IWCR hybrid method
Where accuracy, detection rate, and the false rate will be calculated as below [37]:
In Table 5, the accuracy and error detection and error prediction rate in both data set in the Random Forest method, its combination with the IWC method is shown.
Detection rate and false rate in NSL-KDD and IBRL data sets
In Table 6, the comparison between this paper method and previous studies shows and evaluates the rate of error detection in the research method which indicates an improvement of the proposed method. In this method accuracy almost is same as another IWC combination method, but the rate of detection rate and false rate have improved. The detection rate is 99.8 and false rate is 0.212.
Comparing between different methods used IWC
These tests have been implemented in MATLAB 2018a environment. As mentioned in previous articles, the NSL-KDD data set has been used instead of the KDD99 version due to some bug fixes and incompleteness. The NSL_KDD data set has all the attacks and sub-attacks including DOS, PROB, R2L, U2R, and normal mode. This research aims to identify rare and similar attacks and normal and reduce the rate of misidentification of false positives or negatives, so our set of data that contains more than 26148 records, which includes two sets of train and train+and a set is a test. In this research, due to feature extraction and decline of the features from 41 to 21, this work saves computational load and cost. The purpose is to label the input data with two groups include normal and abnormal. If the data is normal, it re-enters another classification such as Random forest to be re-examined and labeled. The accuracy of clustering is very significant due to the use of new centroids and the development of the k-means method and has reduced the possibility of error. k = 3, two training classes, and one test class are considered. This method is almost the best method of dividing training and testing data because all samples are considered randomly by averaging at each stage so no sample is left untrained. In the pre-processing stage, the system log is created and the training data is prepared for classification. The confusion matrix is for describing detection and performance [38].
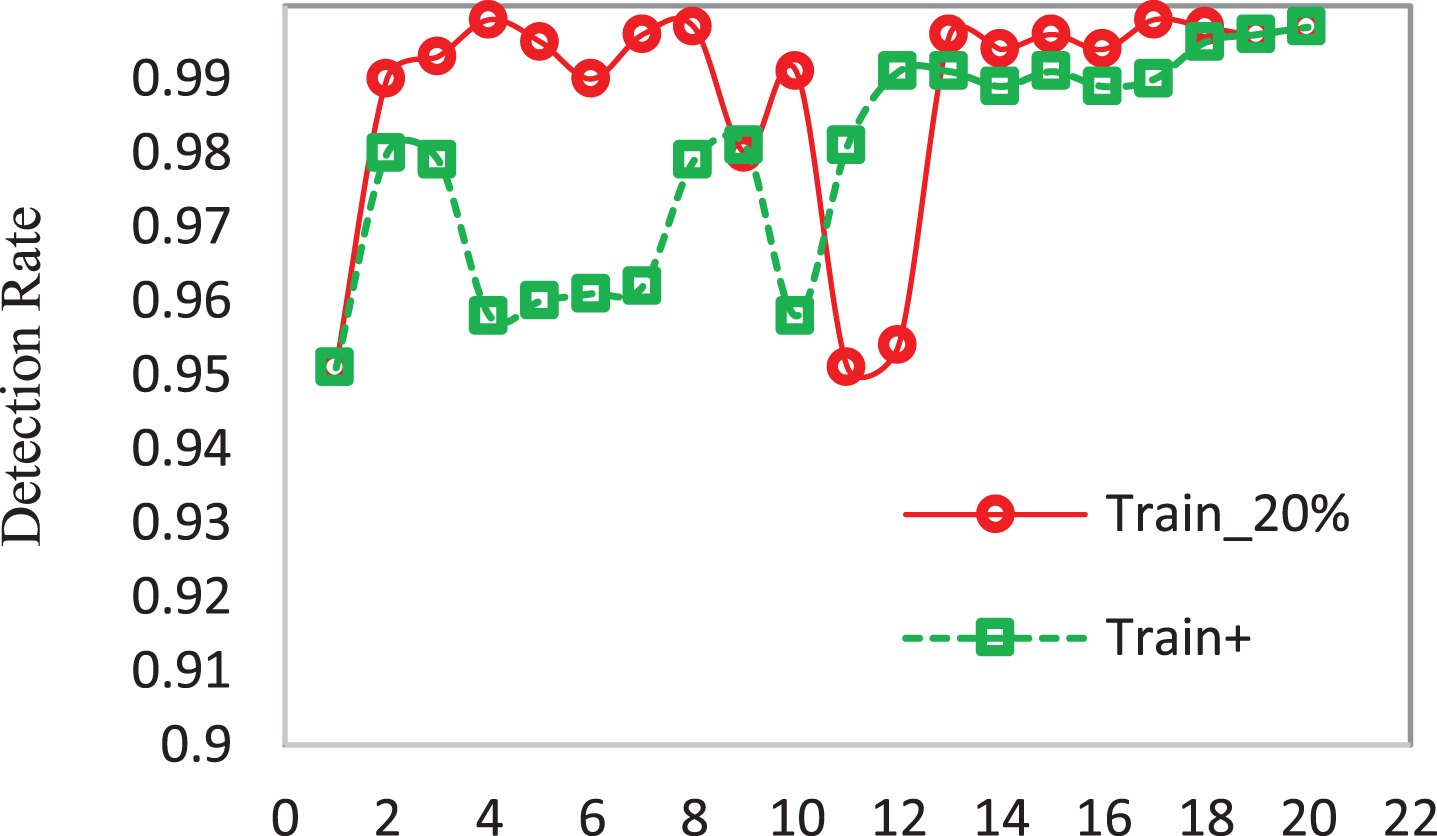
As shown in Fig. 5, the data includes train, train+data. The number of attributes per record includes 21 the data being trained with four predefined attacks, and now new attacks are being applied to the system to measure its detection rate. These attacks are planned in the NSL-KDD data set. The maximum error detection rate in the previous methods is 0.83, which is difficult to identify and diagnose rare cases. As shown in Fig. 5, the detection rate and the false positive rate in this method has reached a significant value of 0.998.

Detection Rate in NSL-DDL previous method.
Detection Rate in NSL-DDL in the proposed method.
According to Table 7, the aim is to identify attacks and error detection rates, as well as using a confusion matrix to reduce the false rate between approximately 28350 records, which is the number of normal 10180 records as well. In addition, the number of Probe 3840 records and the number of DOS is 8930 and the number U2R is 13 and R2L is 350. They are classified and labeled after the error rate for U2R and R2L data, respectively.
Detection Rate, False Rate between methods in the first level
According to Table 8, this shows the prediction accuracy and error rate for different attacks at the application layer. In other words, after clustering, the data were classified into two stages: training data and test data. Test data without lable is to check, accurately test, and identify cases similar to the normal case of an attack. As you can see, the attack detection rates in this study for U2R and R2L attacks are 75.6 and 51.3, respectively.
The attack detection rate in the proposed method compared to previous methods
Table 9 indicates the diagnosis of false rate and rate detection compared to previous methods that indicate false rate = 2.21 and detection rate = 96.30. As you read, after train+the detection rate and false rate are in order 99.8 and 2.21 that in comparing to previous method have improved.
Comparison between methods in the second level to assess the False Rate
According to Table 10, this table is considered and compared with the last researches by this study in the ACC. The result shows that the ACC in the current study is 99.6 that has been one of the most important aims.
Comparing ACC between previous studies in Iot systems
In this study, According to the results obtained, it can be said that the use of the Random Forest method to identify and detect attacks, especially attacks R2L and U2R and even other attacks has been very successful. On the other hand, by combining this method with the reverse clustering method, it shows a significant increase in anomaly detection in different layers of the Internet of Things. Examination of laboratory results on 4 features of Intel laboratory data and the above combined method shows work innovation compared to other methods. The false alarm rate is one of the goals of this IWCR hybrid model, which was studied in two data sets, NSL_KDD and IRBS. False Rate = 2.21 and ACC = 99.6. Furthermore, after train+, the detection rate and false rate are in order 99.8 and 2.21 and indicates an improvement in this method compared to other methods. The rate of attack detection in this study for U2R and R2L attacks is in order 75.6 and 51.3. It is suggested that this method be analyzed in the real world and outside the laboratory environment. In addition, for future study, the detection rate for DoS and DDoS attacks in application layer needs to improve. Also the results of this research can be examined in cloudy or foggy environments.