
Abstract
This study proposes the novel method of lithium-ion battery state of health (SoH) estimation and remaining useful life (RUL) prediction to ensure the safety and reliability of the energy storage system. A fuzzy brain emotional learning neural network (FBELNN) is employed to estimate SoH and a recurrent cerebellar model neural network (RCMNN) is used for the RUL prediction. The inputs of FBELNN are extracted features from the monitoring curve of the constant voltage and current, because the lithium-ion battery is seldom completely discharged and the discharging situation in actual operating process is complex. The FBELNN learns the battery aging features that are extracted and selected by discrete wavelet transform and principal component analysis, respectively. The SoH estimation results from the FBELNN are accurate due to the special structure and parameters adaptive laws. The RCMNN and online training again can improve the performance of RUL prediction, because recurrent units can capture the dynamic features. Experimental data are performed by using NASA Prognostics Center of Excellence battery datasets to verify the effectiveness of the proposed method. The results show that the root mean square error of SoH estimation is smaller by the FBELNN and the prediction accuracy of RUL is higher by RCMNN under the different starting points.
Keywords
Introduction
Hybrid electric vehicles (HEV) and microgrids were developed rapidly and they can promote the adoption of renewable energy sources with global energy crisis and global climate change [1]. Lithium-ion batteries have been played an important role in many electrification fields such as HEV, microgrids, and other consumer electronics, due to their high energy density, long cycle life and low self-discharge rate [2]. In actual work, the lithium-ion batteries are regarded as complex chemical and physical structure. The electrode material will be changed with accumulated operation, resulting in the capacity decrease and internal resistance increase [3]. On the one hand, state of health (SoH) is general defined as a percentage that reflects capacity decrease. When the capacity of the lithium-ion battery has decreased to 70% or 80% of the rated capacity, the end of life (EoL) of the battery also reaches in different applied scenario [4]. The remaining useful life (RUL) is general defined as the number of cycle from present time to the EoL, it is the measure of reflecting the aging conditions of the battery [5]. Hence, SoH estimation and RUL prediction for the lithium-ion battery play the important roles in the safety and economic analysis of the energy storage system (ESS) [6].
In recent years, extensive researches on SoH estimation and RUL prediction have been conducted. Many methods have been studied to SoH estimation that can be generally divided into three categories: electrochemical/physical measurement, model-based method and data-driven method [7]. There are two main methods of the approaches of RUL prediction: data-driven method and model-based method [8]. The methods of SoH estimation and RUL prediction are together introduced in this section. The coulomb counting method is easily implemented by calculating discharged battery capacity. This method is one of the most accurate measurement, but it is time-consuming and has only limited application [9]. Electrochemical impedance spectroscopy (EIS) is adopted for extracting the internal parameters that show varying aging processes of the battery [10]. But the applications of EIS are restricted for size limitations, complex experimental procedures and high cost. The model-based methods generally combine mathematical models with filtering techniques to establish the model of battery degradation by specifically designed experiments and cycling data [11]. Saxena et al. found the empirical model to establish the relationship between SoH with the number of cycle under different state of charge (SoC) [12]. Singh et al. presented the electrochemistry model to determine the initial parameters of the semi-empirical model that is used to estimate the SoH [13]. Zhang et al. used an improved particle filter to establish an empirical model for RUL prediction, and the Markov Chain Monte Carlo technique was used to improve the problem of inaccurate RUL prediction that caused by the issue of particle impoverishment [14]. Qiu et al. proposed the multiscale hybrid Kalman filter to estimate SoC and SoH, and RUL prediction is achieved by cuckoo search particle filter. The effect of cuckoo search algorithm is that transfer the particles to the maximum likelihood region [15]. But the application of model-based methods is affected by the high quality of experiment data, reliable equivalent model and high computational complexity [16]. Data-driven methods are a promising route of SoH estimation and RUL prediction that regard the lithium-ion battery as a black box. It is less complex than high-level empirical model and only depends on enough degradation data [17]. However, the main weakness of these methods is that the experiments usually take several months to obtain complete data. Li et al. presented a novel hybrid Elman and long short-term memory method for RUL prediction by combining the empirical model decomposition [18]. Dong et al. utilized the adaptive extended Kalman filter to predict RUL that combines with Brownian motion model to adjust the parameters under different aging speeds and this proposed method can ensure the flexibility, reliability of RUL prediction results [19]. But these methods used the known capacities at the past cycles and have not discussed how to get SoH information. Guo et al. presented SoH estimation of relevance vector machine, in which the input features are extracted by the rational analysis and principal component analysis (PCA) under charging conditions [20]. Wei et al. proposed a novel method for SoH estimation and RUL prediction, that is established by SVR to simulate the lithium-ion battery aging; and they introduced an impedance aging parameter model to overcome estimation errors [21].
The cerebellar model neural network (CMNN) is an imitation of the cerebellum learning structure and is regarded as a non-fully connected perceptron-like associative memory network with overlapping receptive-fields [22]. The CMNN has the structure of multiple layers and local learning characteristics, and is widely used in the control of complex dynamic systems with its advantages of simple computation, good generalization capability and fast learning speed [23]. One disadvantage is that the output of the CMNN is constant within each quantized state and the derivative information is not preserved [24]. Hence, the delayed recurrent units are introduced into the recurrent CMNN (RCMNN) of the association memory space and the weight memory space to capture the dynamic features in this study. Lin et al. proposed a novel adaptive filter using the RCMNN to a nonlinear channel equalization system. The results demonstrate that the performance of the proposed filter is better than the adaptive fuzzy filter or the neural fuzzy filter [25]. Guan et al. used genetic particle swarm optimization to seek for the optimal learning rates of the RCMNN so that it has well performance in trajectory tracking due to the dynamic characteristics of the recurrent units. The proposed control method is reliable that tested by comparing with other control schemes [26]. Huynh et al. designed a new intelligent RCMNN that have a dynamic deletion threshold for retaining or deleting the hypercubes automatically to improve the structure of the RCMNN [27]. This method can get well tracking performance for uncertain nonlinear systems under external disturbances. Since, the RCMNN has recurrent units in association memory space and weight memory space, it can improve the performance of RUL prediction by learning the nonlinear aging trend of lithium-ion battery in this study.
On the basis of emotional stimuli theory, the brain emotional learning neural network (BELNN) was created by Moren and Balkenius in 2001 [28]. The BELNN has two parts: the amygdala, which is involved in emotional judgment, and the orbitofrontal cortex corresponds to emotional control; these two parts affect each other, and they determine the output of the BELNN [29]. The BELNN have features of fast self-learning, simple implementation and good robustness so it is applied in power systems, motor drives, nonlinear systems and image analysis [29–32]. Lin et al. proposed a novel self-organizing fuzzy BELNN (FBELNN) to apply in a biped robot, and the self-organization algorithm changes the sensory cortex space to give the most efficient structure [30]. Zhao et al. proposed wavelet FBELNN to apply in chaotic system and medical image analyzing; the proposed method can get better performance in approximation ability or accuracy than other methods [31, 32]. The FBELNN can fast and accurately get satisfactory results due to the special structure and parameters adaptive laws.
In this study, a data-driven method is proposed using the FBELNN and RCMNN for SoH estimation and RUL prediction. The proposed method uses discrete wavelet transform (DWT) and PCA to extract features from the part curve of charging voltage and current. These features are the input of FBELNN for SoH estimation, and then the results of SoH estimation are the input of RCMNN for RUL prediction. The public datasets of NASA Prognostics Center of Excellence (PCoE) are verified to illustrate the effectiveness of the proposed method [33].
The remainder of this paper is organized as follows. The datasets analysis and the method of feature extraction are presented in Section 2. In Section 3, the structure of FBELNN and RCMNN are introduced. The processes and results of SoH estimation and RUL prediction are detailed in Section 4. Conclusions are drawn in the final section.
Public datasets analysis and features extraction
In this section, the datasets of PCoE are introduced for showing the curve of voltage and current and the phenomenon of capacity degradation. The processes of feature extraction and selection are illustrated in section 2.2.
Battery aging datasets of PCoE
A set of three lithium-ion batteries labeled #5, #6 and #7 are collected from PCoE. During the processes of cycling test, the parameters and conditions of the lithium-ion batteries are presented in Table 1.
The parameters and conditions of the lithium-ion batteries
The parameters and conditions of the lithium-ion batteries
As shown in Fig. 1, the lithium-ion batteries undergo three different operational phases including constant current (CC) charge, constant voltage (CV) charge, CC discharge and impedance measurement. At the phase of CC charge, the charging current was 1.5 A until the voltage reached to 4.2 V, and then the charging current will drop to 20 mA at the phase of CV charge phase. The discharging current was 2A until the lithium-ion batteries voltage reached to 2.7 V, 2.5 V and 2.2 V for #5, #6 and #7, respectively.
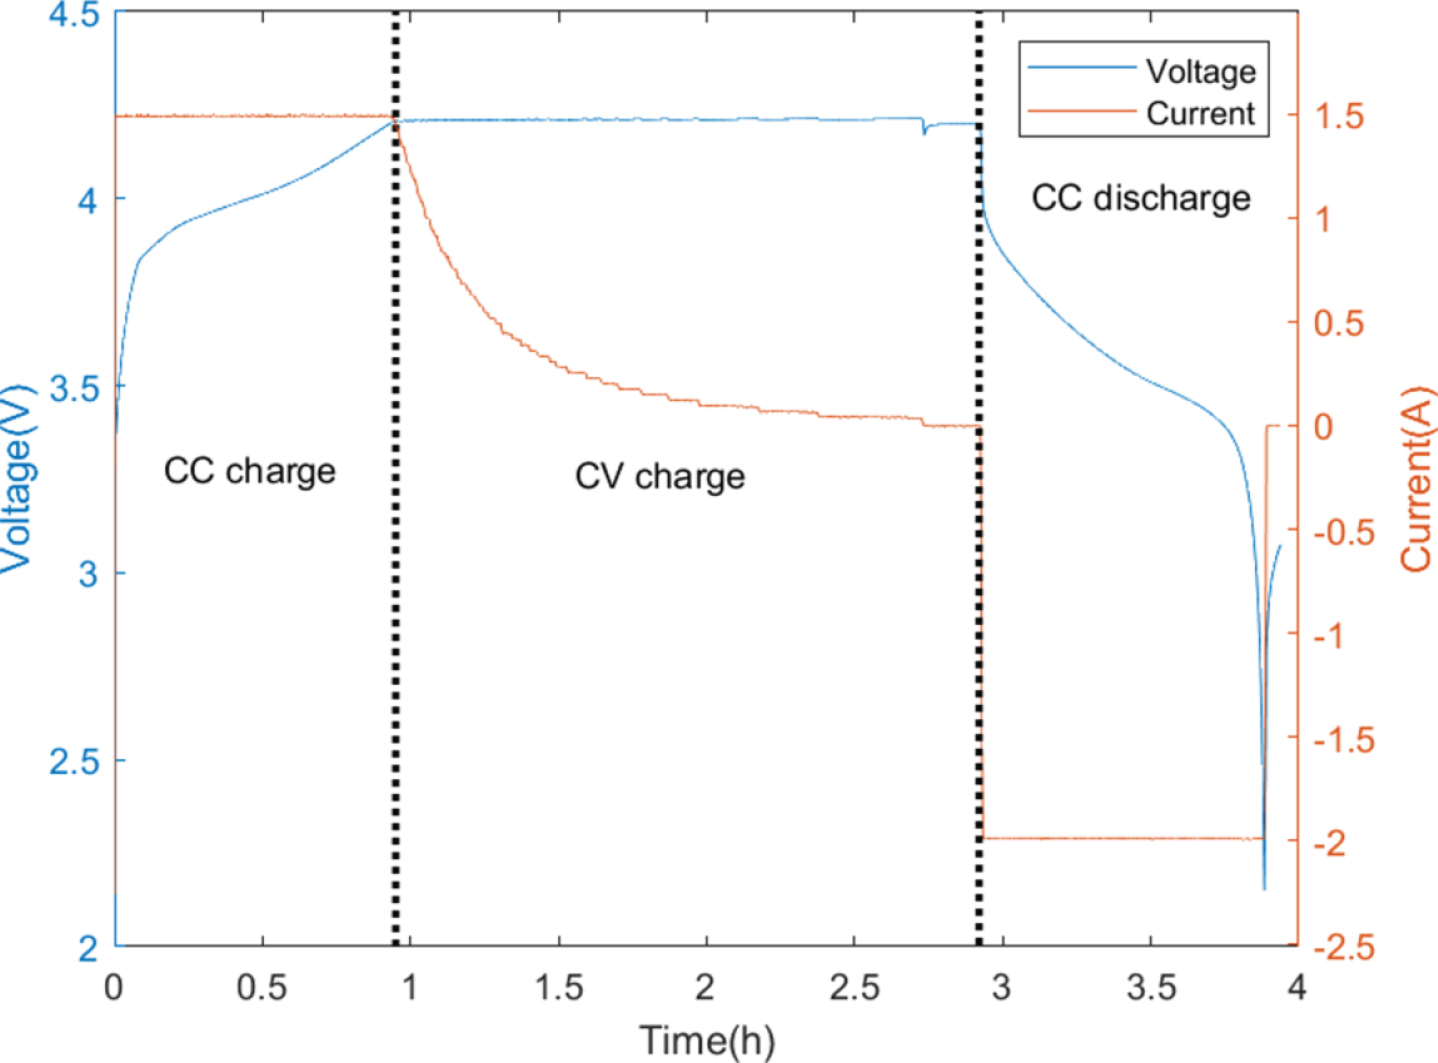
The curve of voltage and current at the 2nd cycle (#5).
Figure 2 shows the relation between the capacity degradation and the cycle number with #5, #6 and #7. The value of failure threshold is set as 70% of the rated capacity (1.4 Ah) in this study. The curves of capacity degradation are not monotone decreasing due to some experiment intervals. During the aging process, the phenomenon of capacity regeneration has an important influence on RUL prediction due to highly dynamic and nonlinear of degradation curves. So it is necessary that not only need to accurately estimate SoH but also need improve the problem of capacity regeneration.

Capacity degradation curves.
In Fig. 3, the lithium-ion battery charging curves are provided at the different cycles containing the 40th, 80th, 120th and 160th cycles. With the increase of cycles, the shape of the charging curves are influenced by the lithium-ion battery aging. For example, the CC charging time of 40th cycle is shortest in Fig. 3(a). So the changing shape of voltage and current curves is the basis of feature extraction in next part.

Charging curve evolution at different cycles (#5).
Because of the output of the ESS is affected by the various conditions, the discharging process is unpredictable and incomplete in practice. The processes of charging controlled by ESS, and the aging features are extracted from the curves that the voltage of the last 500 s under CC charge and the current of the first 500 s under CV charge. The energy from discrete wavelet transform (DWT) is applied to extract features in this study. It can characterizes the energy distribution of the signal in the domain of time and frequency [34]. The energy will change with the shape of the charging curves. The finite energy signal f(t) in terms of both the scaling and the wavelet functions is defined by the formula:

The feature extraction process of DWT-PCA.
The structure and learning algorithm for the FBELNN and the RCMNN are detailed in this section, FBELNN is used as SoH estimator and RCMNN is used as RUL predictor.
The structure and learning algorithm of FBELNN
As mentioned before, the FBELNN contains two parts so two fuzzy inference rules are defined as:
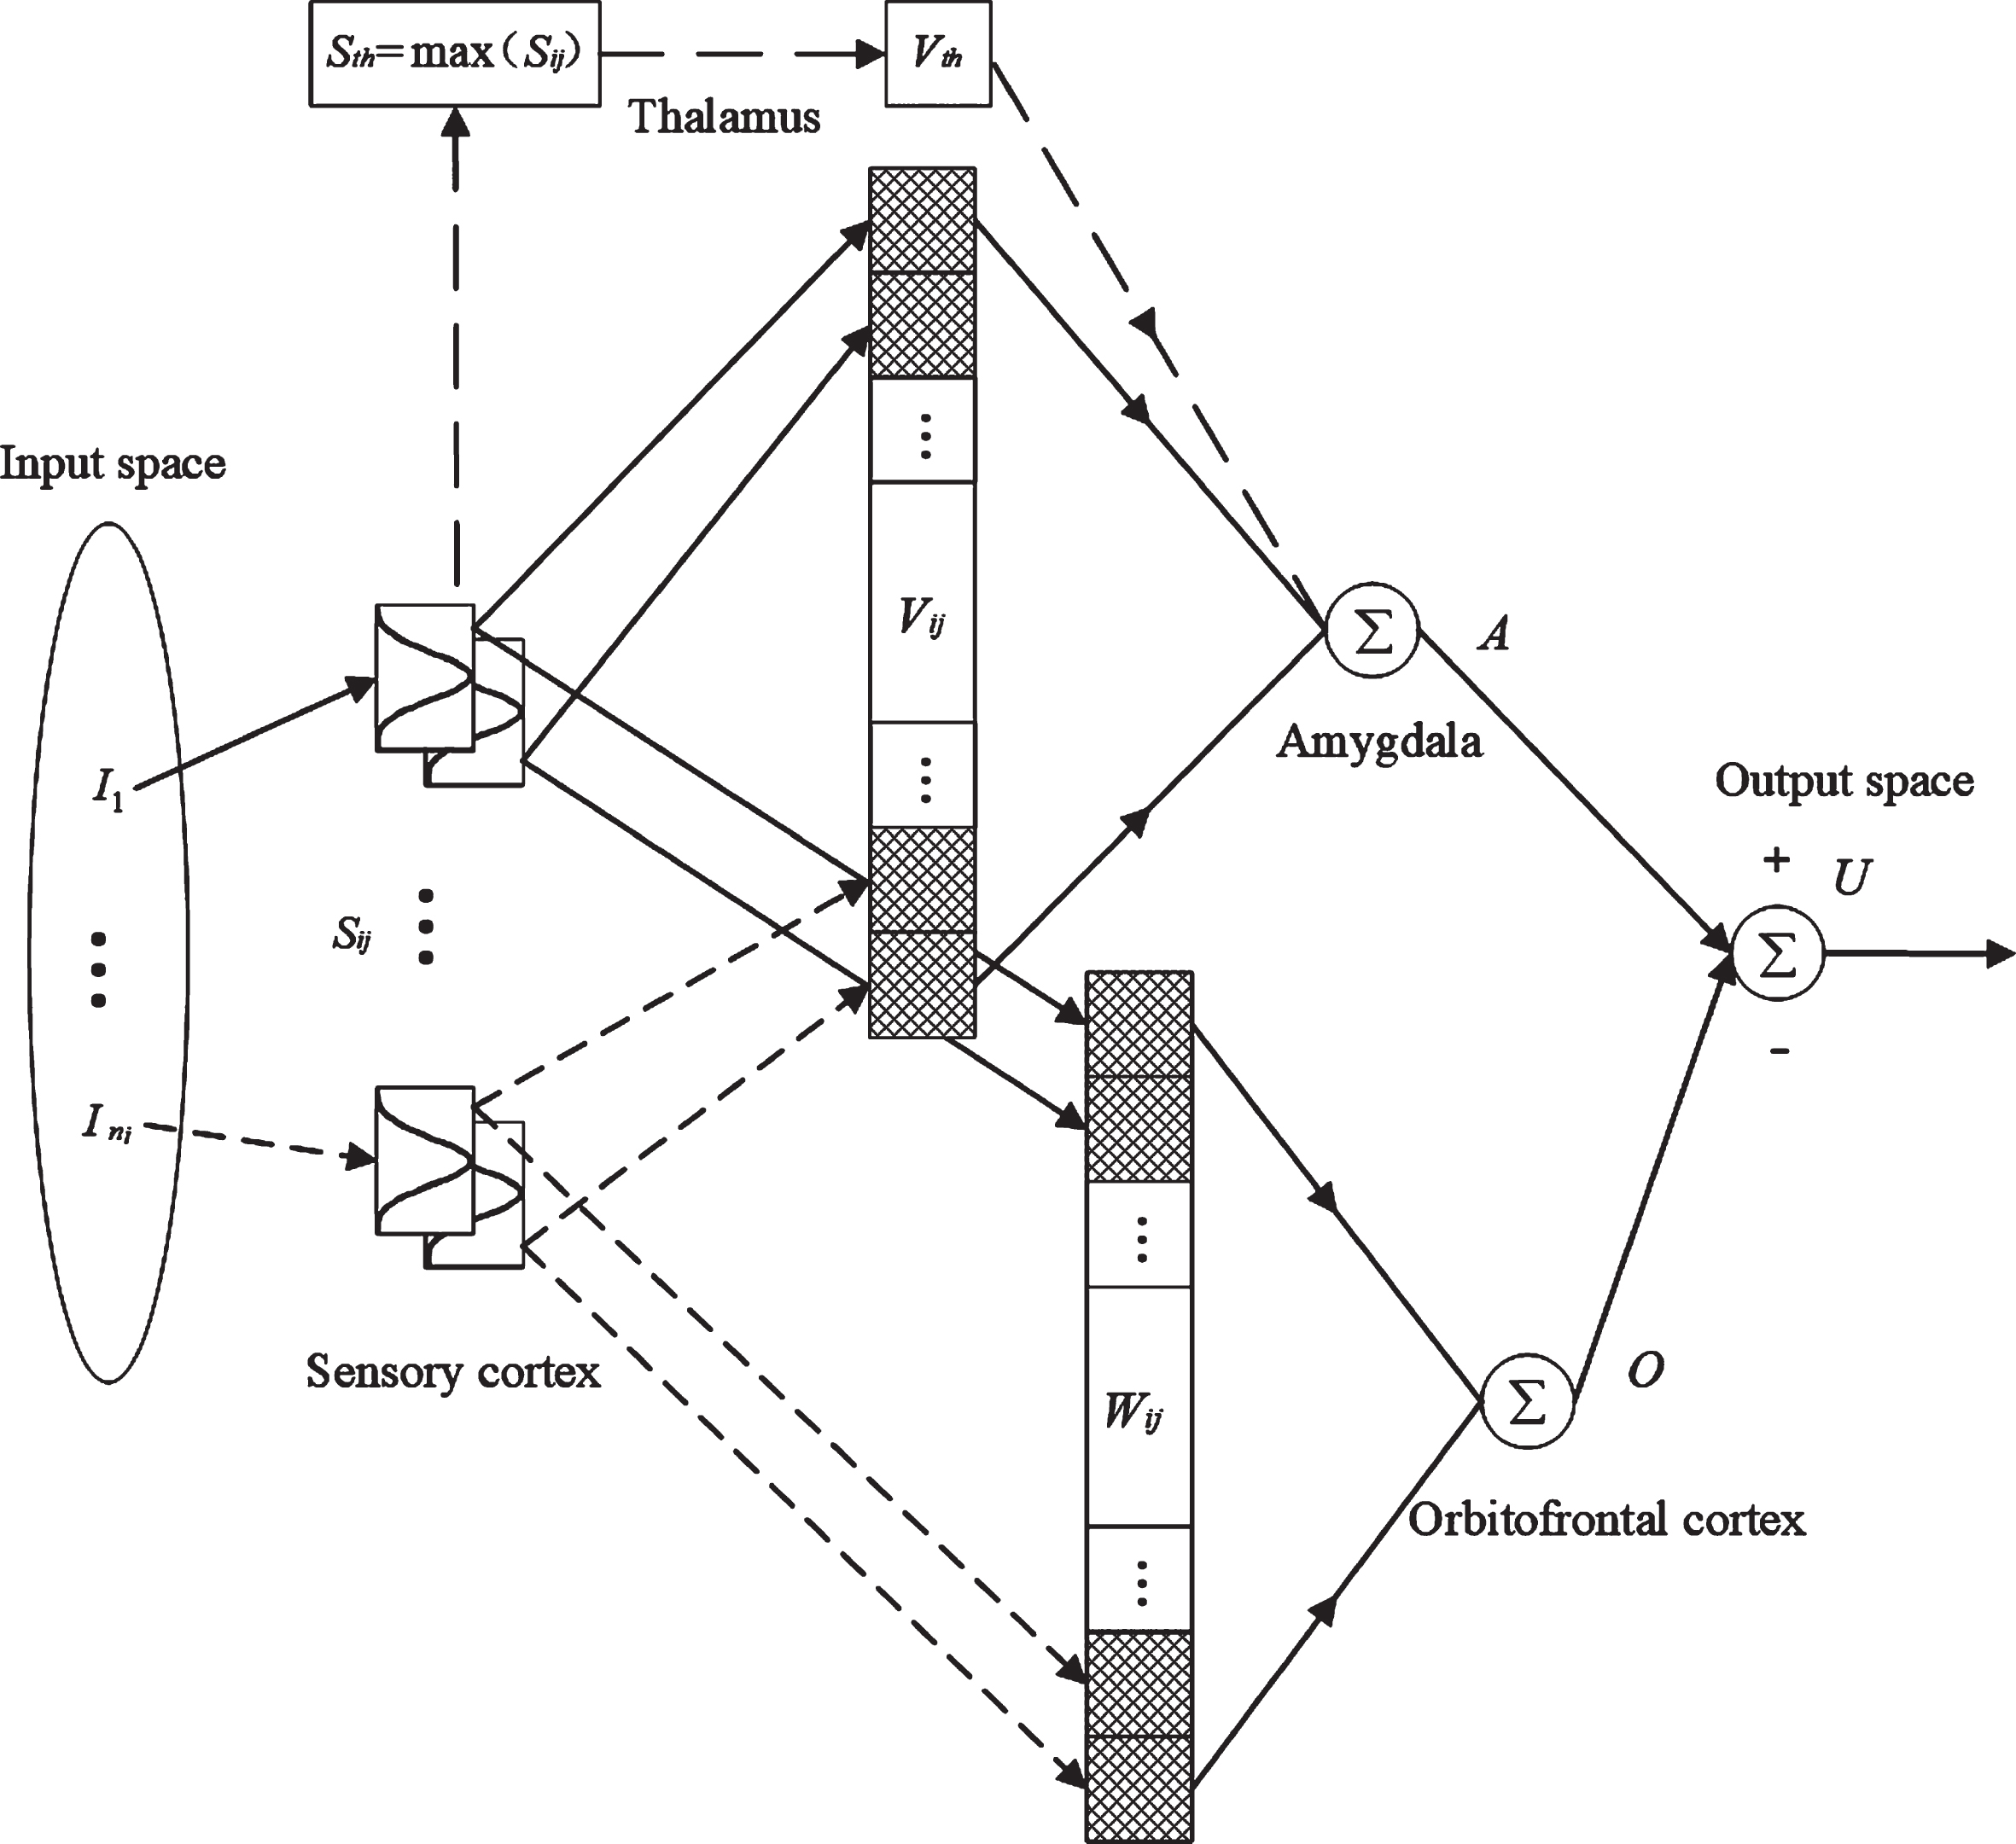
The structure of FBELNN.
Layer 1. Input space: According to a given problem, I
i
∈ R
i
, i = 1, 2, … , n
i
, where n
i
is considered to be the feature dimension. I
i
is the feature extracted by DWT-PCA. Layer 2. Sensory cortex space: This space performs the fuzzification operation and transmit the input to the amygdala and orbitofrontal cortex space. It is different from the sensory input of a normal BELNN. The Gaussian function is adopted as the basis function, which is represented as:
Layer 3. Amygdala and orbitofrontal cortex space: This layer is the algebraic sum of the amygdala and orbitofrontal cortex weights with the sensory cortex value S
ij
. The amygdala space output is:
The weights of V
ij
and W
ij
are adjusted by specific learning rules. Layer 4. Output space: The output of the FBELNN is the result of interaction between the amygdala space and the orbitofrontal cortex space. The output of the FBELNN is represented as:
The learning rules for the amygdala and the orbitofrontal cortex involve updating the weights of V
ij
and W
ij
. The updating laws for the weights space are represented as:
In this part, the structure of the RCMNN is shown in Fig. 6, which recurrent units insert in association memory space and weight memory space. And in the association memory space and receptive-field space, the fuzzy inference rules follow as:
where n a is the input dimension, φ abc is the fuzzy set for the a-th input b-th layer and c-th block, and w b is a output weight for the b-th layer.
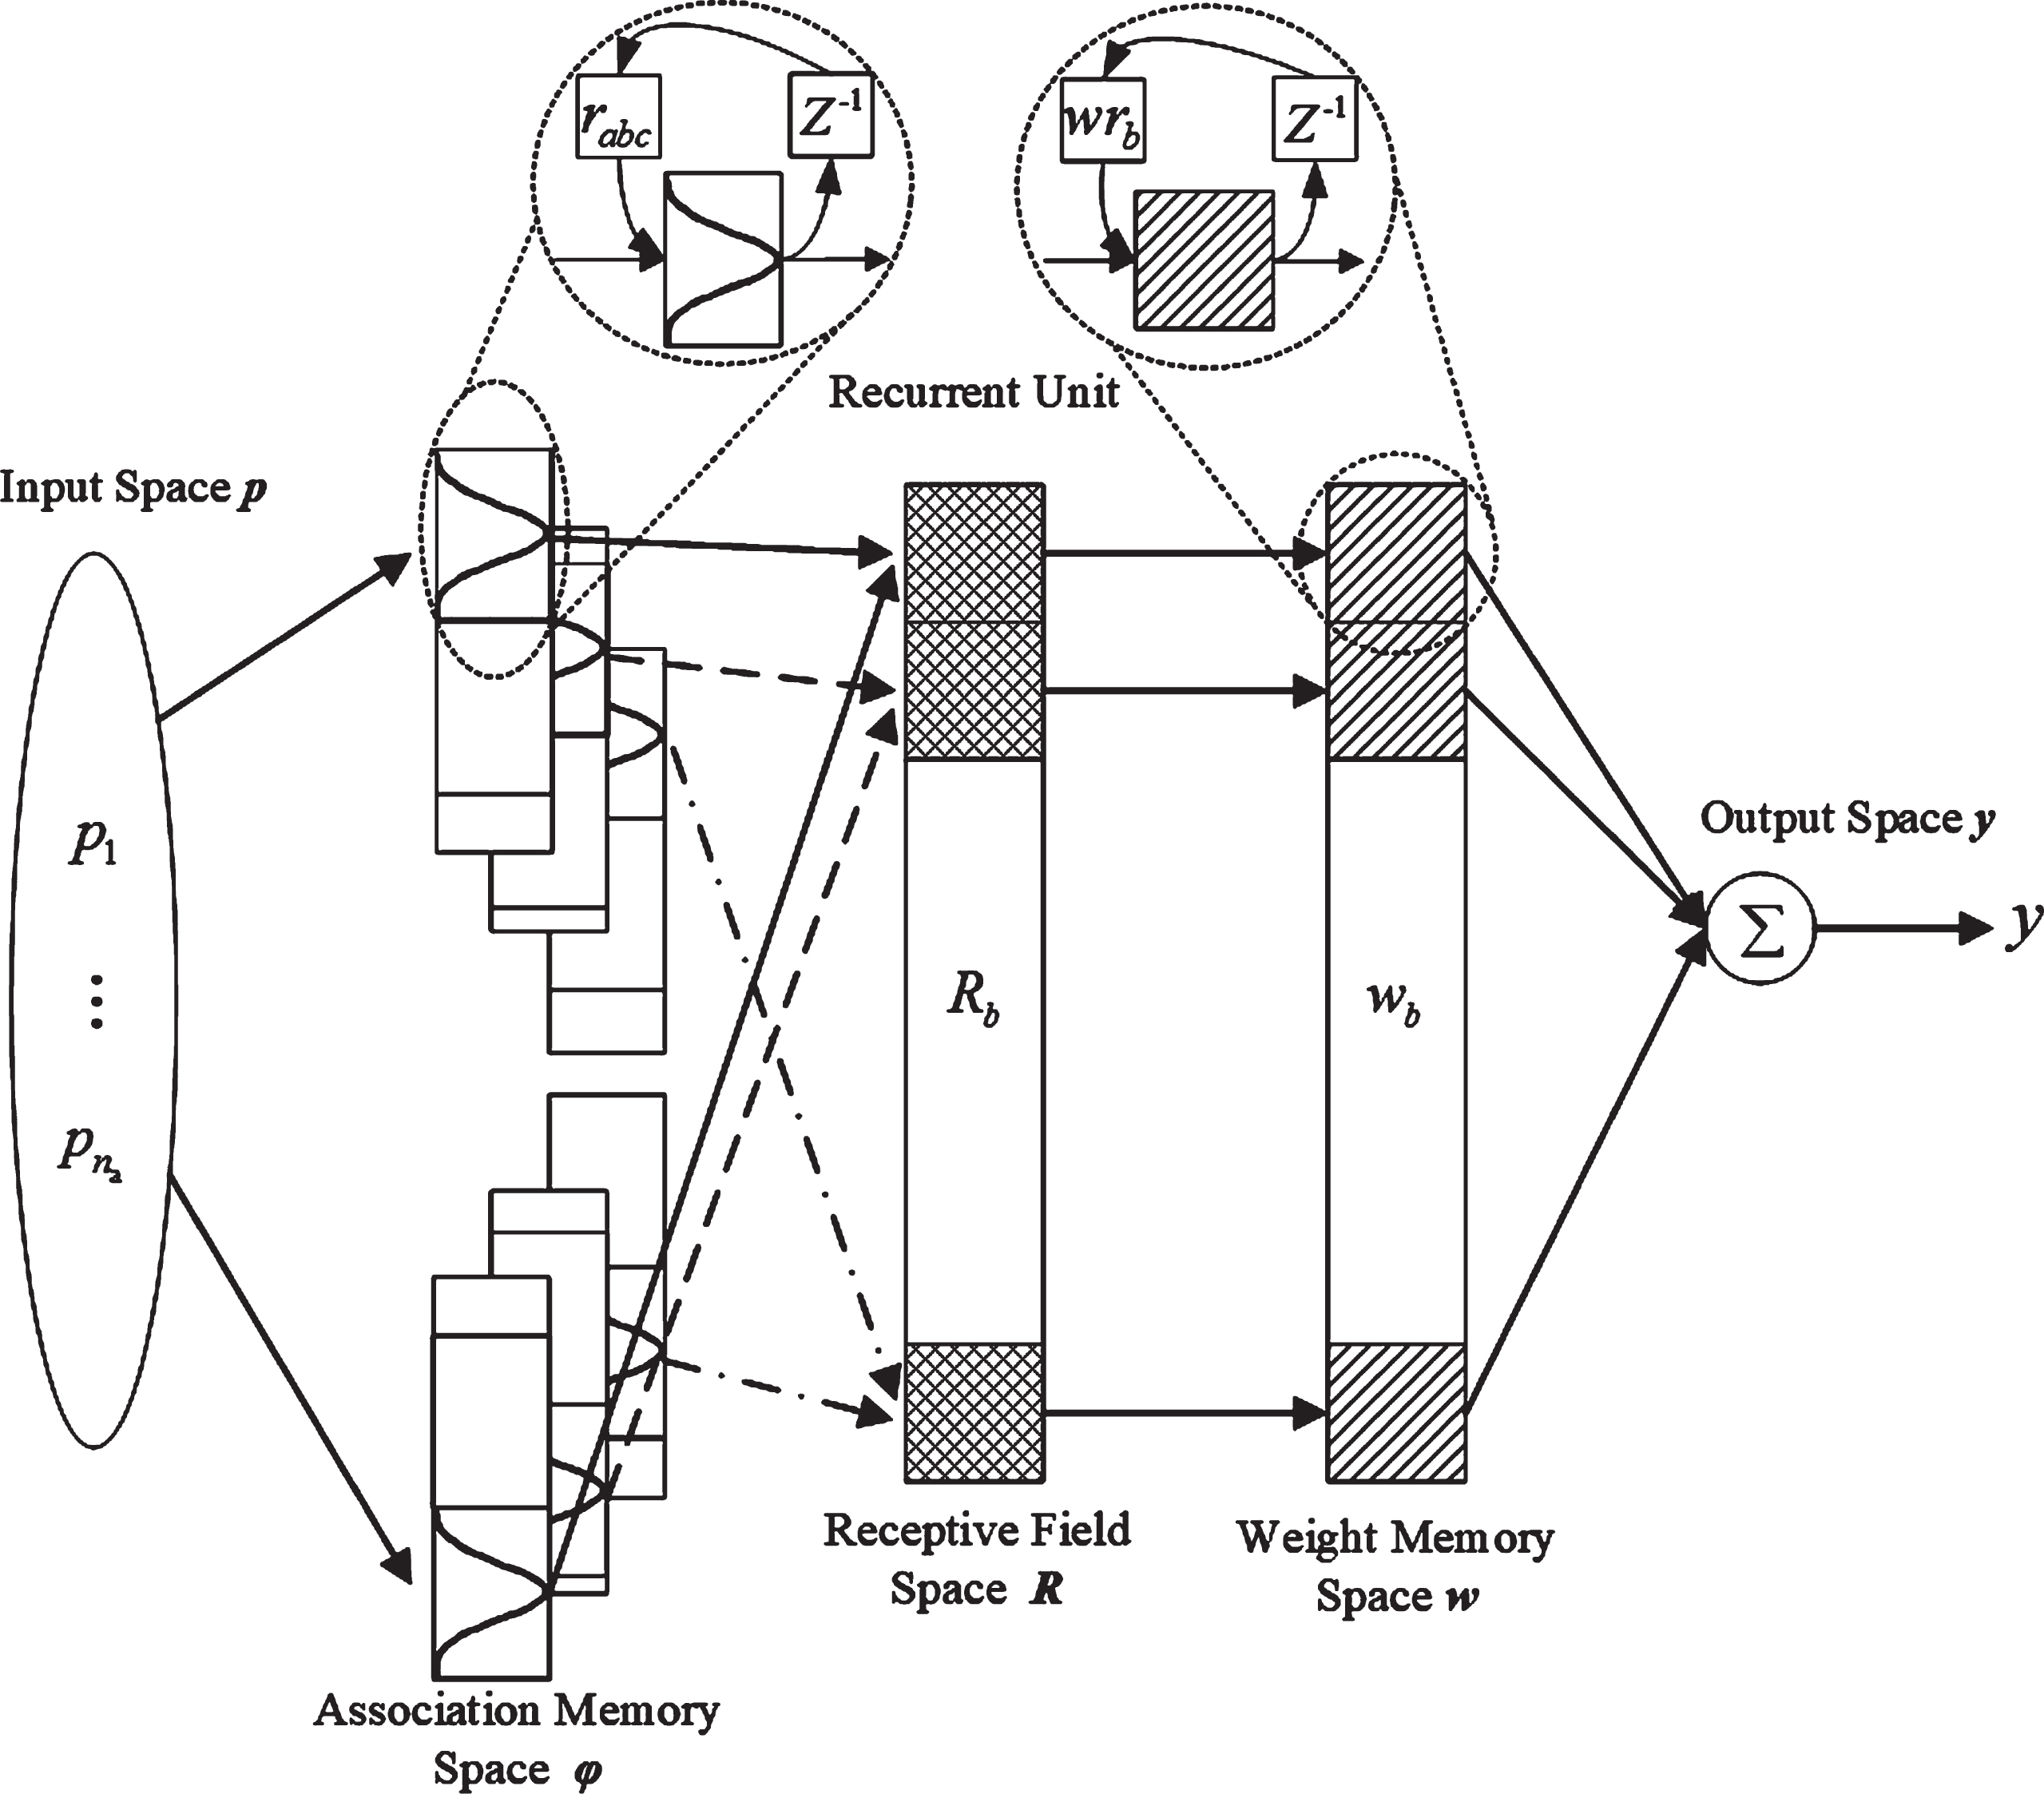
The structure of RCMNN.
Layer 1. Input space: p
a
∈ R
a
, a = 1, 2, … , n
a
, p
a
is the lithium-ion battery of SoH in RUL prediction, all variables of the input p
a
can be quantized into discrete states. Layer 2. Association memory space: In this space, one input simultaneously activate different fuzzy sets for different layers. The mechanism for this mapping is shown in Fig. 7 that several states are accumulated into one block that adopted Gaussian function as a receptive-field basis function. It can be represented as:
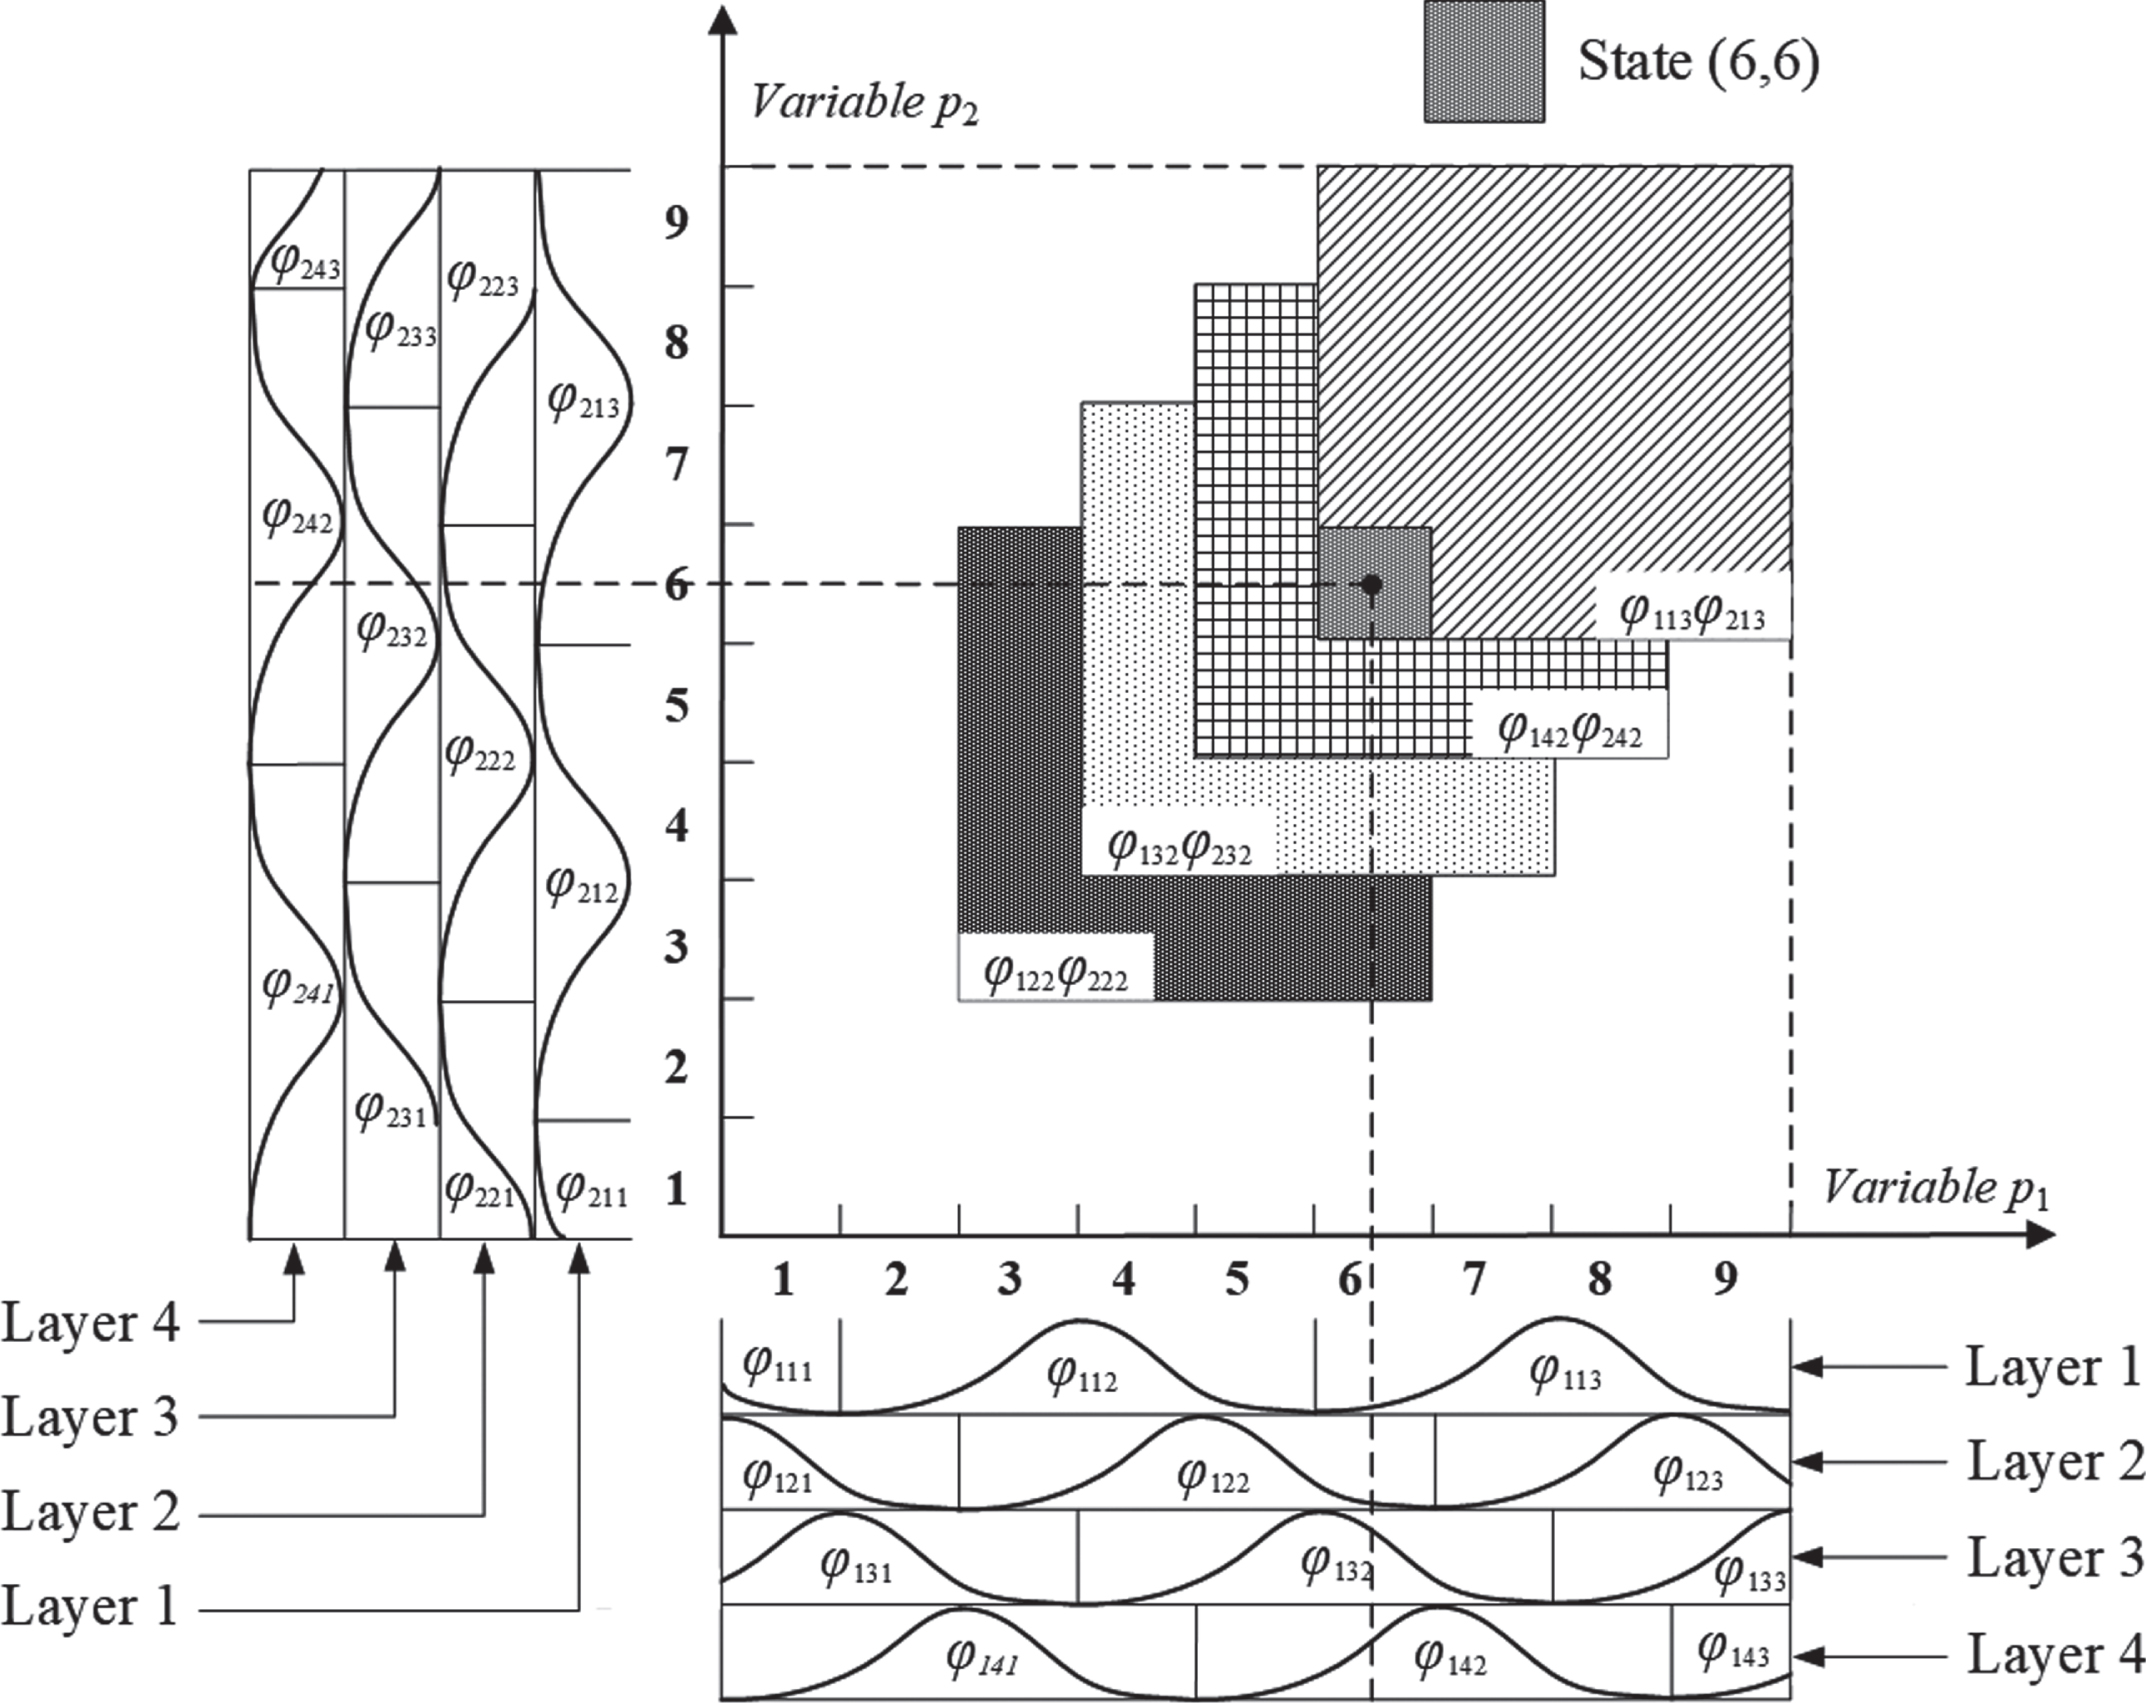
Two-dimensional RCMNN with n b = 4 and n c = 3.
where φ
abc
denotes the output of the b-th layer and c-th block for the a-th input of pr
a
with the mean χ
abc
and variance v
abc
. In the RCMNN, the input of this block can be described as:
Layer 3. Receptive field space: Areas formed by blocks are called receptive field space. The b-th receptive-field function is defined as:
In the fuzzy rules in (18), the product is used as the “and” computation in the antecedent part of the fuzzy rules. The multidimensional receptive field functions can be expressed in a vector form:
Layer 4. Weight memory space: In this space, each location of R
b
to a particular adjustable value can be expressed as:
Layer 5. Output space: In this paper, the output of RCMNN is expressed as:
Due to the effect of the recurrent units in the weight memory space, Rr
b
is represent as:
The parameters of the RCMNN are adjusted by gradient descent algorithm. A cost function is defined as:
According to the above illustration, the processes and results of SoH estimation and RUL prediction are further analyzed and compared in this section.
The processes of SoH estimation and RUL prediction
The flow chart of SoH estimation and RUL prediction is shown in Fig. 8. This flow chart not only includes the offline training and the online monitoring, but also illustrates the processes of SoH estimation and RUL prediction.

The flow chart of SoH estimation and RUL prediction.
In the part of offline training, the method of feature extraction is showed in the section of 2.2, and the results of feature extraction will be analyzed in next section. The parameters of FBELNN are updated based on the features and the residual capacity from other lithium-ion battery for building SoH estimator. The RCMNN learns the curve of capacity degradation of other lithium-ion battery for building RUL predictor, and the role of the recurrent units is better catch the fluctuation of capacity degradation. In the part of online monitoring, the charging curve of the lithium-ion battery in use is collected, and then feature extraction and SoH estimation are carried out by trained FBELNN. The results of SoH estimation are shown to the operator to ensure the safety of the ESS, and are used as the basis of RUL prediction of the lithium-ion battery in use. And the SoH results estimated under online monitoring can be used to train RCMNN again to improve the accuracy of RUL prediction, that can help the operator to prepare for lithium-ion battery replacements. But limited by experimental conditions in the lab, this study uses the datasets of PCoE as the basis of offline training and online monitoring. And the analysis and results will be detailed in the following two sections.
The first step of DWT is the selection of decomposition level and wavelet function. In this study, the Daubechies wavelet family (DbN) be chosen because they have shown excellent performance in analyzing the change of the signals, where N is the order of the wavelet function [34]. It is important to select a suitable decomposition level and the order of the wavelet function that can ensure to get enough detail of the signals. To explain that the reason of selection, the wavelet energy of the 40th cycle curve (#5 lithium-ion battery) extracted by Db2, Db3 and Db4 wavelet function are shown in Fig. 9. When the decomposition level is increased to 9, the value of normalized Db3 wavelet energy is larger than other. Therefore, Db3 and decomposition level of 9 can make the effect of feature extraction better during the process of DWT.
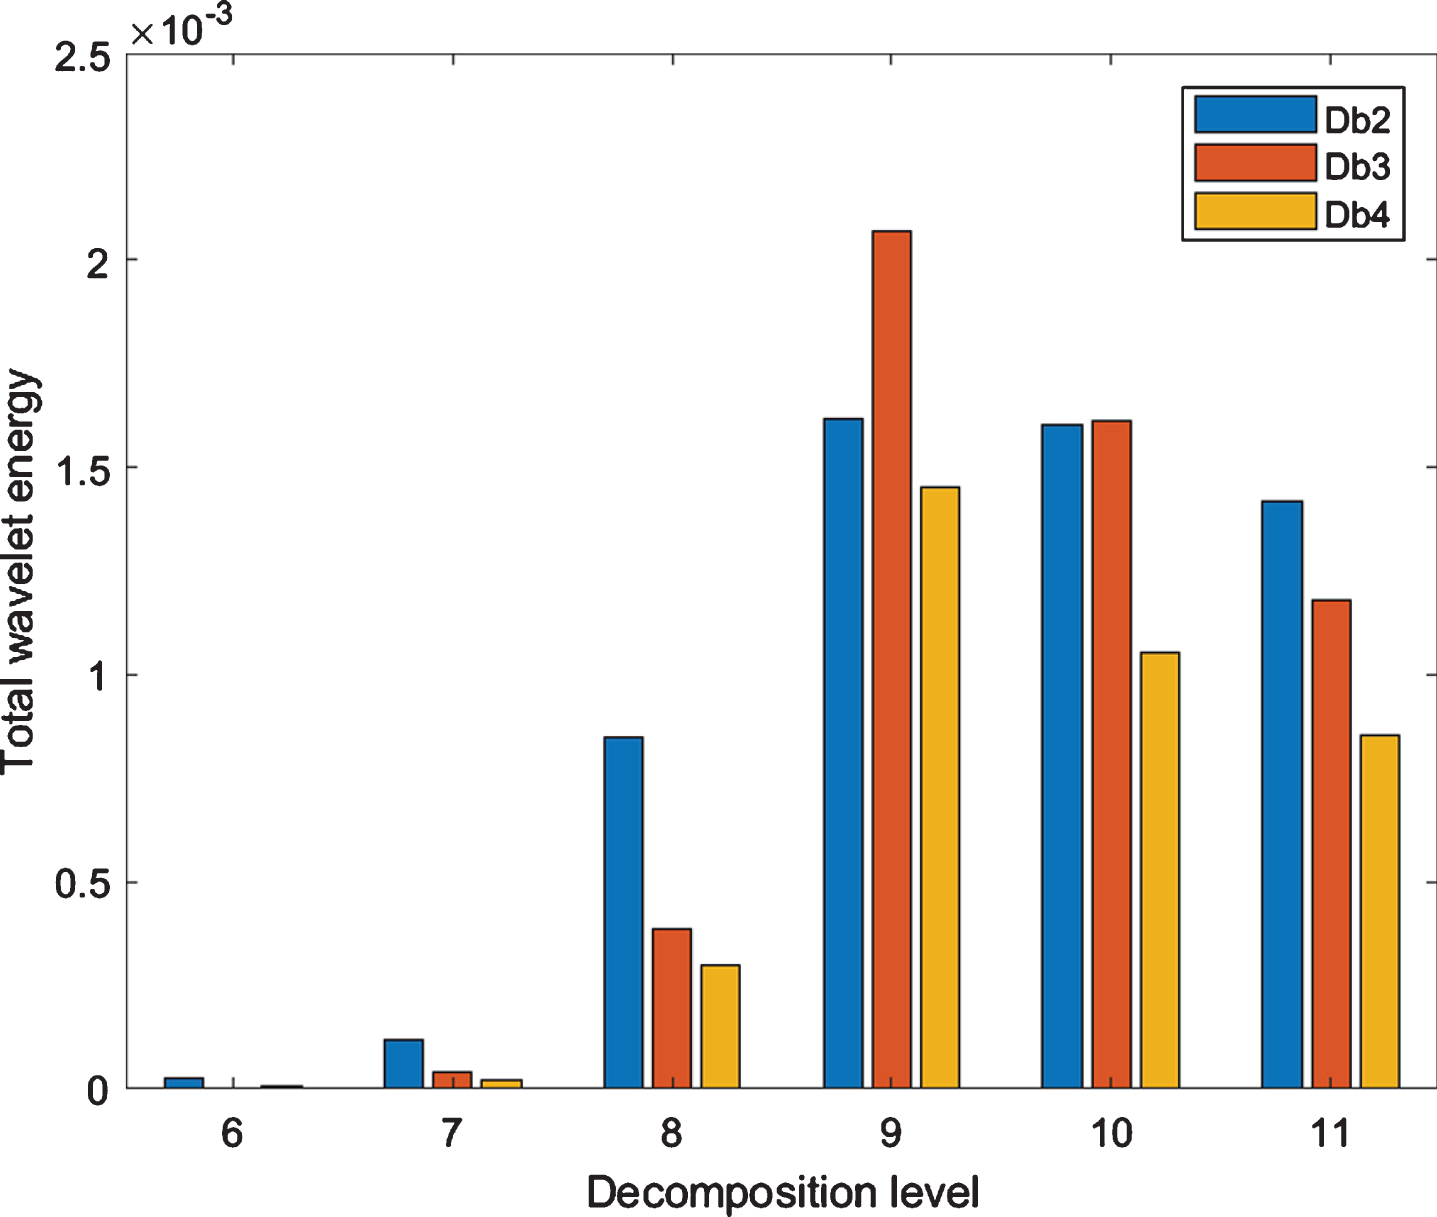
Wavelet energy from 40th cycle with the different decomposition level.
According to section 2.2, the number of feature from DWT is 10 including the wavelet energy and the scaling energy, when the decomposition level is 9. The PCA can uses orthogonal transformation to convert the possibly correlated variables into a set of uncorrelated linearly variables [37], so wavelet energy be optimized by the PCA to improve the performance of SoH estimation. The first principal component of wavelet energy explains 99.68% and 99.85% for the current curve and voltage curve, respectively. It can be seen that the contribution rate of first principal component already reach above 99%, so these results illustrate the performance of features optimization based on the PCA. Thus, the scaling energy and the first principal component from the wavelet energy are used as the input of FBELNN for SoH estimation in this study.
Furthermore, the correlation between the capacity and features is analyzed in order to show the effectiveness of the feature extraction. As shown in Fig. 10, this scatter plot presents the correlation between the capacity and features that are the first principal component from the voltage and current wavelet energy. Spearman rank correlation analysis is a measure of whether the two variables are strictly monotonic. The range of Spearman rank correlation coefficient is r S ∈ [-1, + 1]. The two variables are strictly monotone when r S = ±1 [39]. The calculation formula is shown as in the following function:
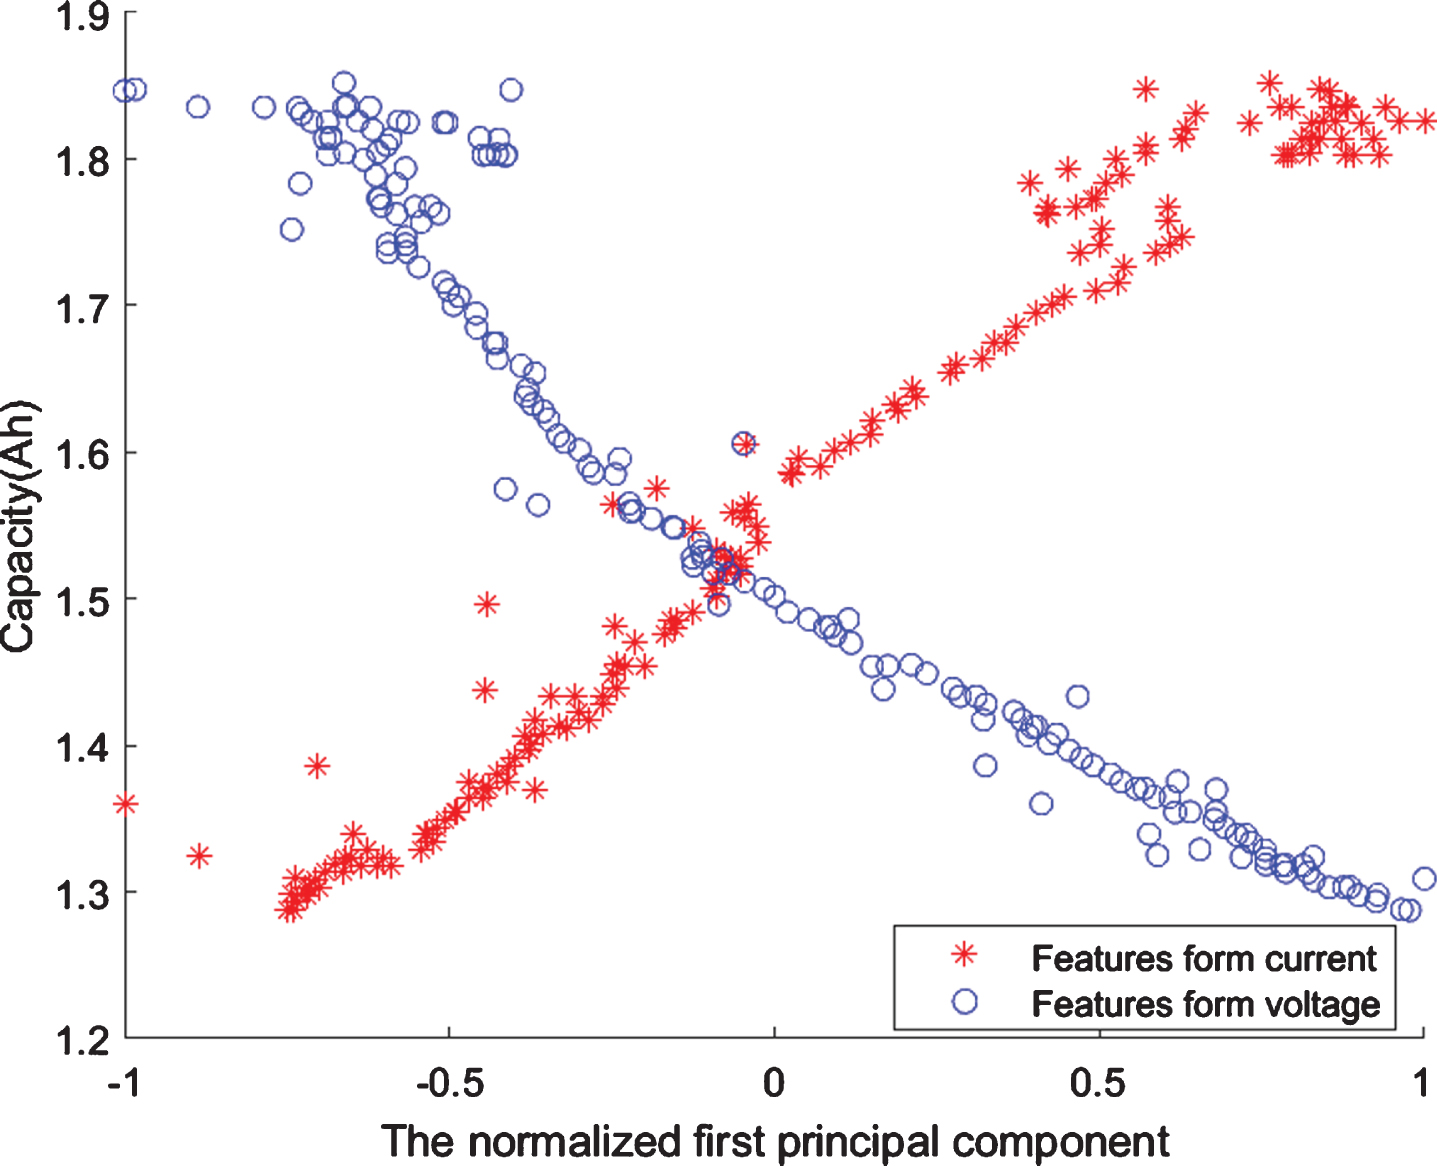
Linear correlation between capacity and features.
According to Fig. 8, the features extracted from #7 lithium-ion battery are used as the input of the FBELNN in the offline training. The number of layer of sensory cortex space is 30. The features extracted from #5 and #6 lithium-ion batteries are tested in online monitoring. The results of SoH estimation for #5 and #6 lithium-ion batteries are respectively shown in Fig. 11 (a) and (b). According to these datasets, #5 and #6 lithium-ion batteries reach the EoL at the 125th and 109th cycle, respectively.
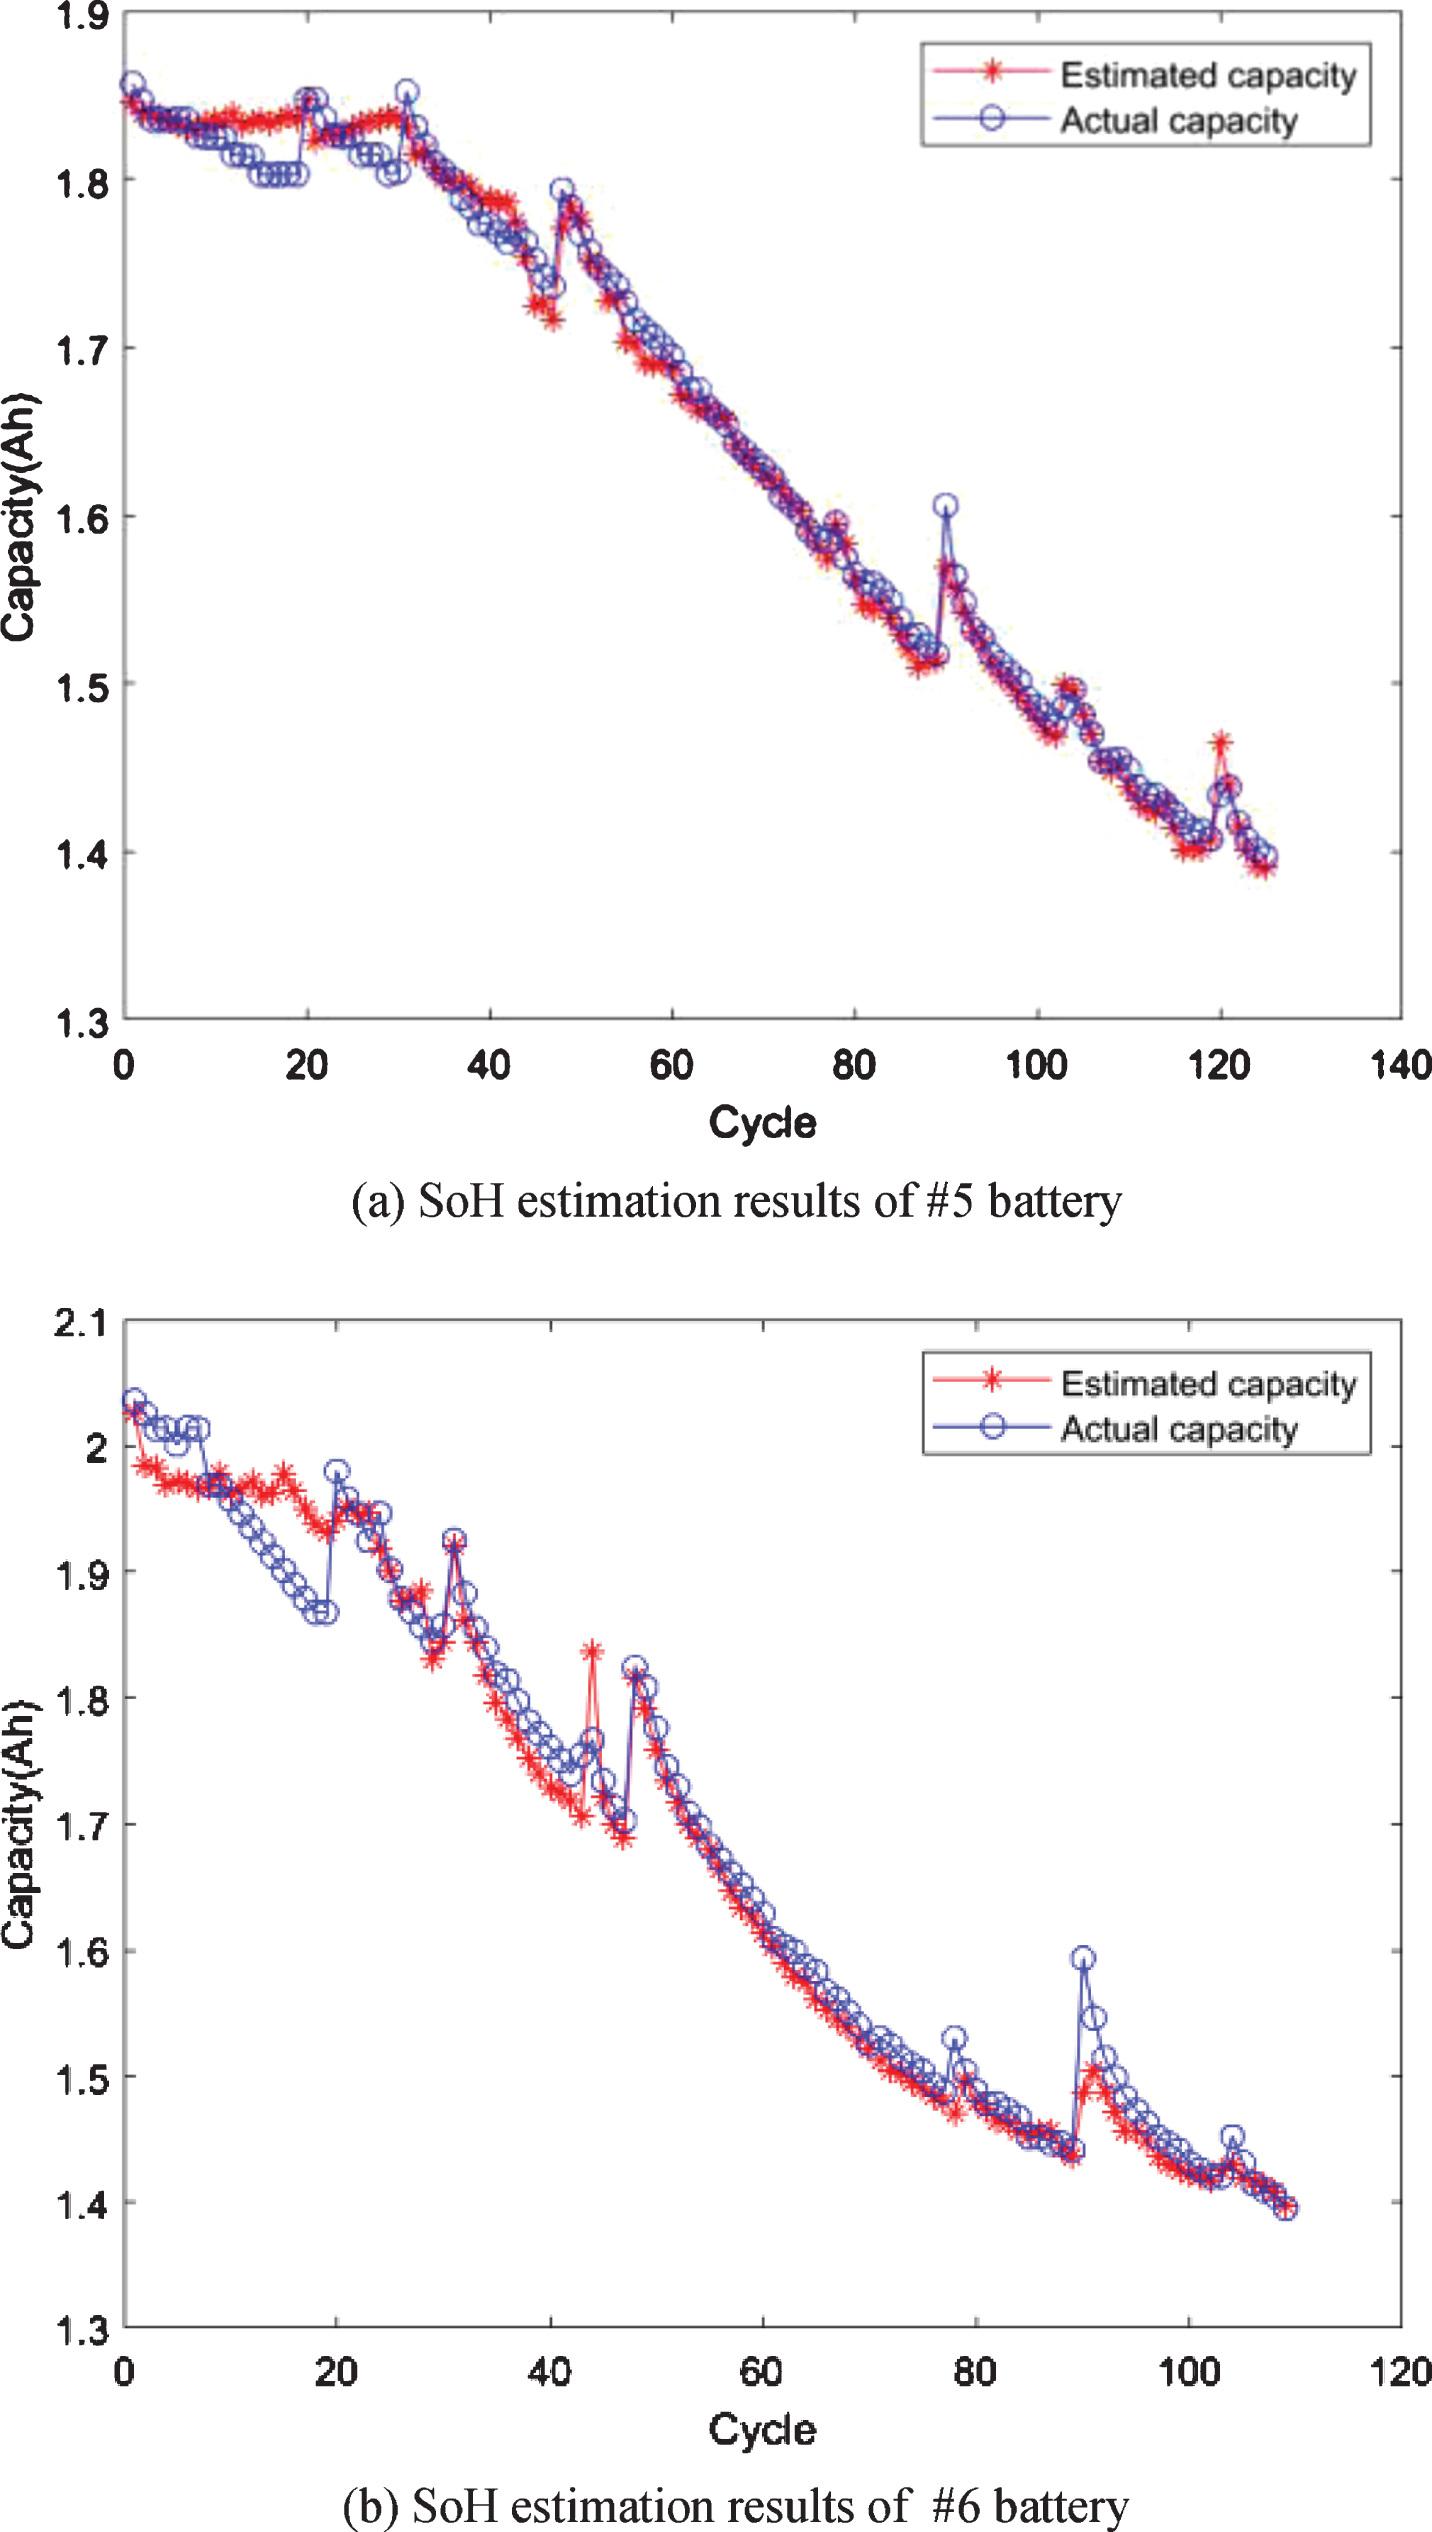
The results of SoH estimation used by the FBELNN.
These results of the FBELNN are further compared with the RCMNN, the CMNN and the fuzzy neural network (FNN). The number of layer and block of association memory space are respectively set as 8 and 3 for the RCMNN and the CMNN. The number layer of membership function layer is 90 for the FNN. The absolute output errors of different methods are shown in Fig. 12 (a) and (b). In Fig. 12, the absolute output errors sometimes abruptly increase which may be caused by the phenomenon of capacity regeneration. The advantages of different methods have not been directly compared in Fig. 12, so the root mean square error (RMSE) and the coefficient of determination (R2) are used in evaluating the performance of different methods. according to function (33) and (34), respectively.
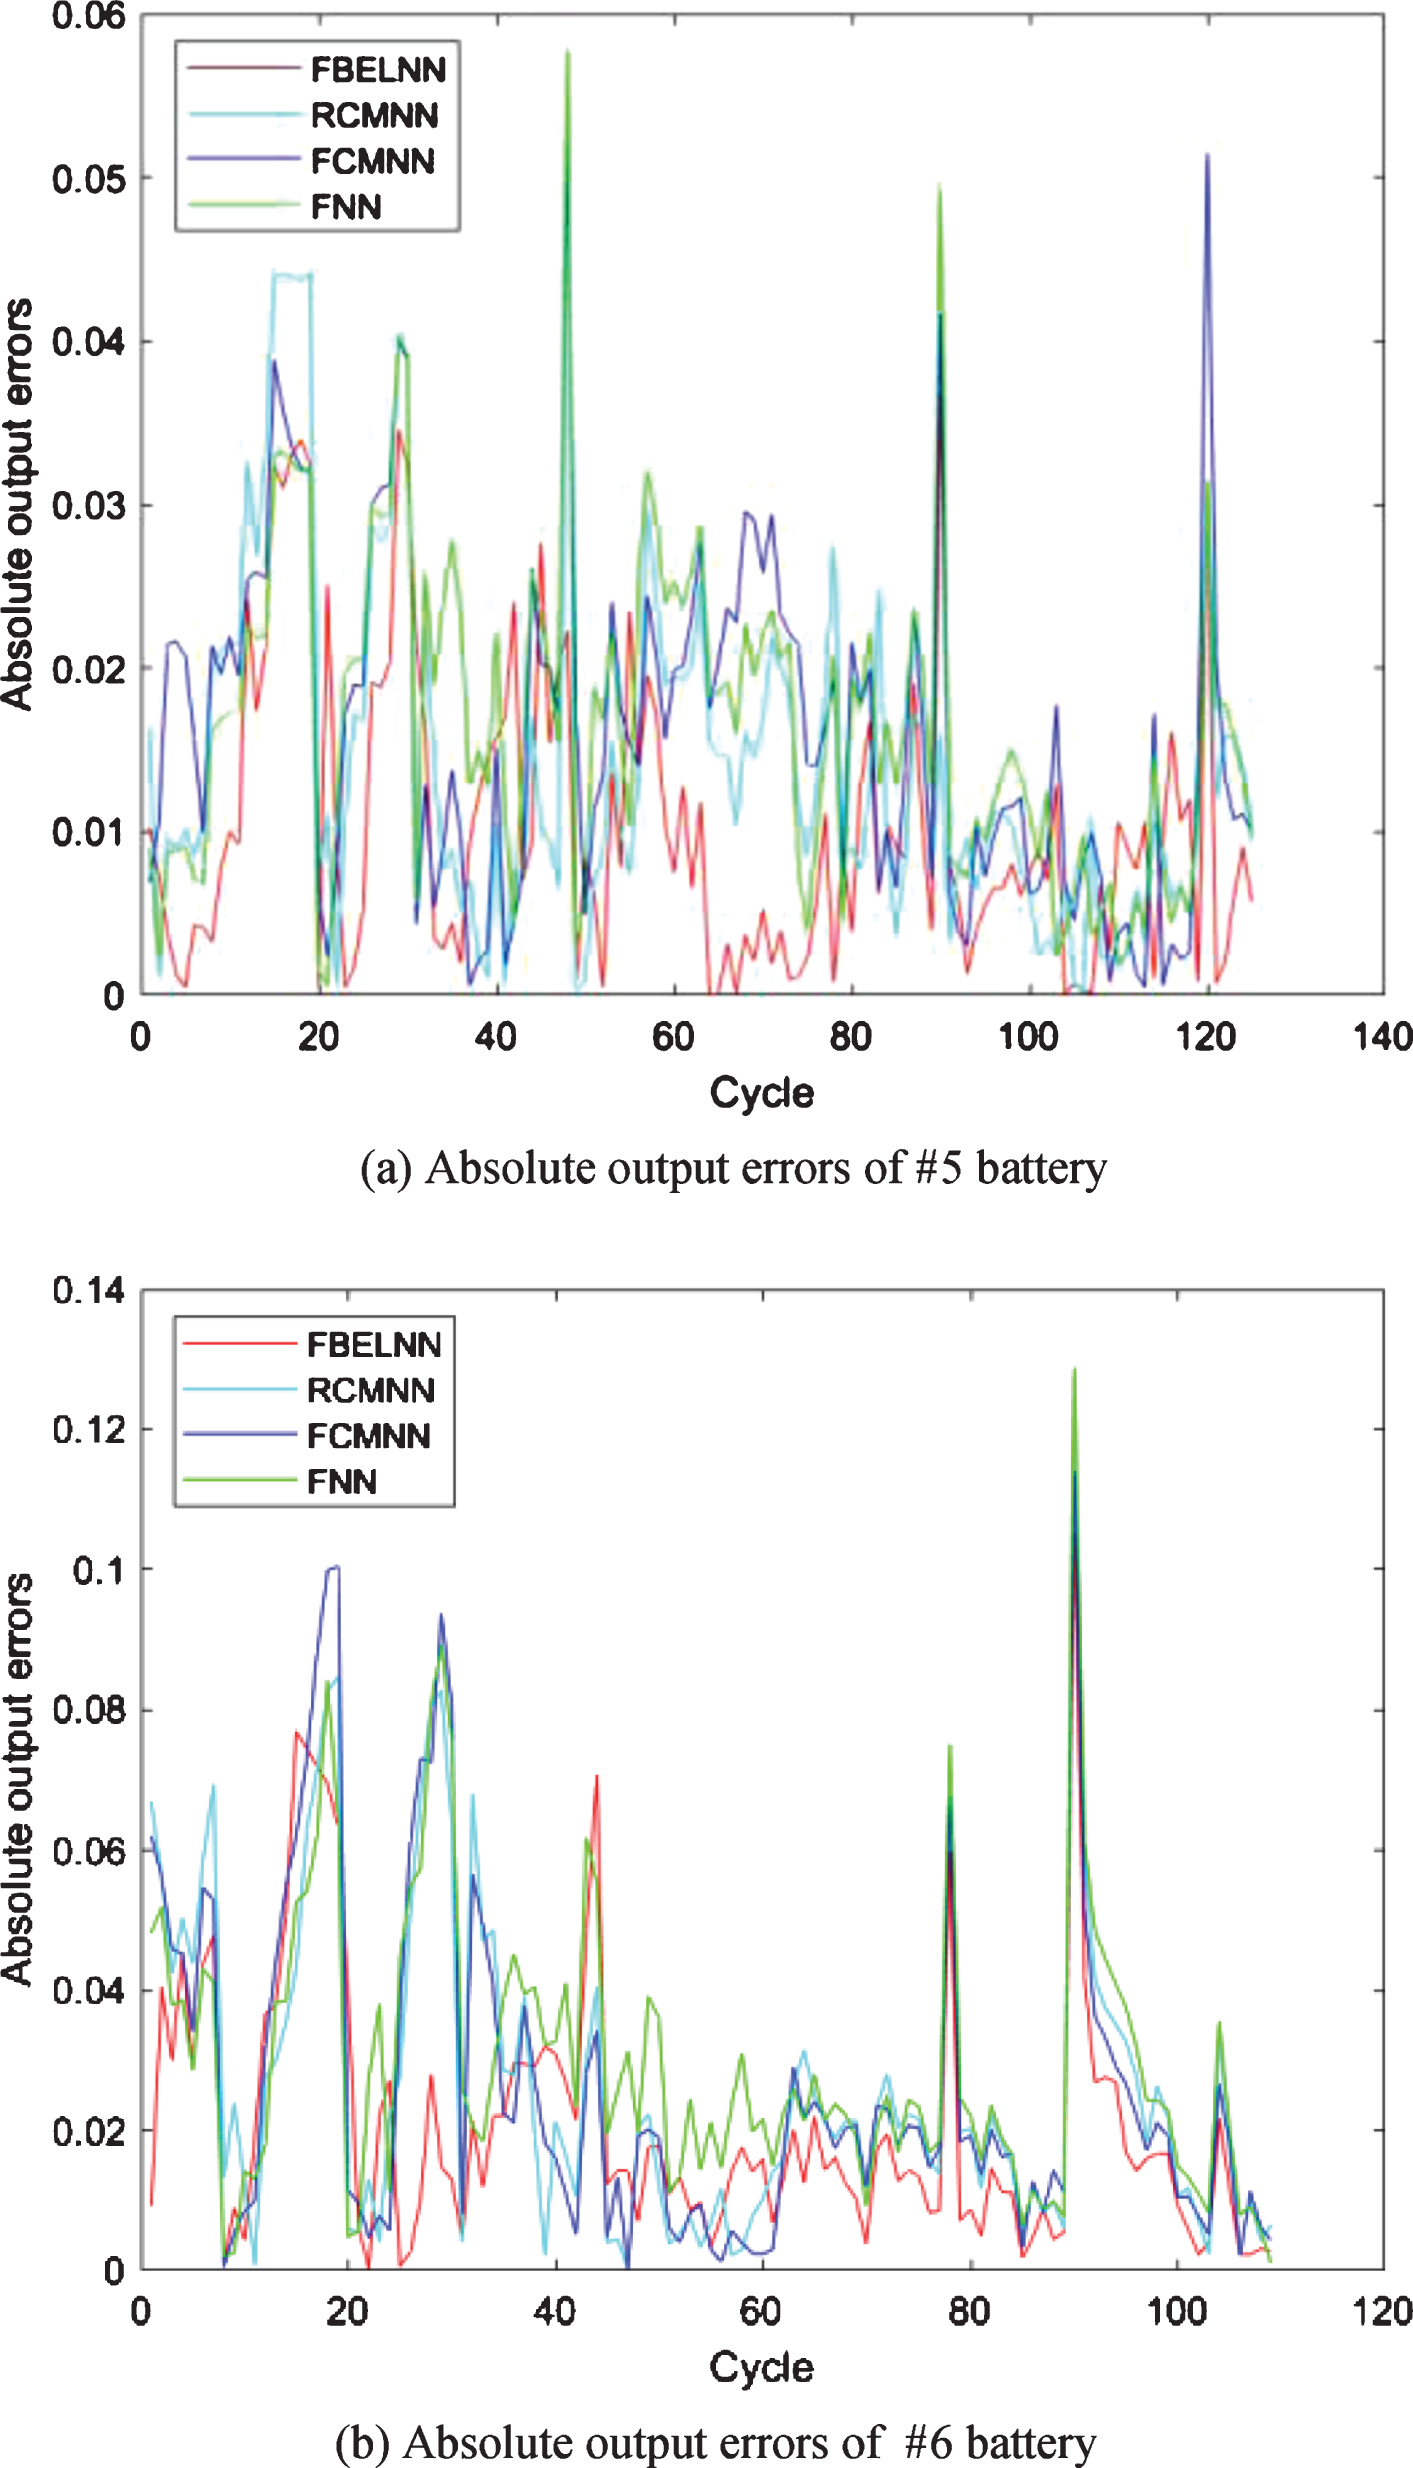
Absolute output errors of different methods.
The performance analysis results of SoH estimation
The lithium-ion battery of RUL also need to be predicted for making the ESS more intelligent. According to Fig. 8, the capacity of #7 lithium-ion battery is used as the training set of the RCMNN in the offline training. Then the results of SoH estimation by the FBELNN are used to train again in online monitoring. These processes can not only reduce the calculation cost by offline training in online monitoring, but also make the RCMNN learn the capacity degradation of the lithium-ion battery better for RUL prediction. The number of iterations for offline training is 5000 and the number of iterations for online training is 100. In the processes of RUL prediction, the predicted output is used as the one of input of the RCMNN in the next moment because the SoH of the lithium-ion battery can’t be known in the future. The RCMNN is compared with the CMNN and the recurrent neural network (RNN) under the same processes. Multiple step prediction is started at the different starting points, and the results of RUL prediction for the different lithium-ion batteries are respectively shown in Figs. 13 and 14. Figure 13 (a) and (b) respectively show the results when the starting points of #5 lithium-ion battery are the 63rd and 82nd cycle. Similarly, Fig. 14 (a) and (b) respectively show the results when the starting points of #6 lithium-ion battery are the 54th and 69th cycle.
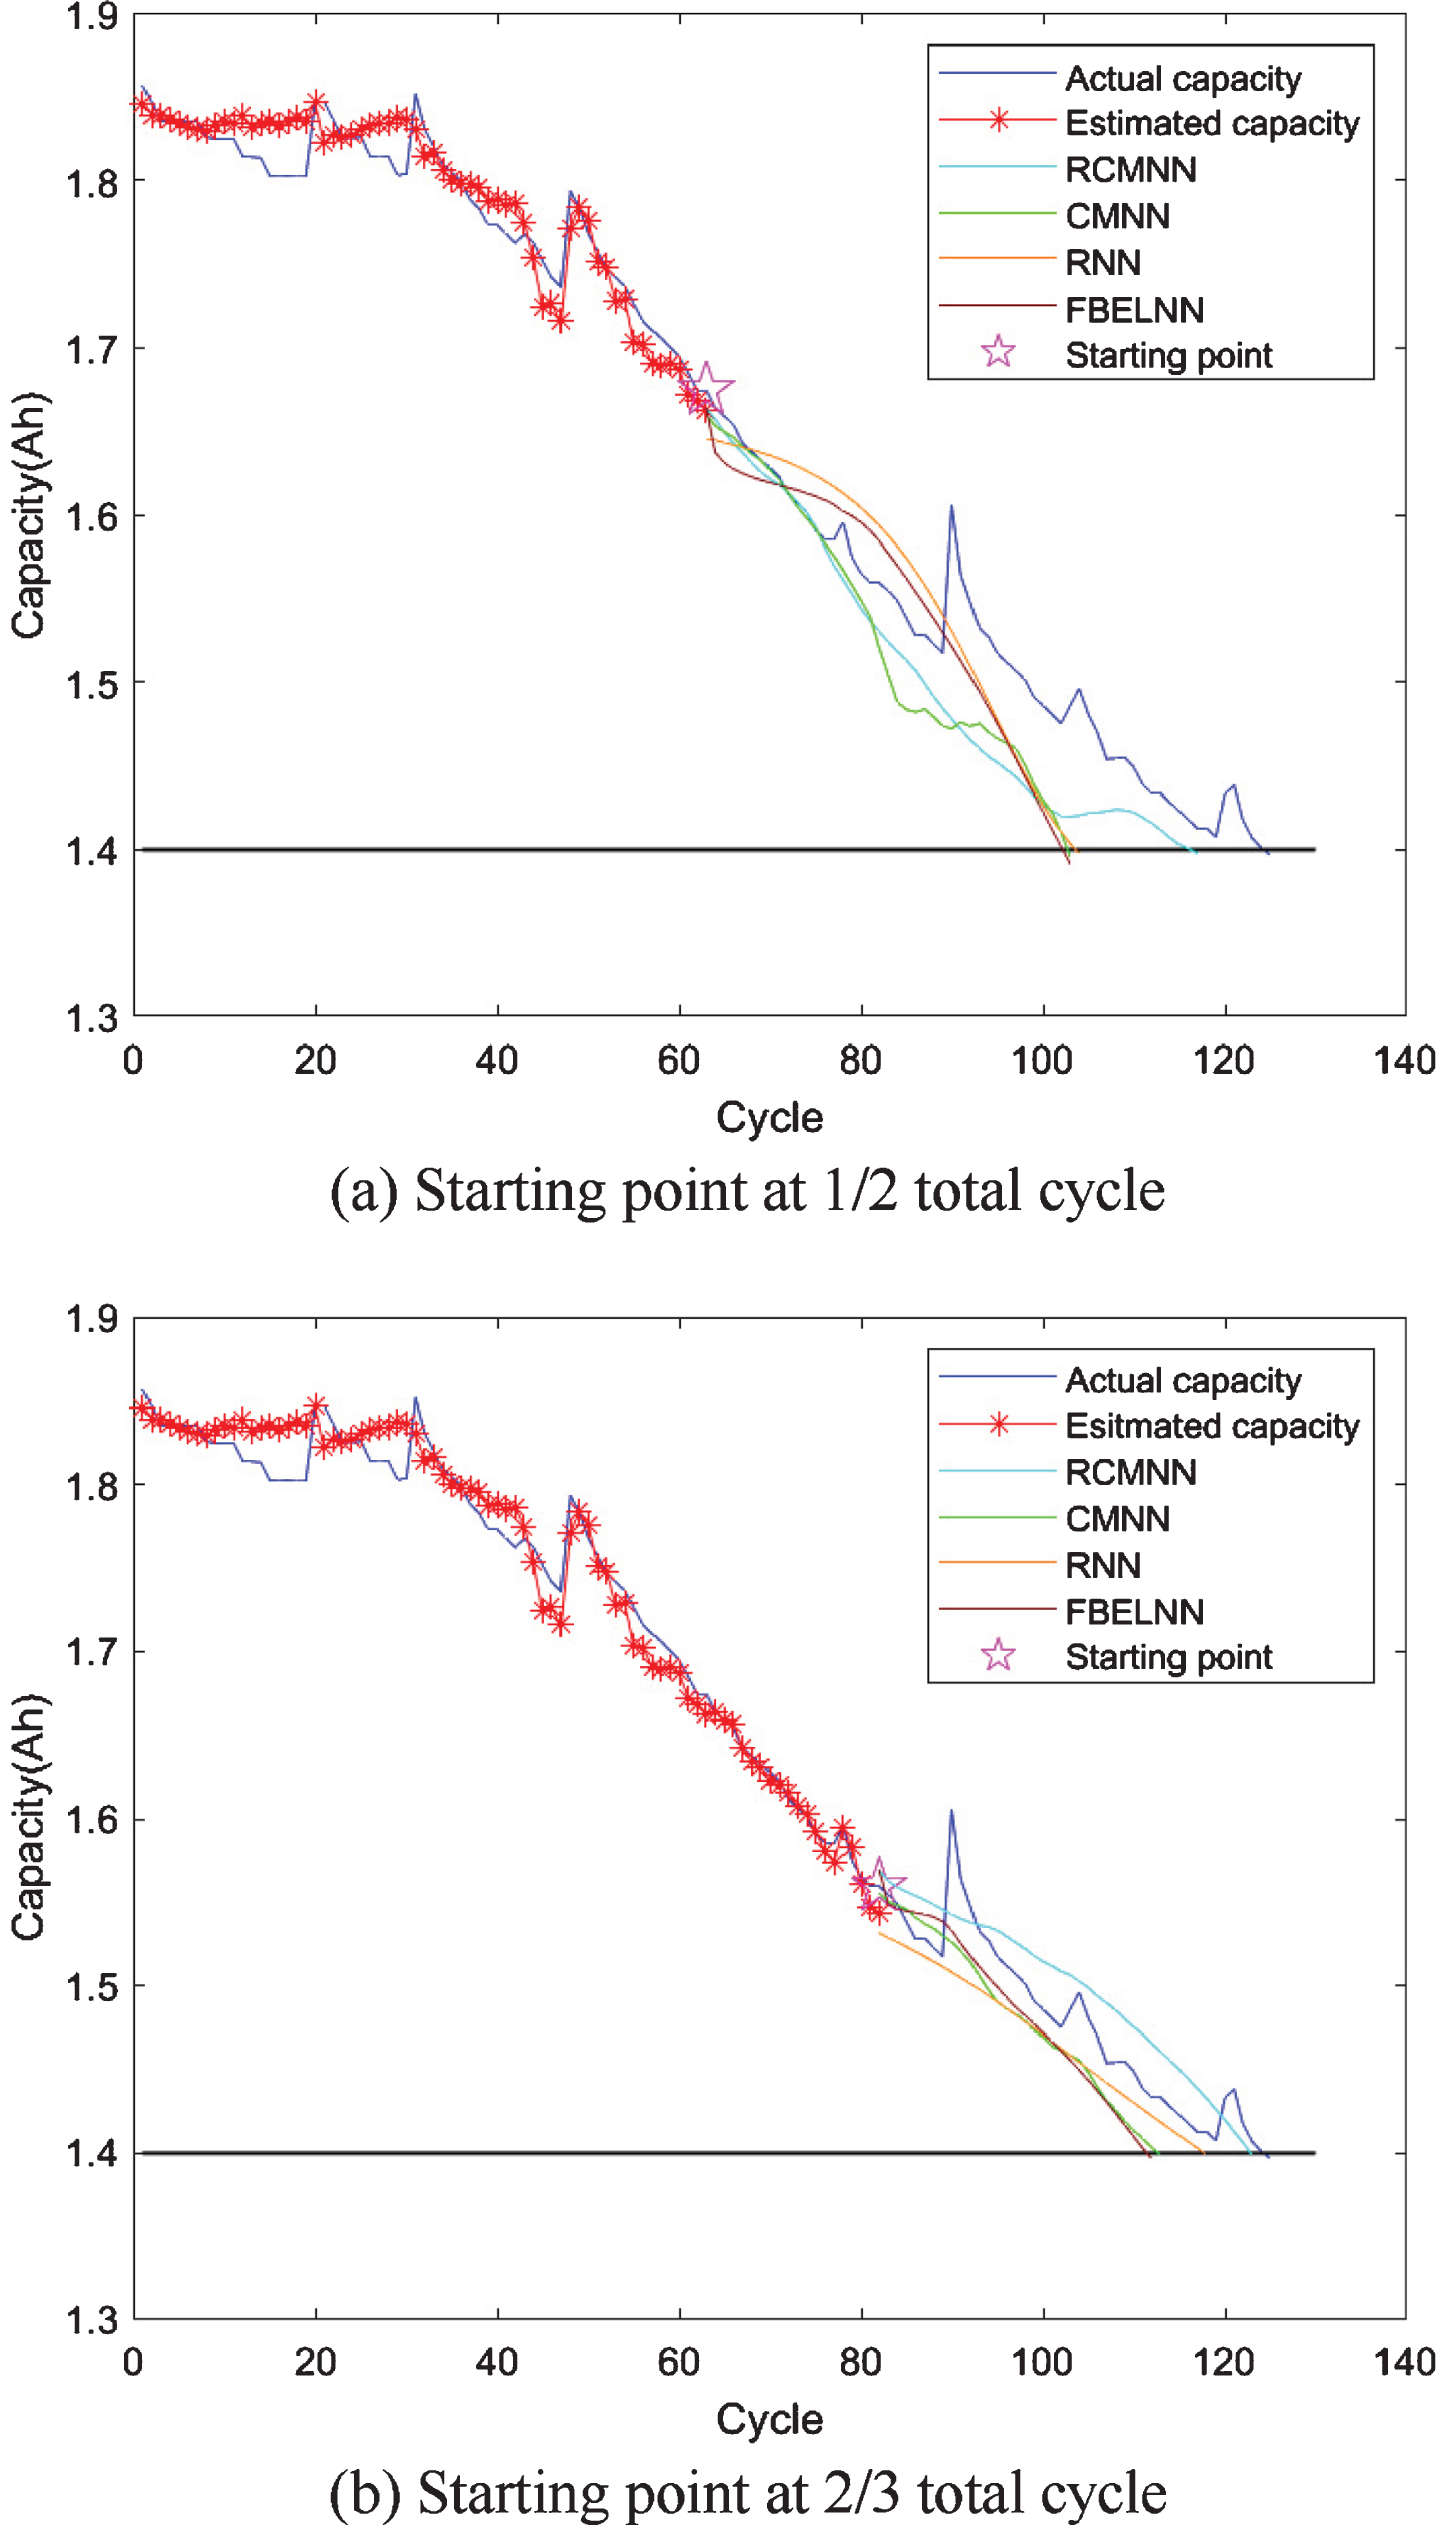
The results of RUL prediction for #5 battery.
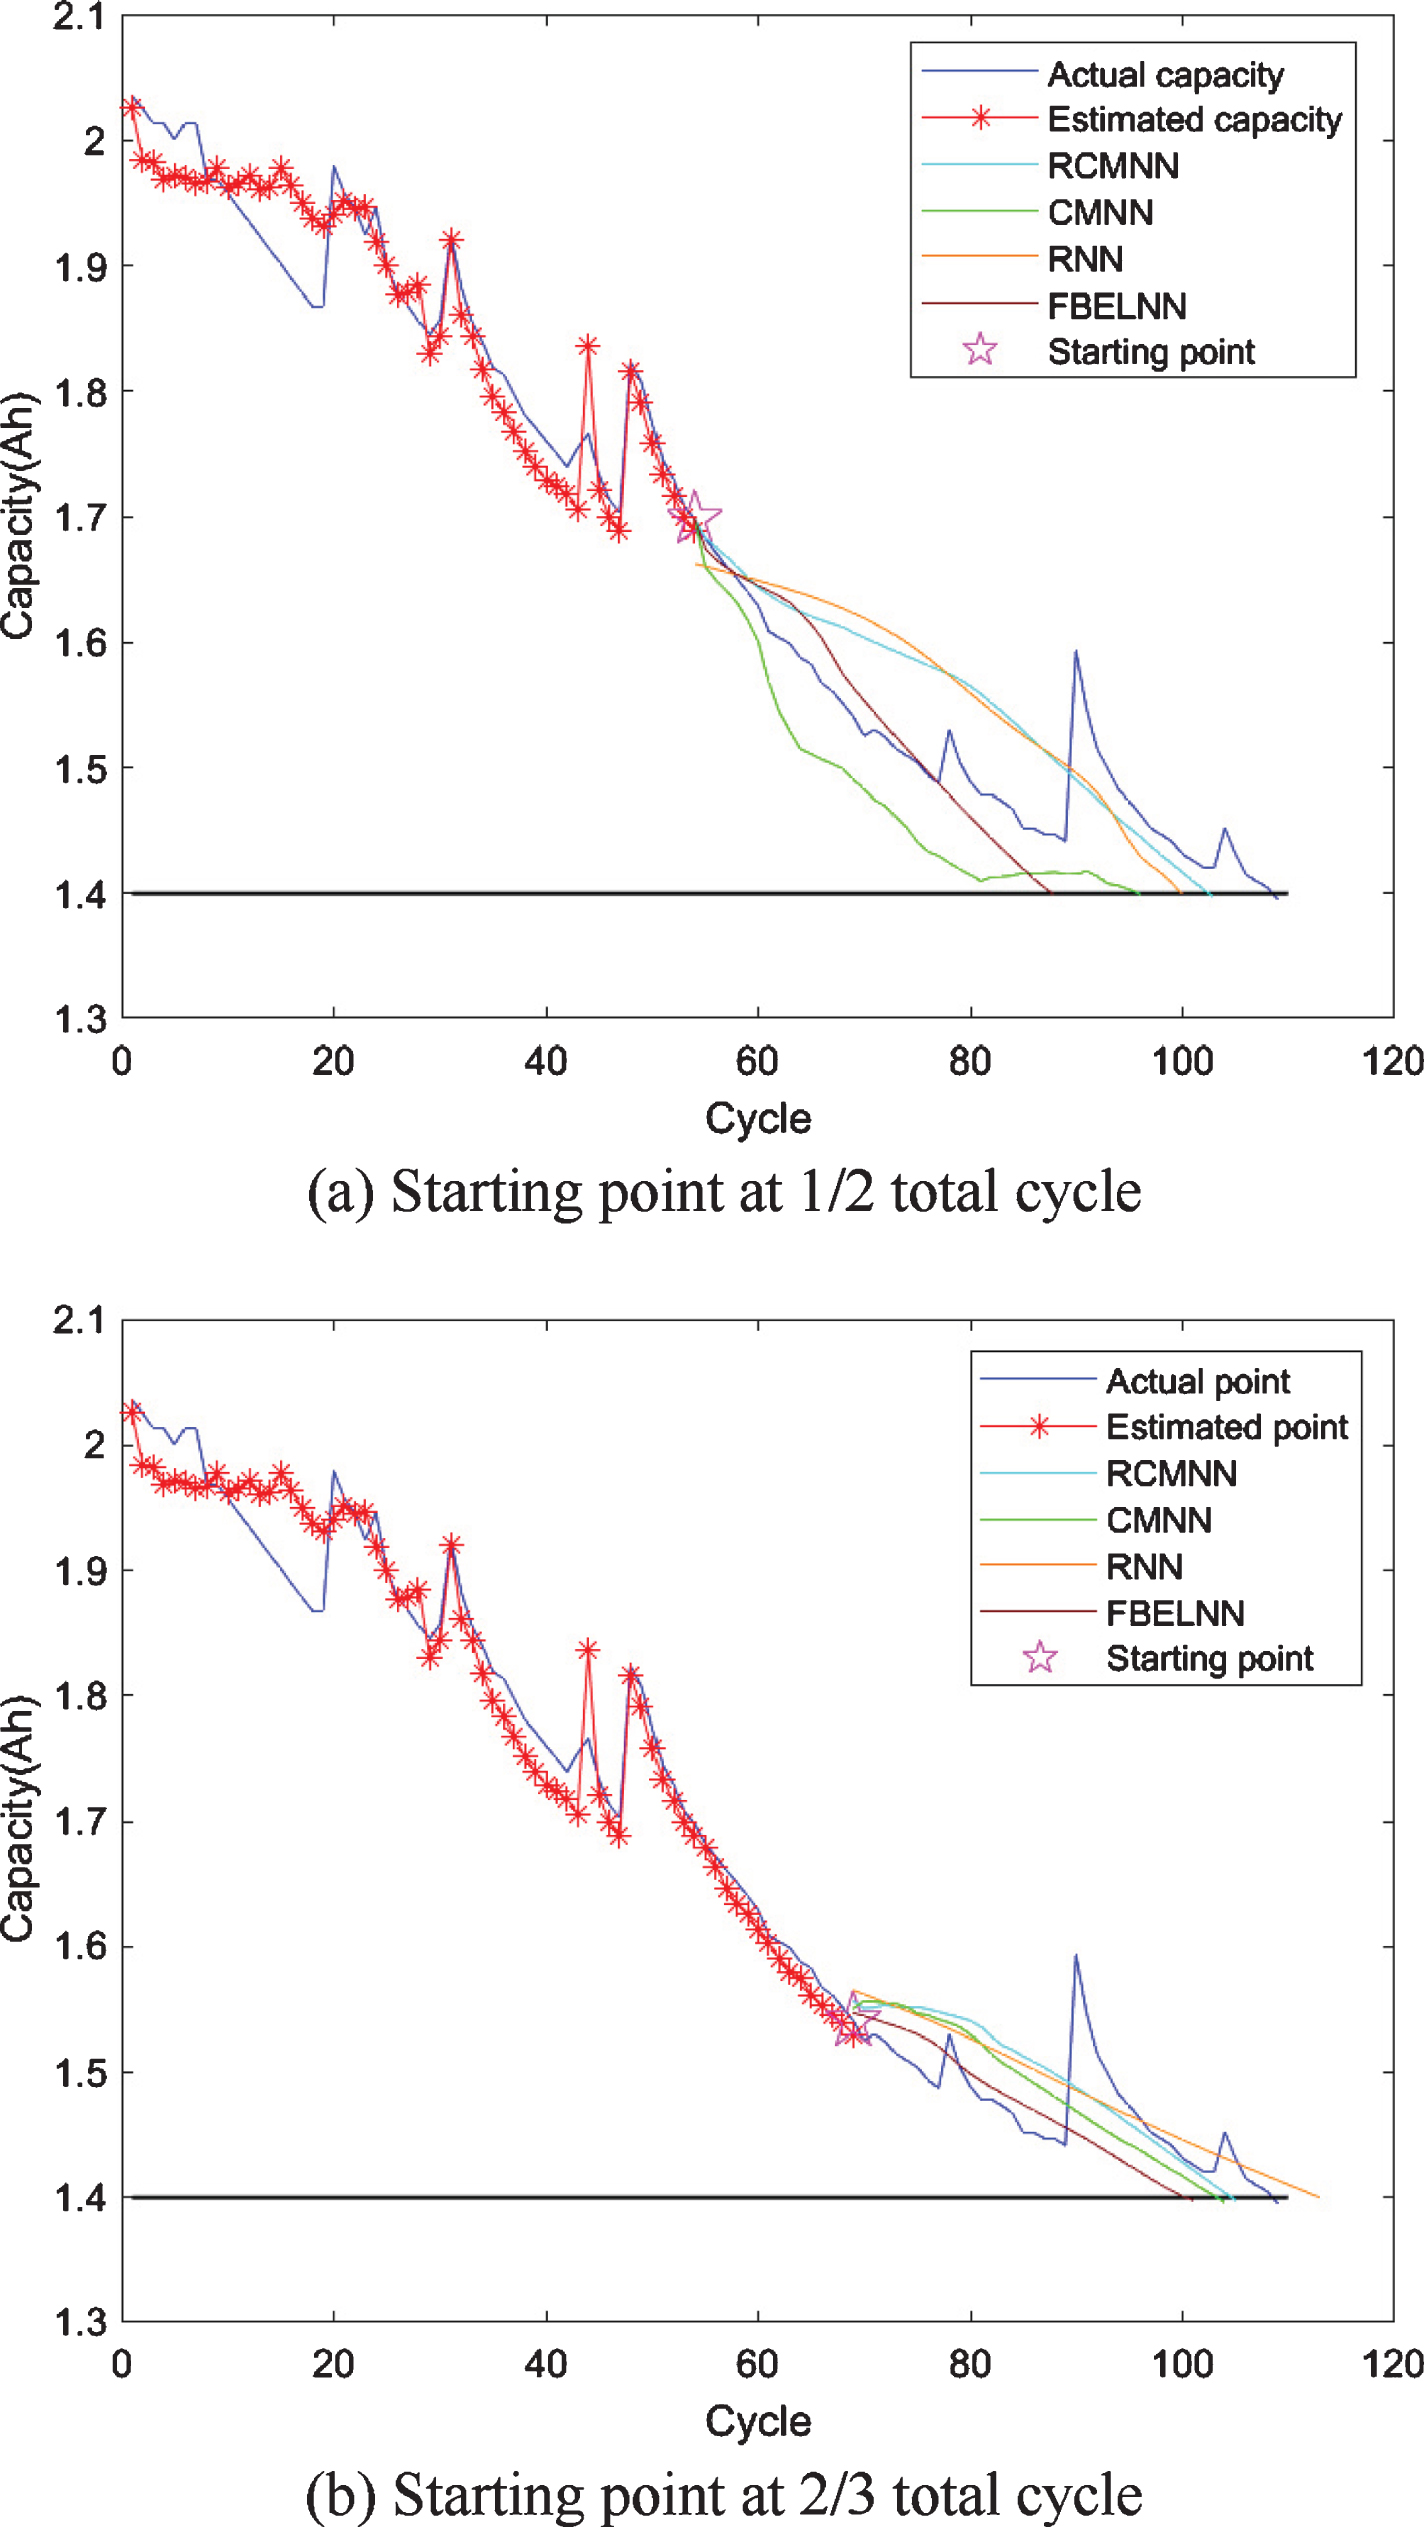
The results of RUL prediction for #6 battery.
The number of inputs to these neural network is 3. The number of layer and block of association memory space are respectively set as 5 and 6, the initial means are the median of each block, the initial variances are 1, and the initial weights are 0.1 for the RCMNN and the CMNN. The number of hidden layer neurons of the RNN is 30. The number of layer of sensory cortex space is 10 for the FBELNN. Function (35) is the prediction error (PE r ) between the real value and the predicted value. The results of RUL prediction errors are shown in Table 3.
The performance analysis results of SoH estimation
This study proposes a method to ensure the safety and stability of the ESS by online monitoring the charging curve for estimating SoH and predicting RUL. The features extracted from the charging curve in different charging phases can guarantee this method to be applied to different discharging conditions. The correlation analysis demonstrates a strong linear relationship between the extracted features and the lithium-ion battery capacity, which is important for the lithium-ion battery. The proposed method of SoH estimation can provide accurate result using DWT-PCA and the FBELNN. The special structure and parameters adaptive laws from the FBELNN can get more accurate results of SoH estimation than other neural networks. The structure of the RCMNN and the processes of again training can better predict the ageing trend of the lithium-ion battery, and the result of RUL prediction using the RCMNN is more accurate than other methods. Finally, these results show that the proposed method have good accuracy to help operators to analyze the working state of the lithium-ion battery.
In the next step, the Fujian Special Equipment Inspection and Research Institute will work with us for creating the new aging datasets of the lithium-ion battery. The discharging voltage and discharging current need to be further considered at the different temperatures and running conditions. And the electrochemical characteristics of the lithium-ion battery need to be also analyzed for improving the method of feature extraction. The proposed method can be used to provide important references for the workers to analyze and predict the SoH of a lithium-ion battery. The results of this study also allow more intelligent microgrids for energy management system. Moreover, the structure or parameter adaptive laws of the FBELNN and the RCMNN need to be amended for engineering application.
Footnotes
Acknowledgments
The authors appreciate the financial support in part from the Ministry of Science and Technology of Republic of China under grant MOST 109-2811-E-155-504-MY3, and from Technology Innovation Fund Support Project by the company of Powerchina Fujian Electric Power Engineering Co., LTD. under Grant DJ-ZDXM-2020-15.