
Abstract
The West Lake of Hangzhou, a world famous landscape and cultural symbol of China, suffered from severe air quality degradation in January 2015. In this work, Random Forest (RF) and Recurrent Neural Networks (RNN) are used to analyze and predict air pollutants on the central island of the West Lake. We quantitatively demonstrate that the PM2.5 and PM10 were chiefly associated by the ups and downs of the gaseous air pollutants (SO2, NO2 and CO). Compared with the gaseous air pollutants, meteorological circumstances and regional transport played trivial roles in shaping PM. The predominant meteorological factor for SO2, NO2 and surface O3 was dew-point deficit. The proportion of sulfate in PM10 was higher than that in PM2.5. CO was strongly positively linked with PM. We discover that machine learning can accurately predict daily average wintertime SO2, NO2, PM2.5 and PM10, casting new light on the forecast and early warning of the high episodes of air pollutants in the future.
Highlights
Compared with the gaseous air pollutants, meteorological circumstances and regional transport played trivial roles in shaping PM. CO had high relevance to PM2.5 and PM10. The predominant meteorological factor for SO2, NO2 and surface O3 was dew-point deficit while for CO was temperature. RNN is able to accurately predict daily average SO2 and NO2, using meteorological circumstances as inputs. RNN is able to accurately predict daily average PM2.5 and PM10 using meteorological circumstances and gaseous air pollutants as inputs.
Introduction
The West Lake, one of the top three most popular places to travel in China, nestles in the downtown Hangzhou and is famous for its picturesque scenery, having received more than 20 million tourists in 2018. In addition, the other two most popular places for tourism are the Great Wall and the Forbidden City in the capital city of Beijing. During the Spring Festival in February 2019, over 3.2 million sightseers had arrived at Hangzhou in the seven-day break to pay a visit to the West Lake. The West Lake also has been put on the list of the World Heritage Site since 2011 by the United Nations Educational, Scientific and Cultural Organization (UNESCO) as a symbol of Chinese cultural hallmark, because Hangzhou was one of the eight ancient capital cities of China and a lot of historic relics (e.g., numerous temples and pagodas of Taoism and Buddhism) had been left in the vicinity of the West Lake ever since the Qin dynasty two thousand years ago.
Due to the modernization of China, air pollution was riding roughshod throughout the nation and reaped a swath of 1.6 million premature deaths in 2017 [1]. The ambient fine particulate matter with an aerodynamic equivalent diameter less than 2.5 μm (PM2.5), the most public-concerning air pollutant, took a yearly death toll of 0.85 million in China, 2017 [2], whereupon regulation has become a top priority. With the enforcement of myriad efforts on mitigating air pollution, the nation’s air quality is getting better year by year [3]. However, the causes of PM2.5 during the most polluted days a few years ago remain unbeknownst and spawn ardent debates. Some asserted emphatically that the high episodes of air pollutants were primarily triggered by the increased secondary inorganic aerosols and the regional transport was not important [4–11]. Some shared an unswerving polar opposite viewpoint, inferring that regional transport was the predominant cause to elicit the high episodes [12–19]. Some authenticated that the meteorological conditions played a core role in the haze formation [20–34]. Some upheld that socioeconomic factors affected air pollutants greatly [35–39]. However, despite lots of eloquent analysis being listed above, there is still no mainstream conclusion that ubiquitously and quantitatively reveals the significance of aforementioned influential factors for air pollution.
Hangzhou, the host of Group of Twenty in 2016 and Asian Games in 2022 and one of the three pivotal cities in the Yangtze River Delta (YRD), has been inevitably steamrolled by severe wintry haze for decades due to its urbanization. The West Lake had also been embroiled with atmospheric pollutants, notably in January 2015. Therefore, in this work, we make a case study upon the West Lake of Hangzhou back in January 2015, when the heaviest haze occurred, as every detail of meteorology and air pollutants were recorded on an island in the middle of the West Lake. We believe it’s our obligations to make an in-depth analysis on the air pollution episodes upon the West Lake to quantify the influential factors of hibernal air pollutants for the good of millions of local inhabitants and tourists.
Owing to the inaccuracy of the conventional inventory-predicated air quality models [17, 40–41], machine learning is alternatively used to dig incisively into the formation processes of episodes. We cherry-picked Random Forest (RF) and Recurrent Neural Networks (RNN) as two approaches to analyze and predict the air pollutants upon the West Lake during the wintertime of 2015. RF [42, 43] is able to classify an object from an input vector and put the input vector down each of the trees in the forest without over-fitting. The Variable Importance (VI) [44], calculated by RF, rates the significance of each input in shaping the output. The higher the VI score of an input, the more significant the input is to the output. The sum of the VIs of all inputs is 100%. RNN takes the output of each time point as the input of the next time point, so it can use its internal memory to process sequences of inputs, which exhibits temporal dynamic behavior. The air pollution concentrations at a time-point and its previous concentration one hour prior may have some relevance, as the air pollutants physically dissipates and aggregates, and chemically react at curtain rates expressed by Arrhenius equation. Therefore, VI can quantitatively show and contrast the importance of all the meteorological or air pollutant variables in forming the episodes while the comparison of the predictive capabilities of RF and RNN can be used to test whether or not the air pollutants are related to the time series with one hour interval.
Methodology
The meteorology and air pollutants were measured and recorded hourly on the central island in the West Lake named Three Ponds Mirroring the Moon (30.239 °N, 120.145 °E) during wintertime of 2014/15, shown in Fig. 1. Meteorological data included temperature (T), precipitation, atmospheric pressure (AP), wind speed (WS), wind direction (WD), hydrostatic energy [45], dew-point, dew-point deficit (DPD), water vapor pressure (WVP) and relative humidity (RH). Air pollutants included SO2, NO2, CO, O3, PM2.5 and PM10. The configurations of RF and RNN are fine-tuned to get the best outcome. The daily average concentration is defined as the average of 24 values measured hourly in a day.

(a) The red pentagram denotes the measuring point (30.239 °N, 120.145 °E); (b) Photo of the West Lake, taken by our research group, circa January 2015.
Variable importance
The Variable Importance (VI) for hourly air pollutants in January 2015 are listed in Fig. 2. Daily average trends of the air pollutants are shown in Fig. 3. As Fig. 2 shows, the predominant meteorological factor for SO2, NO2 and surface O3 was dew-point deficit. The PM10 had the strongest correlation with SO2. The influence of dew-point deficit on NO2 was smaller than that on SO2 or surface O3. Surface O3 was strongly associated with NO2, because of the titration effect (NO2 + O2⇄NO+O3). Moreover, the proportion of nitrate in PM10 was higher than that in PM2.5. The reigning meteorological factor for CO was temperature, followed by atmospheric pressure. CO had highly relevance to PM2.5. CO was reportedly significantly linked with PM2.5 in wildfires [46]. However, as a national park, fires are strictly forbidden around the West Lake and there was no any wildfire reported in January 2015. What role CO participates in the formation of PM and whether CO is the precursor of PM need to be further demonstrated. It’s worth noting that the predominant meteorological factor for PM2.5 was temperature while for PM10 was dew-point deficit, because CO was mostly impacted by temperature while SO2 and NO2, the main precursors of PM10, were influenced by dew-point deficit. To wrap up, the gaseous air pollutants were far more significant than the meteorological conditions combined in shaping PM2.5/PM10. The levels of PM2.5/PM10 were mainly influenced by the ups and downs of gaseous air pollutants rather than meteorological conditions. Moreover, dew-point deficit, water vapor pressure (WVP) and relative humidity (RH) are all related to the atmospheric moisture. Here, we demonstrate that dew-point deficit is more important than RH and WVP in shaping wintry atmospheric pollutant. Precipitation had a certain impact on air pollutants, as the average of PM2.5, PM10, SO2, NO2 and CO of eight rainy days in January 2015 were 67.3μg/m3, 79.6μg/m3, 13.8μg/m3, 47.9μg/m3 and 1.09 mg/m3, respectively, while the monthly average of PM2.5, PM10, SO2, NO2 and CO were 83.2μg/m3, 105.8μg/m3, 18.8μg/m3, 52.2μg/m3 and 1.26 mg/m3, respectively.

Variable Importance for each air pollutant: (a) SO2; (b) NO2; (c) CO; (d) O3; (e) PM2.5; (f) PM10.

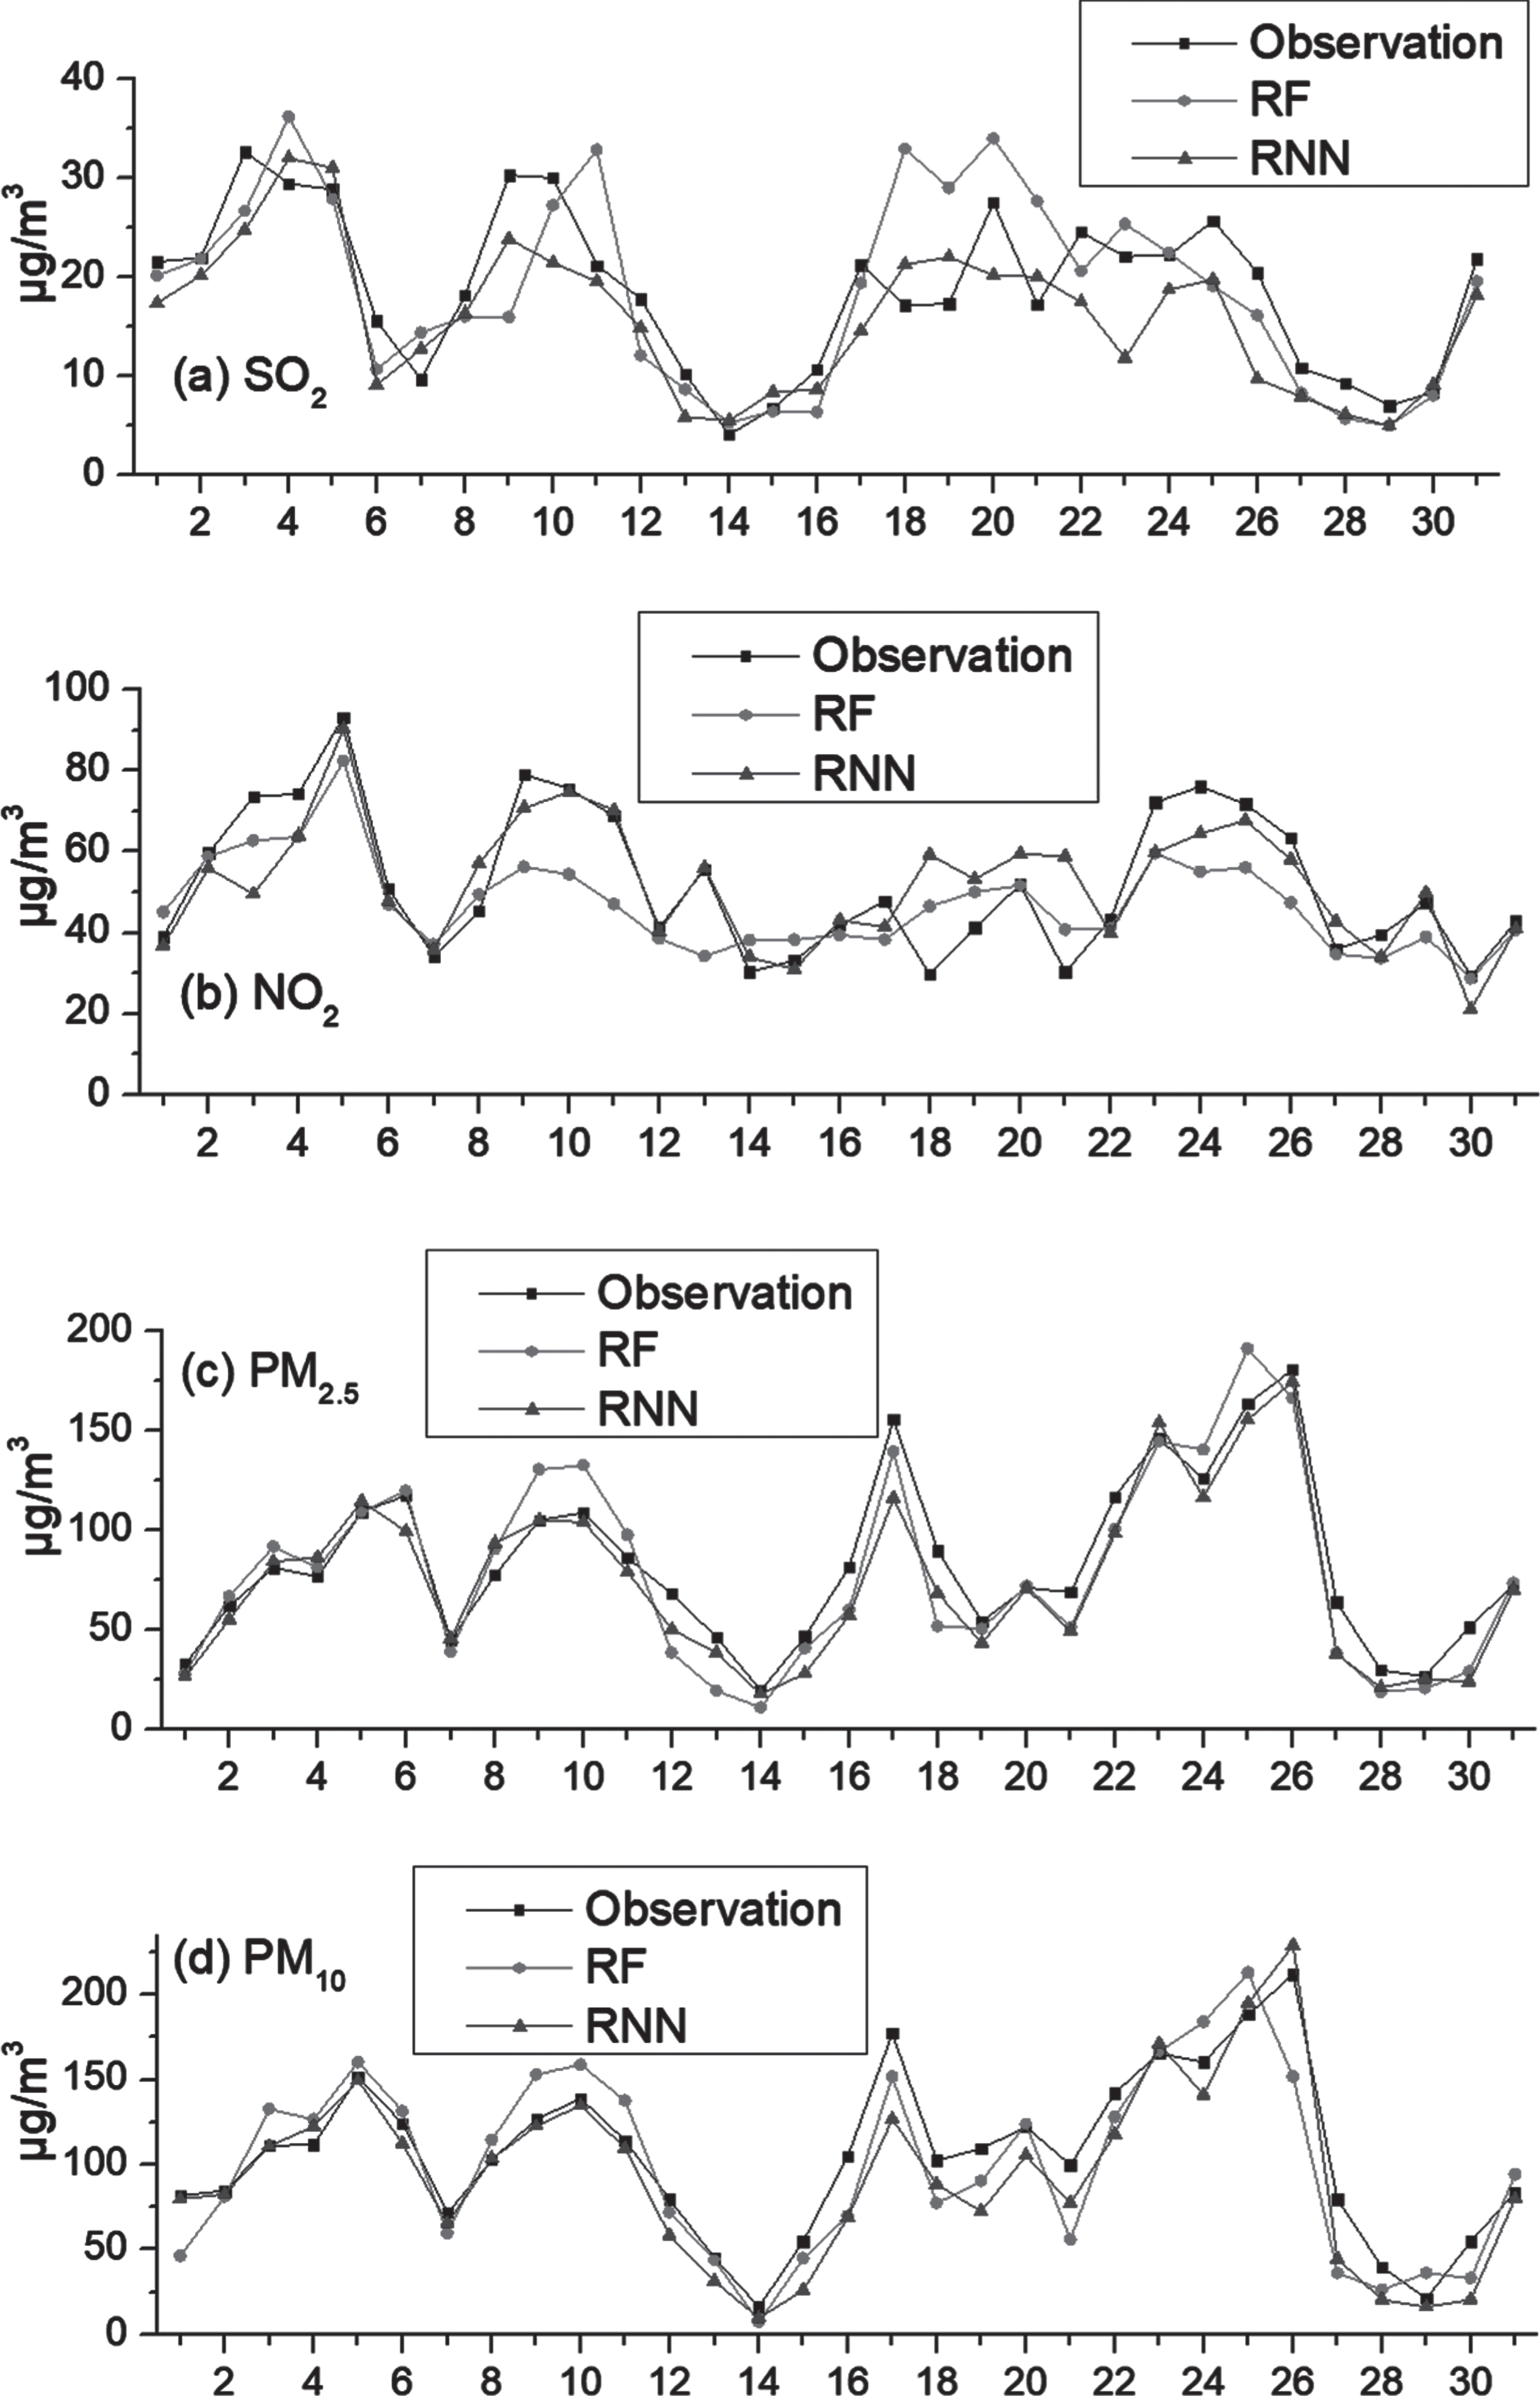
Daily average observed air pollutants in January 2015 upon the West Lake.
In this section, RF and RNN are used to predict hourly air pollutants in January 2015. The testing period is one day while the training period is the rest 30 days of January. The meteorological conditions, including T, AP, WS, WD, DPD and RH, are set to be six variables of inputs, to predict hourly SO2 and NO2. Calculating daily average NO2 offsets the O3-NO2 titration effect. The six aforementioned meteorological factors and the four gaseous pollutants (SO2, NO2, O3 and CO) are used to predict hourly PM2.5 and PM10. Figure 4 shows the results of the simulation. Pearson correlation coefficient (R) and Root Mean Square Error (RMSE) are used as two statistic indicators to evaluate the performance of RF and RNN, given in Table 1. As Table 1 indicates, RNN performs better than RF, because RNN is related to temporal contextual information [47]. In addition, the performance of RF and RNN are better than that of inventory-based atmospheric model [48–50], indicating the superiority of machine learning. As for RMSE, the simulation of SO2 is the best among four species of air pollutants. The simulation of NO2 is the second best. RNN clutches the ebb and flow of SO2 and NO2 well using only meteorological circumstances as inputs. For instance, RNN successfully seizes the maximum of NO2 on Jan.5 and Jan.13, and the minimum of SO2 on Jan.14. As for R, the simulation of PM shows the high accuracy, indicating RF/RNN catch the trends well.
The performance of RF and RNN for simulating SO2, NO2, PM2.5 and PM10.
Performance of RF and RNN
The number of days with PM2.5 over 120μg/m3 and PM10 over 160μg/m3 was 5 (Jan.17, 23, 24, 25 and 26) in January 2015, which we define as the high episodes. We use RNN to analyze the cause of high episodes. The high episodes might be triggered by two causes: regional transport or the increase of gaseous air pollutants. When using the meteorological conditions and gaseous air pollutants as inputs, if machine learning fails to catch the trend, the high episode was caused by long-range transport; otherwise, it’s caused by increase of gaseous air pollutants. As Fig. 4 indicates, RNN catches all the maximums in the high episodes, indicating the increase of gaseous air pollutants was the main reason for the high episodes and regional transport was insignificant, consistent with the viewpoints of Guo et al. (2014), Huang et al. (2014) and Shen et al. (2015).
Conclusion
Two machine learning models are used to analyze the Variable Importance and predict the concentration of air pollutants in an environmental monitoring station in Hangzhou. We find that PM was mainly influenced by the gaseous air pollutants, which were SO2, NO2 and CO. The impacts of the meteorological circumstances and region transport were insignificant to the ebb and flow of PM. Dew-point deficit was the most critical parameter among the meteorological conditions in shaping SO2, NO2 and O3. The strongly positive association between CO and PM can be ascribed to the same emission sources. The possible chemical link between CO and PM requires further experimental verification. We substantiate that RNN can accurately predict daily average SO2/NO2 using only meteorological circumstances as inputs and PM2.5/PM10 using meteorological circumstances and gaseous air pollutants as inputs.
Authors declare there is no conflict of interest