
Abstract
Accurately diagnosing power transformer faults is critical to improving the operational reliability of power systems. Although some researchers have made great efforts to improve the accuracy of transformer fault diagnosis, accurate diagnosis of multiple faults is still a difficult problem. In order to improve the accuracy of transformer multiple faults diagnosis, a multiple fault diagnosis method based on interval fuzzy probability is proposed. Different from the previous methods which provide single-value probability, this method use probability interval to represent the occurrence degree of various possible faults, which can objectively predict the potential faults that occurring in a transformer and provide a more reasonable explanation for the diagnosis results. In the proposed method, the interval fuzzy set is used to describe the evaluation of state variables and the interval fuzzy probability model based on interval weighted average is applied to integrate the fault information. The representative matrix of fault types based on fuzzy preference relationship is established to estimate the relative importance of each gas in the dissolved gases. The proposed method can provide the probability of probable faults in transformer, help engineers quickly determine the type and location of faults, and improve the accuracy of diagnosis and maintenance efficiency of transformer. The effectiveness of the method is verified with case studies.
Keywords
Introduction
Power transformer plays the role of power transmission and voltage variation. It is one of the most important equipment in power system. Any accidental failure of power transformer may lead to interruption of power supply, cause great economic loss, and affect the stability and reliability of the whole power system. Therefore, it is very important to find potential faults of power transformer as early as possible and improve the accuracy of fault diagnosis [1–4].
In order to find out the potential faults in power transformer as early as possible, the methods of power transformer status assessment has been studied in the literature [5–8]. This kind of state-based methods are mainly used in transformer fault diagnosis, residual life prediction, maintenance strategy formulation and asset evaluation [9–11]. In addition, some improved ratio methods and dissolved gas analysis (DGA) methods have been proposed successively, which take into account the uncertainty of variables and overcome the shortcoming of traditional ratio method with narrow boundary. However, there are still some defects, such as the default fault is single-fault, the accuracy is not high, multiple faults can not be diagnosed. As a matter of fact, the power transformer is subjected to the combined action of electrical stress, thermal stress and external environment, which often reflects the characteristics of multiple faults [4, 12]. In order to improve the accuracy of the diagnosis results, the approaches of ratio codes, fuzzy logic, Bayesian network and intelligent algorithm are developed and applied to the fault diagnosis of power transformer. The improved ratio codes method is more detailed in the demarcation of ratio boundary [13, 14], and the fuzzy logic technique is more reliable in multiple fault diagnosis and fault classification [15, 16]. Fuzzy logic methods can establish the complex and nonlinear relationships between DGA gases and transformer faults [17]. Bayesian belief network can be used to characterize the probabilistic cause-effect relationships among their individual states, which can provide an convincing indication of transformer fault diagnosis [18]. Bayesian network model can integrate expert knowledge and learn patterns from data, which is helpful to improve the accuracy of diagnostic result [19]. Intelligent algorithm has advantages in selecting optimal association rules, learning existing diagnostic experience and reducing attribute rules, which can overcome the lack of sample data and provide relatively accurate transformer fault diagnosis results [17, 21]. In addition, some mathematical models [22, 23] and data-driven approaches [24–26] are applied to fault diagnosis. The recent advances in fault diagnosis based on data-driven realization are reviewed in [25], and some methods are described in detail. In order to improve the fault detection rate, a novel parity relation-based data-driven approach was developed in [26]. Compared with the traditional parity relation-based method, the method proposed in [26] can not only deal with strong nonlinear system, but also the generated residuals can significantly improve the sensitivity to small faults, thus improving the fault detection rate.
Although a series of power transformer fault diagnosis methods have been put forward, and have made great progress in improving the accuracy of fault diagnosis. However, under the same conditions, some diagnostic methods still have different interpretations for the same transformer [12, 23]. The main reasons can be attributed to insufficient fault samples, crisp standard thresholds and the difficulty of precisely detect the multiple potential faults [19, 23]. With the improvement of manufacturing technology, transformer fault has become the small probability event. As a result, it is difficult to get convincing results with limited databases, although there are many data analysis methods used for various analyses of transformer status [27, 28]. When the standard threshold is represented by a crisp number, the state value of fault on the threshold boundary can easily lead to the same fault state but different diagnosis results. In addition, it is not reasonable that the default transformer fault is a single fault or a single-value is given as the fault diagnosis result. Especially for transformers with multiple potential faults, the diagnosis method of default transformer fault as a singled-fault often leads to misdiagnose, which is not helpful for making maintenance plans.
Based on the above considerations, a new method for multiple fault diagnosis of power transformer is proposed in this paper, which is based on the degree of interval fuzzy possibility. Different from previous methods, this method does not provide the single-value probability for a certain type of transformer fault, but gives the possible interval probability of each type of transformer fault, which can objectively reflect the uncertainty of transformer fault diagnosis. Based on expert experience and characteristics of dissolved gas, fuzzy interval is used to describe the state and criterion variables, and the representative matrix of fault types based on fuzzy preference relationship is established. Then, an interval fuzzy probability model which can be used to synthesize multiple interval variables is established. The interval fuzzy probability model is used to estimate the interval probability of all possible transformer faults.
To the best of our knowledge, the interval possibility method has not been used in the fault diagnosis of power transformer, and little work focused on the fault diagnosis of power transformer with multiple potential faults. The proposed method can objectively estimate the probability of transformer fault with the help of interval fuzzy value, which overcomes the shortcoming that most traditional diagnosis methods assume only one fault and ignore several potential faults. Therefore, it can provide a more reliable diagnosis method for transformer fault diagnosis. This paper is organized as follows. In section 2, some fundamental notions for power transformer fault diagnosis is reviewed. In section 3, the framework for fault diagnosis of power transformer is proposed. In section 4, case studies are used to verify the proposed interval fuzzy probability method. At last, a conclusion is presented in section 5.
Preliminaries
To illustrate the approach in this paper more clearly, this section reviews some fundamental notions of interval fuzzy [29], interval weighted average [30] and DGA of power transformer [3, 7] have been provided in previous work.
Interval fuzzy
In some cases, due to limited data, some parameters of the uncertain structure can be treated as interval variables. Interval fuzzy number is a measure of variables and parameters, which can effectively deal with the inexact and uncertain data [31].
Let A1 = [a1, b1] and A2 = [a2, b2] be two intervals, then the operational principle of A1 and A2 as following: A1 + A2 = [a1 + a2, b1 + b2]; A1 · A2 = [a1 · a2, b1 · b2]; A1/A2 = [a1/b2, b1/a2].
In addition, the possibility-degree formula introduced by Xu and Da [32] is often used to compare and rank interval fuzzy numbers.
Because the information about the preference degree between any two alternatives is vague, the appraiser may not be able to estimate his/her preference relations over alternatives with exact numerical values. In such cases, it is very suitable to express preference relations with interval values. The concept of interval fuzzy preference relation is as follows:
When comparing alternatives in preference relations, an appraiser may provide inconsistent preference information due to the complexity of the problem, time pressure, or lack of knowledge about problem domain. Consistency is of great importance in preference relations because inconsistent information can lead to incorrect results. In order to avoid undesirable conclusions, it is necessary to test whether the preference relationships given by the appraisers are consistent or not. Several studies on the consistency of fuzzy preference relation are reported in the literature, among which the multiplication consistency fuzzy preference relation is the most common one.
Eq. (2) is used to determine whether the interval fuzzy preference relation matrix satisfies the consistency of multiplication, which is much simpler than the linear programming method.
The weighted average is a commonly used approach for multiple attribute and multiple criteria evaluation. Based on Zadeh’s extension principle [33], several fuzzy weighted average methods have been presented in the literature. The definition of fuzzy weighted average can be briefly expressed as follows:
Suppose the corresponding intervals of the attribute or criteria is expressed as an interval fuzzy number A
i
= [a
i
, b
i
] , (i = 1, 2, ⋯ , n), and the intervals of the relative weights is
The computational of interval weighted average can be carried out as follow: Sort the attribute or criteria of A
i
= [a
i
, b
i
] (i = 1, 2, ⋯ , n) in ascending order, i.e., a1 ≤ a2 ≤ a
i
≤ a
n
,b1 ≤ b2 ≤ b
i
≤ b
n
; Sort the relative weights of w
i
(i = 1, 2, ⋯ , n) in the same ascending order, i.e., Calculate the lower bound of interval weighted average. The calculation process is as follows: Step 1 For A
i
and w
i
, choose a1,a
n
, Step 2 Sort Step 3 Repeat Step 1 to calculate the new weighted average Step 4 Obtain the minimum value of f (A
i
, w
i
) (i = 1, 2, ⋯ , n), i.e., the lower bound min {f (A
i
, w
i
)}. Calculate the upper bound of interval weighted average. Similarly, the calculation process is divided into four steps as follows: Step 1 For A
i
and w
i
, choose b1,b
n
, Step 2 Sort Step 3 Repeat Step 1 to calculate the new weighted average Step 4 Obtain the maximum value of f (A
i
, w
i
) (i = 1, 2, ⋯ , n), i.e., the upper bound max {f (A
i
, w
i
)}.
In reality problems, DGA and ratio approaches have been widely recognized as convenient diagnostic techniques for power transformer faults [34–36]. However, there are still some detects in the traditional DGA method. For example, the misdiagnosis rate is high when the measured and calculated gas values are close to the specified boundary threshold. When the potential failure of power transformer occurs under the action of thermal stress or electrical stress, the oil will decompose and produce a large number of gases dissolved in the transformer oil. These dissolved gases mainly include hydrogen (H2), methane (CH4), ethane (C2H6), ethylene (C2H4), and acetylene (C2H2), which can be used for transformer health condition assessment and fault type analysis. Under normal operation condition without fault, the transformer mineral oil will decompose to produce a small amount of dissolved gases. However, due to the long-term exposure of transformers to electrical, mechanical and thermal stresses, gas anomalies occur when potential faults. Therefore, the generation of dissolved gases are related to the type of faults. Combined with previous research, in this work the classification of fault types is defined in Table 1.
Fault types and their symbols
Fault types and their symbols
Since each type of fault produces many different dissolved gases rather than a single one, the concentration and composition of these dissolved gases can be used to evaluate and diagnose the type of fault. For example, according to the energy distribution and the solubility degree of saturation in the fault district, methane (CH4) and ethane (C2H6) are the main gases in the low-temperature thermal fault, while ethylene (C2H4) and ethane (C2H6) are the main gases in the high-temperature thermal fault. According to the fault types, the relationship between the fault types and the dissolved gases are shown in Table 2, where “★” represents the major gas concentration and “★” represents the secondary gas concentration.
Relationship between fault types and dissolved gases
Obviously, the characteristics and composition of some key gases produced by each fault type need to be thoroughly analyzed to accurately identify the classification of potential faults in a transformer.
The multiple fault diagnosis of power transformer is always a difficult problem [4]. In addition to the fact that the fault of power transformer is a small probability event and the number of fault samples is small, it is also difficult to establish an accurate fault diagnosis model of power transformer. Fuzzy number and interval probability are suitable to deal with multi-variable modeling problems with imprecise and uncertain variables [37]. Therefore, a multiple fault diagnosis method of power transformer based on fuzzy number and interval probability is developed. The procedure of the proposed approach is shown in Figure 1 and the detailed steps of the approach are described as follows.
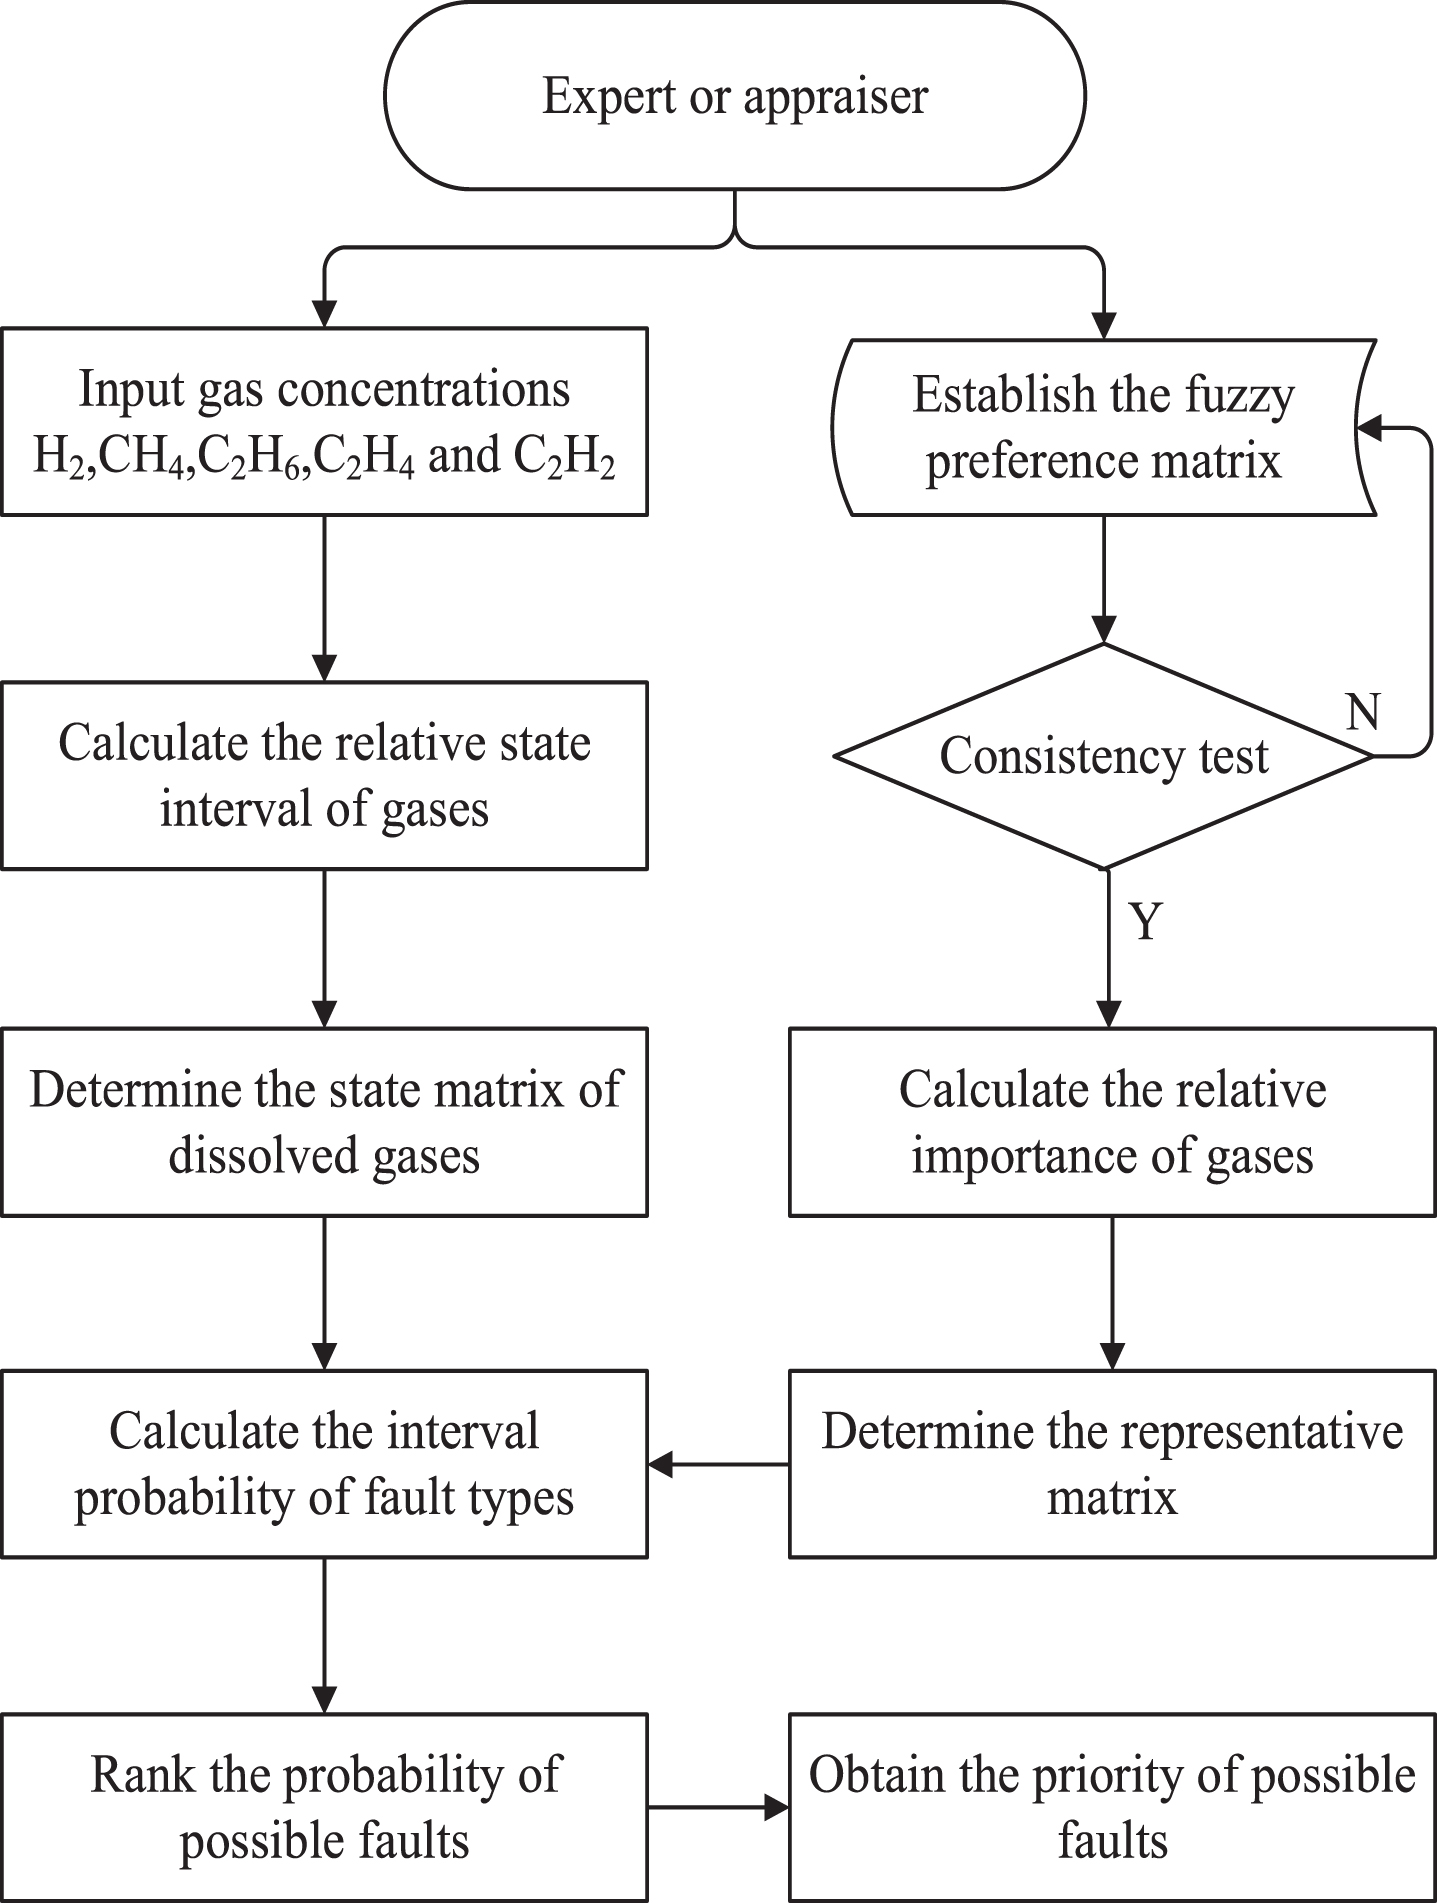
Flowchart of the proposed approach for multiple fault diagnosis.
Dissolved gas analysis is one of the most popular and commonly used methods for power transformer fault diagnosis. However, the dissolved gas of power transformer contains a series of variable index parameters, and it is not accurate to use a single value to express its state value. Therefore, first of all, unify the variables and convert all the measured data to their relative state value, with values between 0 and 1. Then, considering the state error, the relative state value is extended from a single value to an interval.
The state levels of dissolved gases provided by IEEE standards and CIGRE recommendation are shown in Table 3 [6]. When the concentration of dissolved gas is within the set range, the corresponding state level is a fixed value. Let s
il
be the initial value of the set range, s
iu
be the limit value of the set range, and si0 be the actual data which is the state value of the gas i. Then the relative state value given by gas i can be defined as follows:
The state levels of dissolved gases
However, when the gas concentration is close to the threshold boundary, it is difficult to accurately determine the state level of dissolved gas. Therefore, it is more accurate to represent the state level corresponding to the concentration of the dissolved gas as an interval rather than a single value. The state value given by gas i can be expressed as follows:
Therefore, the state matrix of dissolved gases can be expressed as
Since the dissolved gas and its components are different for each kind of fault, the importance of each gas in the dissolved gas is different in the process of determining the fault type. In order to improve the accuracy of diagnosis results, the representative matrix of various fault types based on fuzzy preference relations is constructed.
Establishing the fuzzy preference matrix
For each type of fault F
t
(t = 1, 2, ⋯ , m), the interval fuzzy preference matrix is constructed. Each matrix element represents the relative importance of one gas to another and is represented by an interval-valued fuzzy number. The importance of gas i over gas j under a certain criterion represented by
In order to obtain accurate and objective diagnostic results, it is necessary to analyze the consistency of interval fuzzy preference matrix. In the literature, various types of transitivity properties have been introduced to verify the consistency of fuzzy preference relations, such as weak transitivity, max-max transitivity, max-min transitivity, additive transitivity and multiplicative transitivity, etc. Among these transitivity properties, multiplicative transitivity is the most suitable property for verifying the consistency of a fuzzy preference relation [38]. In this work, the formula method proposed by Genç et al. [29] is used for the consistency test. This method can be accurately verify and easily calculate the consistent interval fuzzy preference relation without solving any linear programming models. According to Eq. (2), the consistency test matrix of the interval fuzzy preference relation matrix
If
Calculating the relative importance of dissolved gas
By means of the interval fuzzy preference matrix which satisfies the consistency, the relative importance of the dissolved gases for each type of fault is given.
Let
Firstly, the value of the fuzzy synthetic extension with respect to the i-th dissolved gas is defined as:
Secondly, the relative importance of gas i is defined as
Obviously, the value of the fuzzy synthetic extension E i (i = 1, 2, ⋯ , n) which represents the relative importance of the gas i is still an interval fuzzy value.
According to the relative importance of dissolved gases in each fault, the representative matrix of fault types is determined. Let E
ti
(1 ≤ t ≤ m ; 1 ≤ i ≤ n) be the relative importance of gas i in the fault F
t
, then the representative matrix of fault types can be expressed as:
When the measured or calculated value is close to the boundary threshold of the specified condition, it is difficult to give an accurate evaluation value [39]. Therefore, instead of providing a single-value probability for each types of faults, the interval weighted average is used to calculate the probability interval of possible fault types. The model of calculate the interval probability of fault types as follows:
After the above integrated evaluation process, the probability of various possible faults in the transformer is expressed as the interval with different width. Then the possibility-degree, i.e. Formula (1), is used to determine the priority of two interval fuzzy numbers. The probability of possible fault F
t
(1 ≤ t ≤ m) can be defined as:
Case 1
The following example is a multiple faults diagnosis problem of power transformer, in which the data of gas concentration and fault types are obtained from [15]. As reported in [15], it is really difficult to accurately identify the multiple latent faults occurring in power transformer. In addition to the lack of fault samples and test data, most of the existing diagnostic methods are single-value diagnostic methods, which cannot distinguish the multiple faults by a single value. For this reason, the fuzzy interval is used to measure the sample and experimental data, and the interval rather than a single value is used to represent the probability of transformer fault. Suppose that the classification of power transformer fault types include: thermal faults of T > 700 o C (T3), thermal faults of 300 < T < 700 o C (T2), thermal faults of T < 300 o C (T1), partial discharge (PD), low energy discharge (D1) and high energy discharge (D2). Each fault type of dissolved gas consists primarily of hydrogen (H2), methane (CH4), ethane (C2H6), ethylene (C2H4) and acetylene (C2H2). For the power transformers with multiple potential faults described in [15], the concentration of dissolved gas in them is shown in Table 4.
The concentration of dissolved gas (μL/L)
The concentration of dissolved gas (μL/L)
According to the established model, the interval fuzzy preference relation matrix corresponding to each fault type is constructed to measure the relative importance of dissolved gas, and the interval weighted average is used to calculate the interval probability of all types of possible faults. The detail steps to diagnose the fault type of power transformer can be described as follows:
The concentration of dissolved gas is an important indicator of transformer health, which is often used to evaluate the overall health of transformers. When the concentration of dissolved gas is within the set range, the corresponding state level is a fixed value. However, this is not always consistent with the actual situation, especially when the concentration of gas is close to the threshold value, it is difficult to accurately determine the state level. Therefore, the state value of dissolved gas is suitable represented as an interval.
According to the concentration of dissolved gas in Table 4, the state matrix of dissolved gases can be calculated. By means of Eq. (6)-(8), the state matrix of dissolved gases is expressed as follows:
Firstly, establishing the interval fuzzy preference relation matrix. For example, the interval fuzzy preference relation matrix
Secondly, calculating the consistency of
Obviously, the matrix
Thirdly, determining the relative importance of the dissolved gases. The importance degree of dissolved gas with respect to the fault F
t
(t = 1, 2, ⋯ , 6) is denoted as E
ti
(t = 1, 2, ⋯ , 6 ; i = 1, 2, ⋯ , 5) and calculated by Eq. (10)-(11). For the fault F1, the importance degree of dissolved gases with respect to F1 can be expressed as a matrix
With a similar calculation, the relative importance of dissolved gases in other types of faults are determined. Similarly, the interval fuzzy preference relation matrices of T2, T1, PD, D1 and D2 are defined as the matrix
Similar to matrix
The interval weighted average is used to calculate the probability interval of possible fault types. Taking transformer No. 1 as an example, the calculation process can be summarized as follows:
Firstly, the intervals representing the state level of dissolved gases are arranged in ascending order. i.e., the state matrix of transformer No. 1 can be presented as
Secondly, the representative matrix is required to perform the same sequence transformation as the state matrix. i.e., the transformed representative matrix of transformer No. 1 can be expressed as
Thirdly, the interval weighted average given in Section 2.2 is used to calculate the probability interval.
Based on the interval probability model (13), the probability intervals of various types of faults can be calculated. According to Eq. (3), the result of the probability interval can be expressed as [P
L
, P
U
], where P
L
and P
U
are the minimum and maximum values of interval weighted average respectively. For the transformer No. 1, the probability interval corresponding to its possible fault types is represented as:
According to the calculation formula (1) of interval probability, the probability-degree of transformer No. 1 is shown as follows:
The performance of the proposed method is further compared with that in [14, 19]. The transformer fault diagnosis methods proposed in [14, 19] have high accuracy, while Doernenburg method, Rogers method and Duval method are classic transformer fault diagnosis methods with low accuracy but are popular in practical application. Therefore, they were selected to compare the diagnostic results with the method presented in this paper. After calculating the test values in [14, 19] by the proposed method, the interval probability of all types of possible faults can be obtained. For illustrating, only 9 cases in [14] and 4 cases in [19] with inconsistent diagnosis results are listed here, and the diagnostic results of the method proposed in this paper are presented in the last column. The diagnostic results are shown in Table 5.
Table 5 presents the comparison results between the proposed method and the compared methods. Among them, test data of Nos. 1-9 came from [14], and test data of Nos. 10-13 came from [19]. For the proposed method, the probabilities of possible faults T3, T2, T1, PD, D1 and D2 are given successively in the last column of Table 5. As shown in Table 5, in No. 1, the probability of T3 fault is 0.502, T2 fault is 0.498, T1 fault is 0.406, PD fault is 0.334, D1 fault is 0.444 and D2 fault is 0.465. Compared with other methods, it is found that the proposed method can accurately identify the faults in transformers and reflect the probability of each fault in transformers. In addition, by comparing the diagnosis results, it can be found that when the probability values of possible faults are almost the same, the diagnostic results obtained by different diagnostic methods are easily inconsistent. This is because there are multiple potential faults in the transformer and these methods assume that there is only one fault in the transformer. The interval probability method proposed in this paper can capture this feature of multiple faults, while most diagnosis methods only give a binary value or a deterministic probability value. For example, in No. 7, the probability of T1 fault is 0.500, PD fault is 0.494, and the actual fault is discharge and overheating. According to the single-valued diagnosis method, the fault is either T1 or PD, but it is actually multiple faults. It should be pointed out that the method proposed in this paper also cannot be completely in line with reality when diagnosing transformer faults. For example, in No. 3, the largest possible fault diagnosed is low temperature overheating, but the actual fault is overheating, and the probability of
The accuracy of the fault diagnosis results was calculated based on the dataset in [14, 19], as shown in Table 6. Among them, the method proposed in this paper confirms the fault type according to the maximum occurrence probability. It can be clearly seen from Table 6 that the method proposed in this paper has the second highest accuracy rate, which indicates that the method in this paper is acceptable for transformer fault diagnosis. However, the advantages of the method in this paper are also obvious, that is, the method in this paper can give the occurrence probability of each type of fault relative to other types of fault, which can provide help for engineering maintenance. When the occurrence probability of other faults is close to the maximum probability value, it should be further confirmed whether there are multiple faults in the transformer to avoid misdiagnosis or missed diagnosis. The method presented in this paper can provide the occurrence probability of all types of faults in multiple fault transformers.
The accuracy of different diagnostic methods
The transformer sample in case 3 is selected from a substation in Nanchang, whose related test data are shown in Table 7.
The DGA data (μL/L)
The DGA data (μL/L)
As shown in Table 7, the status illustrates that the transformer is likely to have serious faults. According to the proposed method, the diagnosis results can be represented as:
The inspection result was a partial short circuit in the iron core and overheating of the bare metal, both of which may have occurred simultaneously in the transformer. The inspection results verify that the proposed method can be used for multiple fault detection of transformers and can be helpful for developing maintenance strategies.
The classical DGA methods use crisp values to define bounds and assume that the transformer to be diagnosed is a single-fault transformer, which is inconsistent with the actual situation. Therefore, many artificial intelligence based fault diagnosis methods have been proposed so as to improve the accuracy of classical DGA methods. However, the diagnostic results of these methods are mostly a binary value or a definite probability value, which lacks interpretation.
In this context, a multiple fault diagnosis method for power transformer based on interval fuzzy probability approach is proposed in this paper. In this method, the crisp bounds are transformed into probability interval, and the expert knowledge is integrated into fault class matrix for fault classification. With the help of interval weighted average technique, the probability interval of possible fault is calculated, and the probability of one fault relative to other faults is determined. By integrating the uncertainty contained in both the pre-diagnosis data and the post-diagnosis result into the decision-making process, the situation that different methods may get different results in the same environment can be avoided.
The method presented in this paper is validated by several cases, and the results show that it can correctly distinguish the fault types and improve the accuracy of multiple fault diagnosis. Besides, the experimental process reveals the importance of fault classification based on expert knowledge in multiple fault diagnosis. In the future, the role of expert experience and data distribution in fault classification and detection will be further studied, as well as other available gases will be integrated.
Footnotes
Acknowledgments
The authors would like to thank anonymous reviewers and editors for their valuable comments and suggestions that help to improve the quality of this paper. This work was supported in part by Key Science Projects of Henan Colleges and Universities (grant no. 19A120004), Center Plain Science and Technology Innovation Talents (grant no. 194200510016), Science and Technology Innovation Team Project of Henan Province University (grant no. 19IRTSTHN013), Fourth Intelligent Compilation Zhengzhou 1125 Science and Technology Innovation Talents (no. 192101059006), Key Science and Technology Program of Henan Province (no. 172102310447), and Doctor Startup Funds Foundation of Zhengzhou University of Light Industry (no. 2017BSJJ010).