
Abstract
The density peaks clustering algorithm (DPC) has been widely concerned since it was proposed in 2014. There is no need to specify in advance and only one parameter required. However, some disadvantages are still witnessed in DPC: (1) Requiring repeated experiments for choosing a suitable calculation method of the local density due to the variations in the scale of the dataset, which will lead to additional time cost. (2) Difficulty in finding an optimal cutoff distance threshold, since different parameters not only impact the selection of cluster centers but also directly affect the quality of clusters. (3) Poor fault tolerance of the allocation strategy, especially in manifold datasets or datasets with uneven density distribution. Targetting solutions to these problems, a density peaks clustering based on local fair density and fuzzy k-nearest neighbors membership allocation strategy (LF-DPC) is proposed in this paper. First, to obtain a more balanced local density, two classic local density calculation methods are combined in the algorithm to calculate the local fair density through the optimization function with the smallest local density difference. Second, a robust two stage remaining points allocation strategy is designed. In the first stage, k-nearest neighbors are used to quickly and accurately allocate points from the cluster center. In the second stage, to further improve the accuracy of allocation, a fuzzy k-nearest neighbors membership method is designed to allocate the remaining points. Finally, the LF-DPC algorithm has been experimented based on several synthetic and real-world datasets. The results prove that the proposed algorithm has obvious advantages compared with the other five ones.
Keywords
Introduction
Being one of the core technologies of data mining, the clustering algorithm is a statistical method of researching into sample classification problems. Clustering is usually automatically divided according to some similar characteristics of the samples, and the objects are divided into different clusters according to certain rules. Therefore, the samples tend to enjoy a high degree of similarity in the same cluster, while vast differences often occur among samples of separate clusters [1, 2]. The clustering algorithm is also an important field in machine learning, which falls into several categories: partitioning methods, hierarchical methods, density-based methods, grid-based methods, model-based methods [1–4]. With the development of data mining and machine learning, clustering technology has been widely used in diverse research fields, such as image processing [5, 6], community detection [7, 8], and commercial market analysis [9, 10].
So far, many classic clustering algorithms have been developed, such as K-means [11], BIRCH [12], STING [13], EM [14], DBSCAN [15] etc. Among them, DBSCAN is a representative of the density-based clustering algorithm. It defines clusters as the largest set of density connection points, which can divide high-density areas into clusters and find clusters of arbitrary shapes in noise samples. Although DBSCAN does not specify the number of clusters in advance, it is necessary to set the minimum number (MinPts) and the radius domain (e), making the optimal values of these two parameters difficult to obtain.
In 2014, Rodriguez et al. [16] published a paper in Science, introducing a novel clustering algorithm by fast search and discovery of density peaks (DPC). The algorithm can cluster data in arbitrary shapes and easily identify abnormal points. DPC clustering process is simple, efficient with only one parameter required, therefore, it has been widely concerned. DPC is based on two assumptions: (1) The cluster center is always surrounded by low-density data points. (2) The cluster center is far away from other high-density data points. Based on the assumptions, DPC first calculates the local density and the relative distance via the cutoff distance threshold. Second, it plots a two-dimensional decision graph by sorting local density and distance. Then it selects the appropriate clustering center, and finally assigns the remaining points to the most suitable cluster.
Since DPC was proposed, it has been favored by many scholars. Although the algorithm performs well on some datasets, there are still some drawbacks: (1) Selecting a suitable cutoff distance is difficult, for there is no unified measurement on calculating the local density, and different local density calculation methods have different impact on the quality of clustering. (2) The cluster centers usually select data points with large local density and relative distance, especially in the unevenly distributed datasets, which are prone to multiple peaks problems. (3) Allocation strategy easily causes a “domino” effect, resulting in the misallocation of remaining points.
To solve these problems, we proposed a density peaks clustering algorithm based on local fair density and fuzzy k-nearest neighbors membership allocation strategy (LF-DPC) that showcases some innovations and contributions:
(1) Based on two typical density calculation methods, the new local fair density is defined by the local density difference optimization function.
(2) A two-stage remaining points allocation strategy is designed: the breadth-first search to allocate the remaining points were applied in the first stage; a fuzzy k-nearest neigbors membership allocation strategy was designed in the second stage. When the allocation is completed, the membership difference of a sample point is lower than a certain threshold, and the point is re-allocated by expanding the range of k-nearest neighbors.
(3) The clustering performance of LF-DPC is evaluated using a large number of experimental datasets, and the results are compared to the other five algorithms.
The rest of this paper is organized as follows: in Section 2, related work is discussed;in Section 3, the DPC algorithm is introduced; in Section 4, the proposed algorithm is discussed in details; in Section 5, comparisons are made between the proposed algorithm and the other five ones, along with the list of experimental analyses; the final section includes conclusions and anticipation of the future research.
Related works
Many researchers have offered various improvement methods in face of DPC’s flaws, which may be split into three categories: (1) local density design. (2) remaining point allocation strategy, and (3) sub-cluster merging strategy.
Targeting the local density deficiencies of DPC, many researchers have been endeavoring to overcome this defect. Du et al. [17] proposed a density peaks clustering algorithm based on the k-nearest neighbors (DPC-KNN), in which the idea of k-nearest neighbors was introduced into DPC and another option was provided for the calculation of local density. Xie et al. [18] proposed an improved DPC based on the fuzzy weighted k-nearest neighbors clustering algorithm (FKNN-DPC), by combining the concept of k-nearest neighbors with the redesigned calculation method of local density, the algorithm was completely independent from the cutoff distance. Liu et al. [19] presented an adaptive density peaks clustering algorithm (ADPC-KNN), in which k-nearest neighbors were applied to calculate the global parameter and local density. The algorithm also employed a new method of automatically selecting the initial cluster center. The comparative density peaks algorithm (CDP) was proposed by Li [20], in which not only mutual k-nearest neighbors was used to calculate the local density but also the geodesic distance was applied to define a new relative distance. Liu et al. [21] designed a shared nearest neighbor based on density peaks clustering algorithm (SNN-DPC), in which the concept of shared neighbors was used to define new local density. A density peak clustering algorithm for natural neighbors (NaNDP) was proposed by Cheng [22], which used natural nearest neighbors as k-nearest neighbors to calculate local density. Wu et al. [23] proposed a density peaks clustering with symmetric neighborhood relationship (DPC-SNR), whose local density was calculated using the reverse k-nearest neighbors. As for the complexity of calculating local density for DPC, Zhao et al. [24] designed a density peaks clustering based on circular partition and grid similarity (DPC-CP-GS), in which a new grid local density was proposed. Fan et al. [25] proposed a density peaks clustering based on k-nearest neighbors sharing (DPC-KNNS), which defined the local density by using the similarity between samples. However, each DPC derivative has its local density calculation method, thus lacking a balance calculation method with different local density characteristics combined. Besides, DPC provides two local density calculation methods for datasets of different sizes, which increases the cost of experiments.
In terms of allocation strategy, FKNN-DPC [18] designed a new method of allocation strategy, which applied breadth-first search and semi-supervised learning to assign outlier and non-outlier points. Yu et al. [26] introduced an improved DPC named DPCSA with weighted local density sequence and two-stage assignment strategies, the algorithm used the fixed k-value to calculate the local density and designed a two-stage remaining points allocation strategy. Density fragment clustering without peaks (DFC) was proposed by Jiang [27], who designed density fragment generation and aggregation, but the clustering effect was not satisfactory within the path-based datasets. However, these strategies failed to cover the membership distribution of k-nearest neighbors in the remaining points.
Many scholars have also conducted extensive research on the effectiveness of DPC in addressing the manifold datasets or datasets with uneven density distribution. For the unevenly distributed datasets, Zhuo et al. [28] proposed a density peaks clustering algorithm employing a hierarchical strategy (HCFS), which was applied to a new mechanism for measuring the similarity and connectivity of subcluster and merging the subcluster with a high degree of similarity and connectivity. Wang et al. [29] proposed a DPC based on local minimal spanning tree (DPC-LMST), which merged similar subcluster through subcluster merging factor (SCMF). Xu et al. [30] considered multiple density peaks in one cluster and designed a feasible density peaks clustering algorithm (FDPC) based on a new merging strategy inspired by the support vector machine. For the multiple peaks problem, Ren et al. [31] proposed a density peaks clustering algorithm based on the layered k-nearest neighbors and subcluster merging (LKSM-DPC), in which a strategy of new subcluster similarity and subcluster merging was redesigned. Although a subcluster merging strategy has been provided in the above literature, the remaining points allocation was ignored, and they did not realize that using them is a time-consuming process.
To solve the above-mentioned deficiencies in local density and allocation strategy, as well as some limits in Table 1, this paper is dedicated to researching an improved DPC algorithm framework that considers the local fair density and fuzzy k-nearest neighbors membership allocation strategy.
Advantages and limits of related algorithms
Advantages and limits of related algorithms
The DPC algorithm involves a novel series of mathematical steps based on the density clustering. DPC reveals two features of an appropriate cluster center: (1) The cluster center has a higher local density. (2) The existing cluster centers are far away from the other cluster centers. Therefore, there are two key variables in the cluster center: local density ρ and relative distance δ.
For datasets on different scales, DPC provides two methods of local density calculation:
Where d ij is the distance between data point i to j, d c is the cutoff distance, χ (.) is a piecewise function. For small-scale datasets, the calculation method of the Gaussian kernel is adopted by DPC. Formula (1) is applicable to large-scale datasets. To get a better clustering effect, DPC needs different density calculation methods for different datasets, causing extra workload.
Besides, when the relative distance δ is defined as the shortest distance from data point i to a point with a higher density, the calculation method can be formulated by equation (3) as:
Where a data point in the samples has the highest local density, DPC considers it a density peak, and its relative distance is set as the maximum value. The calculation method is formulated as follows:
Based on the local density and relative distance of all data points, a decision graph is constructed. In the graph, points with greater local density and relative distance are considered to be candidate cluster centers. A formula for selecting the number of potential cluster centers is as follows:
However, when the dataset is unevenly distributed, DPC often has difficulty in finding the cluster centers and is prone to multiple peaks problems.
After the cluster centers are determined, the remaining points are assigned to the corresponding cluster center as its nearest neighbor of higher density. However, this allocation strategy is inclined to cause a chain reaction, which is erroneously allocating sparse density points to the closest dense area. It can be seen from Fig. 2(c) that the data points in the upper clusters of Pathbased are incorrectly allocated to the two middle clusters.
The detailed steps of the DPC algorithm are shown in Algorithm 1.
In this section, the two contributions of LF-DPC are first introduced. Secondly, the detailed steps of the proposed algorithm are provided. Finally, the complexity of the algorithm is analyzed.
The main contribution of LF-DPC
The local fair density
Local density is the key to DPC, for it not only impacts the choice of cluster center but also affects the quality of the final cluster. Therefore, designing a reliable local density calculation method is the research focus for many researchers. DPC uses different local density calculation methods for the separate datasets, and its clustering results vary greatly. Although the local density was calculated in the form of k-nearest neighbors in a great deal of literature, the results were different due to different calculation formulas.
Based on the idea of k-nearest neighbors, literature [17] and [18] respectively shows two different local calculation methods. Besides, formula (6) focuses on the local structure of the data, and formula (7) concentrates on the distribution of k-nearest neighbors.
Where d (x i , x j ) represents the Euclidean distance from sample point x i to x j , KNN (x i ) is the k-nearest neighbors of x i , k is the parameter value of KNN.
In this paper, two typical local density calculation methods are combined for the proposal of a new local fair density measurement method, which makes the local density of data points more balanced. Therefore, it not only effectively selects the cluster center, but also facilitates the formation of the final cluster. The new local fair density ρ is formulated as follows:
Where θ1 and θ2 are fair coefficients of local density in these two methods. α and β respectively represent the local density in two calculation methods; nor is a normalized function which maps the local density in different dimensions to the interval [0,1].
In formula (8), as long as θ1 is calculated, the local fair density can be obtained. To calculate θ1, a concept of local density difference is defined as:
Where δ ij is the relative distance set in these two methods, which can be seen from formula (3) and (4).
To minimize the local density difference between any two methods, a local density balance model with the local density tending to be fair as the optimization function is established as follows:
The new local fair density can be calculated using the aforementioned method.
The remaining points allocation strategy of the DPC algorithm only considers distance as the allocation metric. Once there is a misallocation of one point, a “domino” effect will occur to other points. As is shown in Fig. 2(C), although the cluster center was correctly identified, the points on the left and right sides were obviously assigned incorrectly. Therefore, we proposed a strategy of two-stage remaining points allocation. The birth of the first stage draws on the ideas of the breadth-first search, in which the k-nearest neighbors allocation method was used, being similar to the allocation strategy in the first phase of FKNNDPC. In the second stage, we designed a strategy of robust fuzzy k-nearest neighbors membership allocation. This strategy bears no resemblance to FKNN-DPC, for it considers distance similarity and probability. In addition, the points allocated in the first stage have certainly belonged to one particular cluster. Inspired by membership in fuzzy mathematics [32], we consider another membership method to allocate the remaining points in this paper, and the degree of membership focuses on the distribution of points rather than distance. Furthermore, the membership difference of the sample points is calculated in the second stage, once all of the sample points have been allocated. When it falls below a certain threshold, the range of k-nearest neighbors is expanded and the sample points are re-allocated to improve the allocation’s accuracy.
Select an unvisited center point c
i
from the cluster center set SC, marking that c
i
has been visited; Find the k-nearest neighbors set KNN (c
i
) of c
i
, merge the points into the cluster c
i
in sequence, initialize the queue Q, and sequentially enqueue the data points in KNN (c
i
) into Q; Take the head data q of Q, if each data x ∈ KNN (q) is not allocated, then x will be classified into the cluster where q is, and x will be queued to Q; If Q is not empty, go to Step 3; If there are still unvisited data points in set SC, go to Step 1, otherwise end strategy 1.
For each unassigned data point x
j
, calculate the number of allocated points in KNN (x
j
); Calculate the membership degree u
ij
of x
j
by using formula (11) and (12); Sort the membership degree u
ij
, assign it to the cluster c
i
with the highest membership, and mark that x
j
has been assigned; If there are unallocated points, go to Step 1; If the requirements are met for any x
j
: the two largest membership degrees |u
ij
-u
bj
|< =0.05, the parameter k of KNN is set to 2 * k + 1, and x
j
is re-allocated based on the maximum membership degree, otherwise end strategy 2.
Where | … | is the symbol that represents the number of elements in the sample set.
It can be seen from Definition 2 that formula (11) is mainly for the sample points to be allocated in the second stage. The most appropriate cluster can be assigned by calculating the membership of the k-nearest neighbors of the sample points, it is different from DPC and FKNN-DPC. For example, as is shown in Fig. 1, the red points c1 and c2 are the cluster center of the two clusters; the blue points indicate that it has been allocated to the c1 cluster; the red points indicate that it has been allocated to the c2 cluster; the black points represent the remaining unallocated points. The point x j is being allocated, which indicates d (c1, x j ) > d (c2, x j ). In the dotted circle, the number of k-nearest neighbors of x j is 7, out of which 3 blue points have been allocated to the cluster c1, and 2 yellow points to cluster c2. So the degree of membership are u1j = 3/7 and u2j = 2/7. According to the DPC allocation principle, x j is allocated to c2, but it is more reasonable to be allocated to c1.
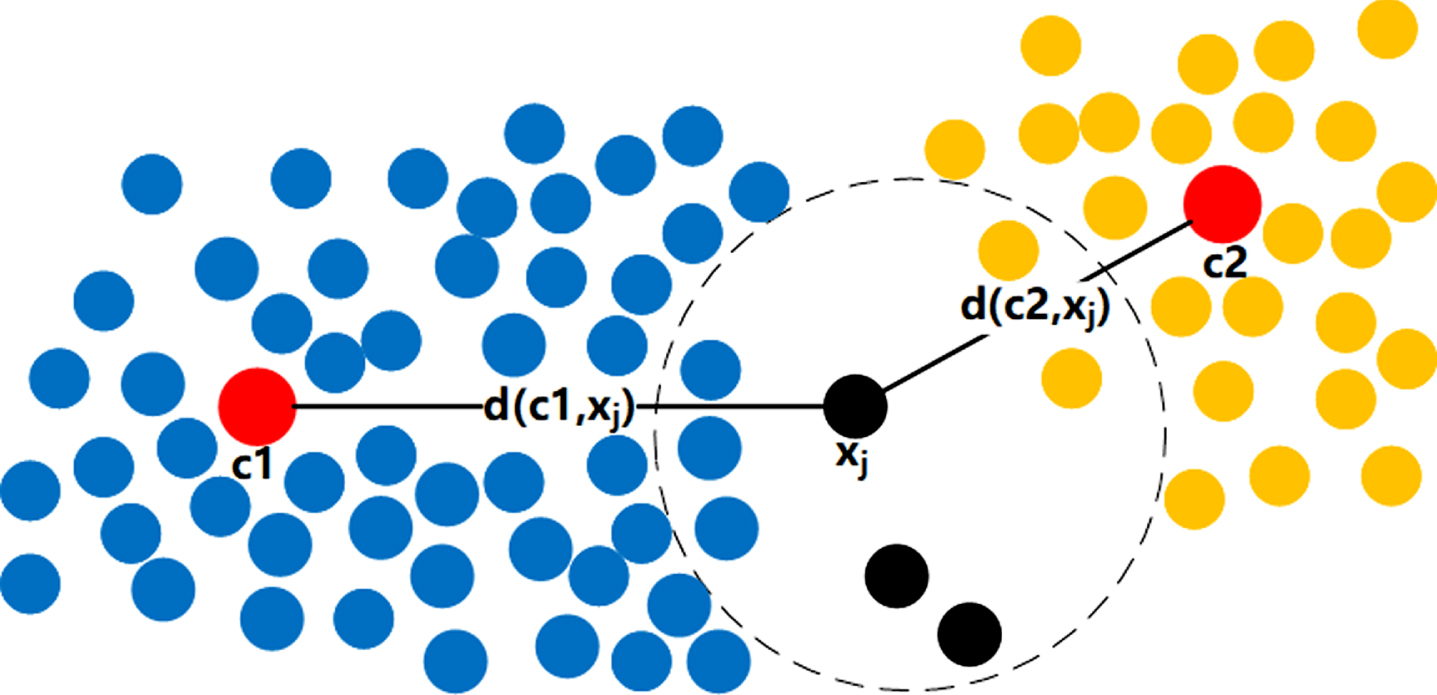
Schematic diagram of membership degree of fuzzy k-nearest neighbors.
In summary, the design of the remaining point allocation strategy is shown in Allocation strategy 1 and 2.
The steps of LF-DPC
The LF-DPC algorithm can be divided into four major steps: (1) Construct a distance matrix through the dataset. (2) Calculate local fair density and relative distance. (3) Plot a decision graph and select a candidate cluster center. (4) Assign the remaining points according to the new allocation strategy. The detailed steps of the LF-DPC algorithm are as follows:
Standardize the dataset X; Compute the Euclidean distance matrix d
ij
using X; Local fair density are calculated using formulas (6)–(10); Relative distance is calculated using formulas (3) and (4); Plot the decision graph according to the local fair density and relative distance, and select the appropriate candidate cluster centers in the decision graph; Allocate the remaining points using Allocation strategy 1; If there are remaining points that have not been allocated, use strategy 2 to allocate them; Return to Y.
Complexity analysis
In this section, we evaluate the complexity of the LF-DPC algorithm. Assume n is the size of the dataset, C denotes the number of candidate subclusters, and k represents the number of nearest neighbors.
The time complexity of the LF-DPC algorithm is mainly based on the following aspects: (1) Calculate the distance matrix of the dataset (O (n2)). (2) Evaluate the local fair density (O (n2)). (3) (a) Allocation strategy 1 is similar to graph depth-first search, which uses the adjacency matrix or adjacency table for traversal, and the time complexity in the worst case is O (n2); (b) Allocation strategy 2 uses the degree of membership to allocate the remaining points, and the time complexity will not exceed (O (n2)). Above all, the time complexity of the algorithm in this paper is O (n2), which is the same as DPC.
The space complexity mainly depends on the storage space required by the algorithm: (1) Store the distance matrix (O (n2)). (2) Store k-nearest neighbors for each point(O (kn)). (3) Additional space needs to be used in the allocation strategy. (a) Strategy 1 uses a queue, which is O (n); (b) A fuzzy membership matrix is used in Strategy 2, which is O (Cn). Since C and k are much smaller than n, the space complexity of the LF-DPC algorithm does not increase more than O (n2).
Experiments and analyses
In this section, the test datasets and experimental settings are first described in details, followed by the analysis of the clustering effect of the proposed algorithm on the synthetic datasets and real-world datasets, and finally a summary is made on the run time of the algorithm.
Test datasets and experimental settings
To verify the effectiveness of the LF-DPC algorithm, experiments and comparisons with K-means, DBSCAN, DPC, DPC-KNN, and FKNN-DPC were carried out. K-means and DBSCAN are the most popular clustering algorithms. DPC is the original algorithm, and our algorithm is improved based on it. DPC-KNN only improves the calculation method of local density and lacks consideration of the remaining points allocation strategy. FKNN-DPC designs the remaining points allocation strategy, but it is too time-consuming. Therefore, it is more reasonable to comprehensively consider these algorithms in the comparative experiments. The function of the K-means was provided by Matlab; we programed the code of the DBSCAN and KNN-DPC based on the author’s paper; the codes of the DPC and FKNN-DPC were provided by the authors. The experimental environment is a PC with an Intel (R) Core(TM) i7-7500 CPU @ 2.70GHz, 2.90 GHz, 12G RAM, Windows 10 64-bit operating system, and the programming software uses MATLAB 2015b.
The experiment tested 16 datasets, including six synthetic datasets and ten real-world datasets from the UCI Machine Learning Repository. The synthetic datasets are Pathbased, Spiral, Flame, D31, Aggregation, and S2. Due to their different sizes and attributes, they are widely used in various clustering algorithms. Through experiments on synthetic datasets, the clustering performance of the algorithm in different scenarios can be simulated. The real-world datasets come from different fields, with different sizes, attributes, and the number of clusters. The adaptability of the algorithm may be assessed by experiments on various datasets. Tables 2 and 3 show all test datasets.
Synthetic datasets
Synthetic datasets
Real-world datasets
Three indicators are used in the experiments: clustering accuracy (ACC), adjusted rand index (ARI), and adjusted mutual information (AMI) for clustering performance evaluation. They are the benchmark of classic cluster evaluation [33, 34]. The closer all evaluation indicators are to 1, the better the clustering performance is.
To reflect the performance of the proposed algorithm in this paper, all the algorithms for comparison obtain the best clustering effect through parameter tuning. K-means takes the number of actual clusters as the parameter. Two parameters need to be determined in DBSCAN: one is the radius domain e, ranging from 0.04 to 0.99, and the other one is the minimum number MinPts, selecting from 2 to 38. DPC needs to set the cutoff distance threshold, within the range from 0.3% to 5%. DPC-KNN takes a percentage as an input parameter, ranging from 1% to 8%. FKNN-DPC and LF-DPC take the number of nearest neighbors as a parameter, ranging between 2 and 30.
Because the attributes of the test dataset itself have different dimensions and magnitude, all datasets are standardized before the experiment, which is formulated as follows:
Where x ij is the value of the attribute column j of the data point x i ; min(x j ) and max(x j ) respectively represent the minimum and maximum values of the point in the attribute column j.
Comparisons were made between the proposed algorithm and K-means, DBSCAN, DPC, DPC-KNN, and FKNN-DPC on synthetic datasets. Table 4 summarizes the clustering results of ACC, ARI, and AMI of the six algorithms on the synthetic datasets. It can be seen from Table 4 that LF-DPC achieved the best clustering effect on most datasets. In other words, our algorithm can obtain the optimal clustering performance on datasets of different sizes and dimensions. The clustering result graphs of the six synthetic datasets are presented in Figs. 2–7.
Cluster evaluation of six algorithms on synthetic datasets
Cluster evaluation of six algorithms on synthetic datasets

Clustering results of six algorithms on Pathbased dataset.

Clustering results of six algorithms on Spiral dataset.
Clustering results of six algorithms on Flame dataset.
Clustering results of six algorithms on D31 dataset.
Clustering results of six algorithms on Aggregation dataset.
Clustering results of six algorithms on S2 dataset.
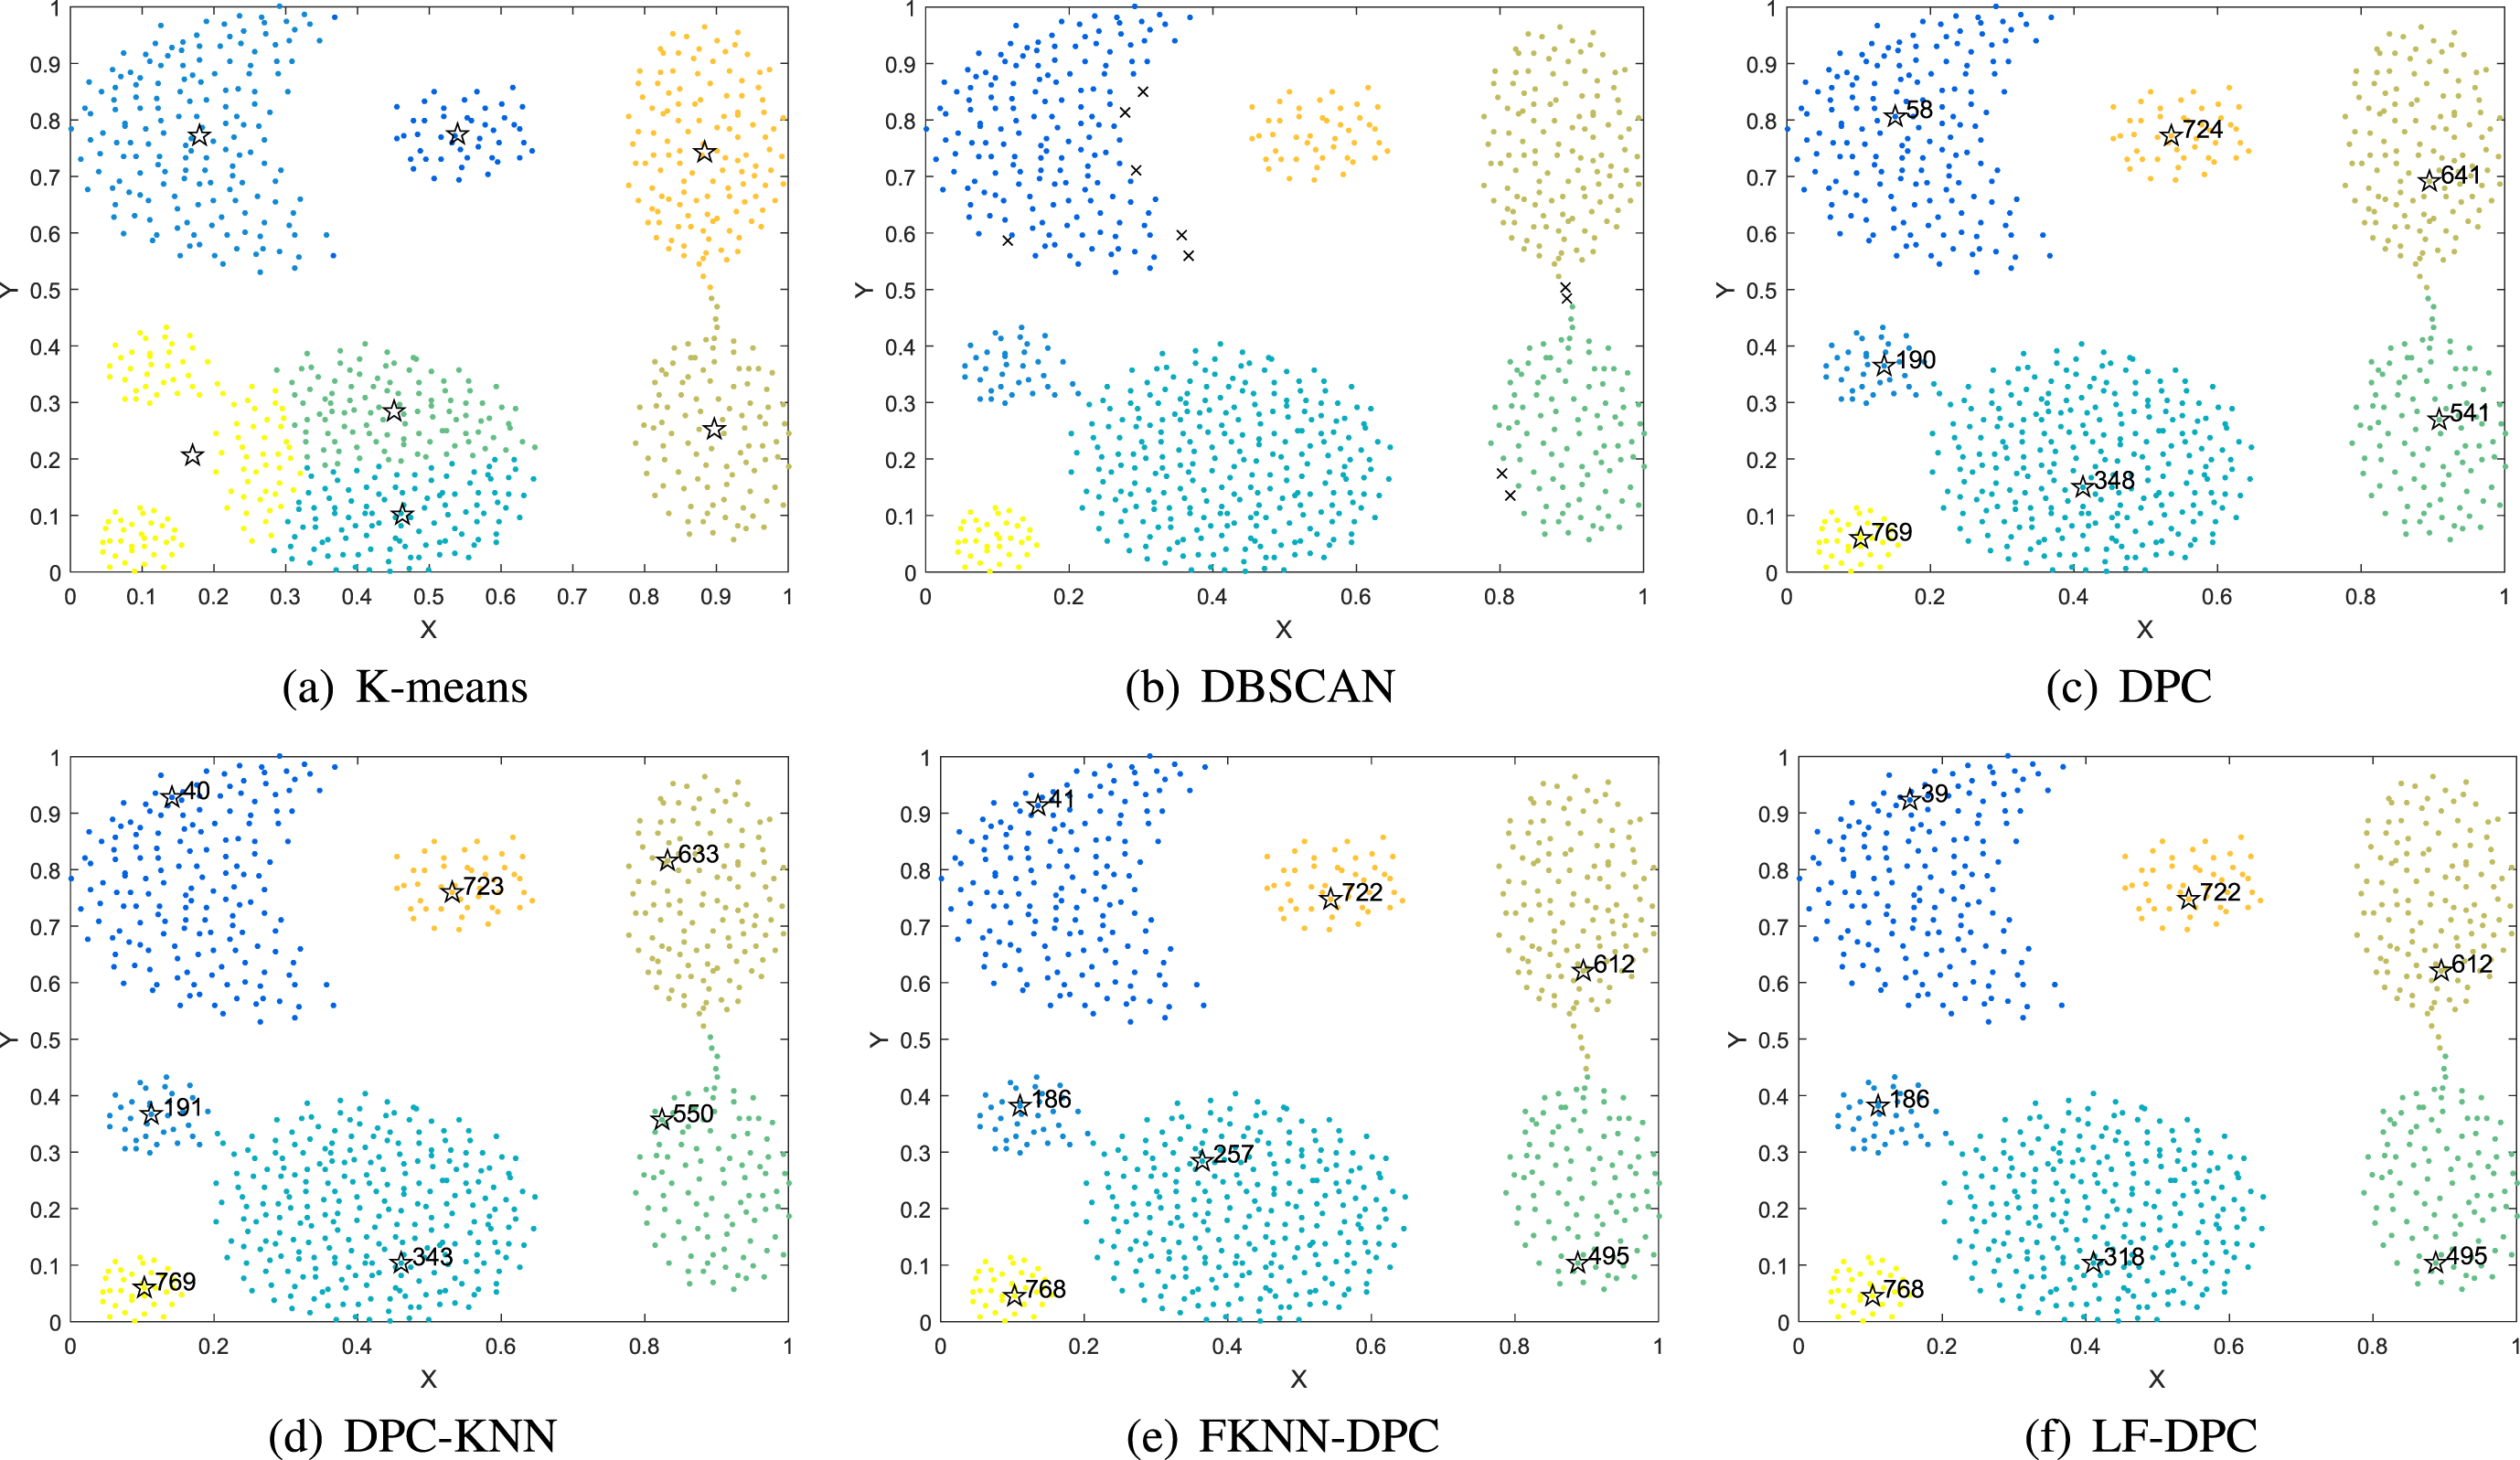
Figure 2 shows the clustering results of the six algorithms on the Pathbased dataset. The dataset consists of two inner clusters surrounded by circular clusters. Although K-means could find the cluster center, the points on the left and right sides of the circular cluster were incorrectly classified into the inner cluster. In the DBSCAN algorithm, all the points on the right side of the circular cluster were allocated incorrectly. Basically, the allocation strategy of DPC and DPC-KNN is to allocate points to the nearest cluster. Since the center of the circular cluster is at the top, and the points on both sides are closer to the center of the inner cluster, the circular clusters cannot be clustered correctly. FKNN-DPC has improved the allocation strategy, but allocation errors also occurred in some points on the right side. LF-DPC could perfectly cluster the Pathbased dataset, mainly because our allocation strategy played a decisive role.
The Spiral dataset consists of three ring lines. Figure 3 shows the clustering results of the six algorithms on this dataset. It can be seen from the graph that K-means performed poorly, which could be attributed to the deficiency of the partitioning clustering algorithm. The other five algorithms could perfectly identify these three ring clusters, and they all fall into the category of density clustering algorithm.
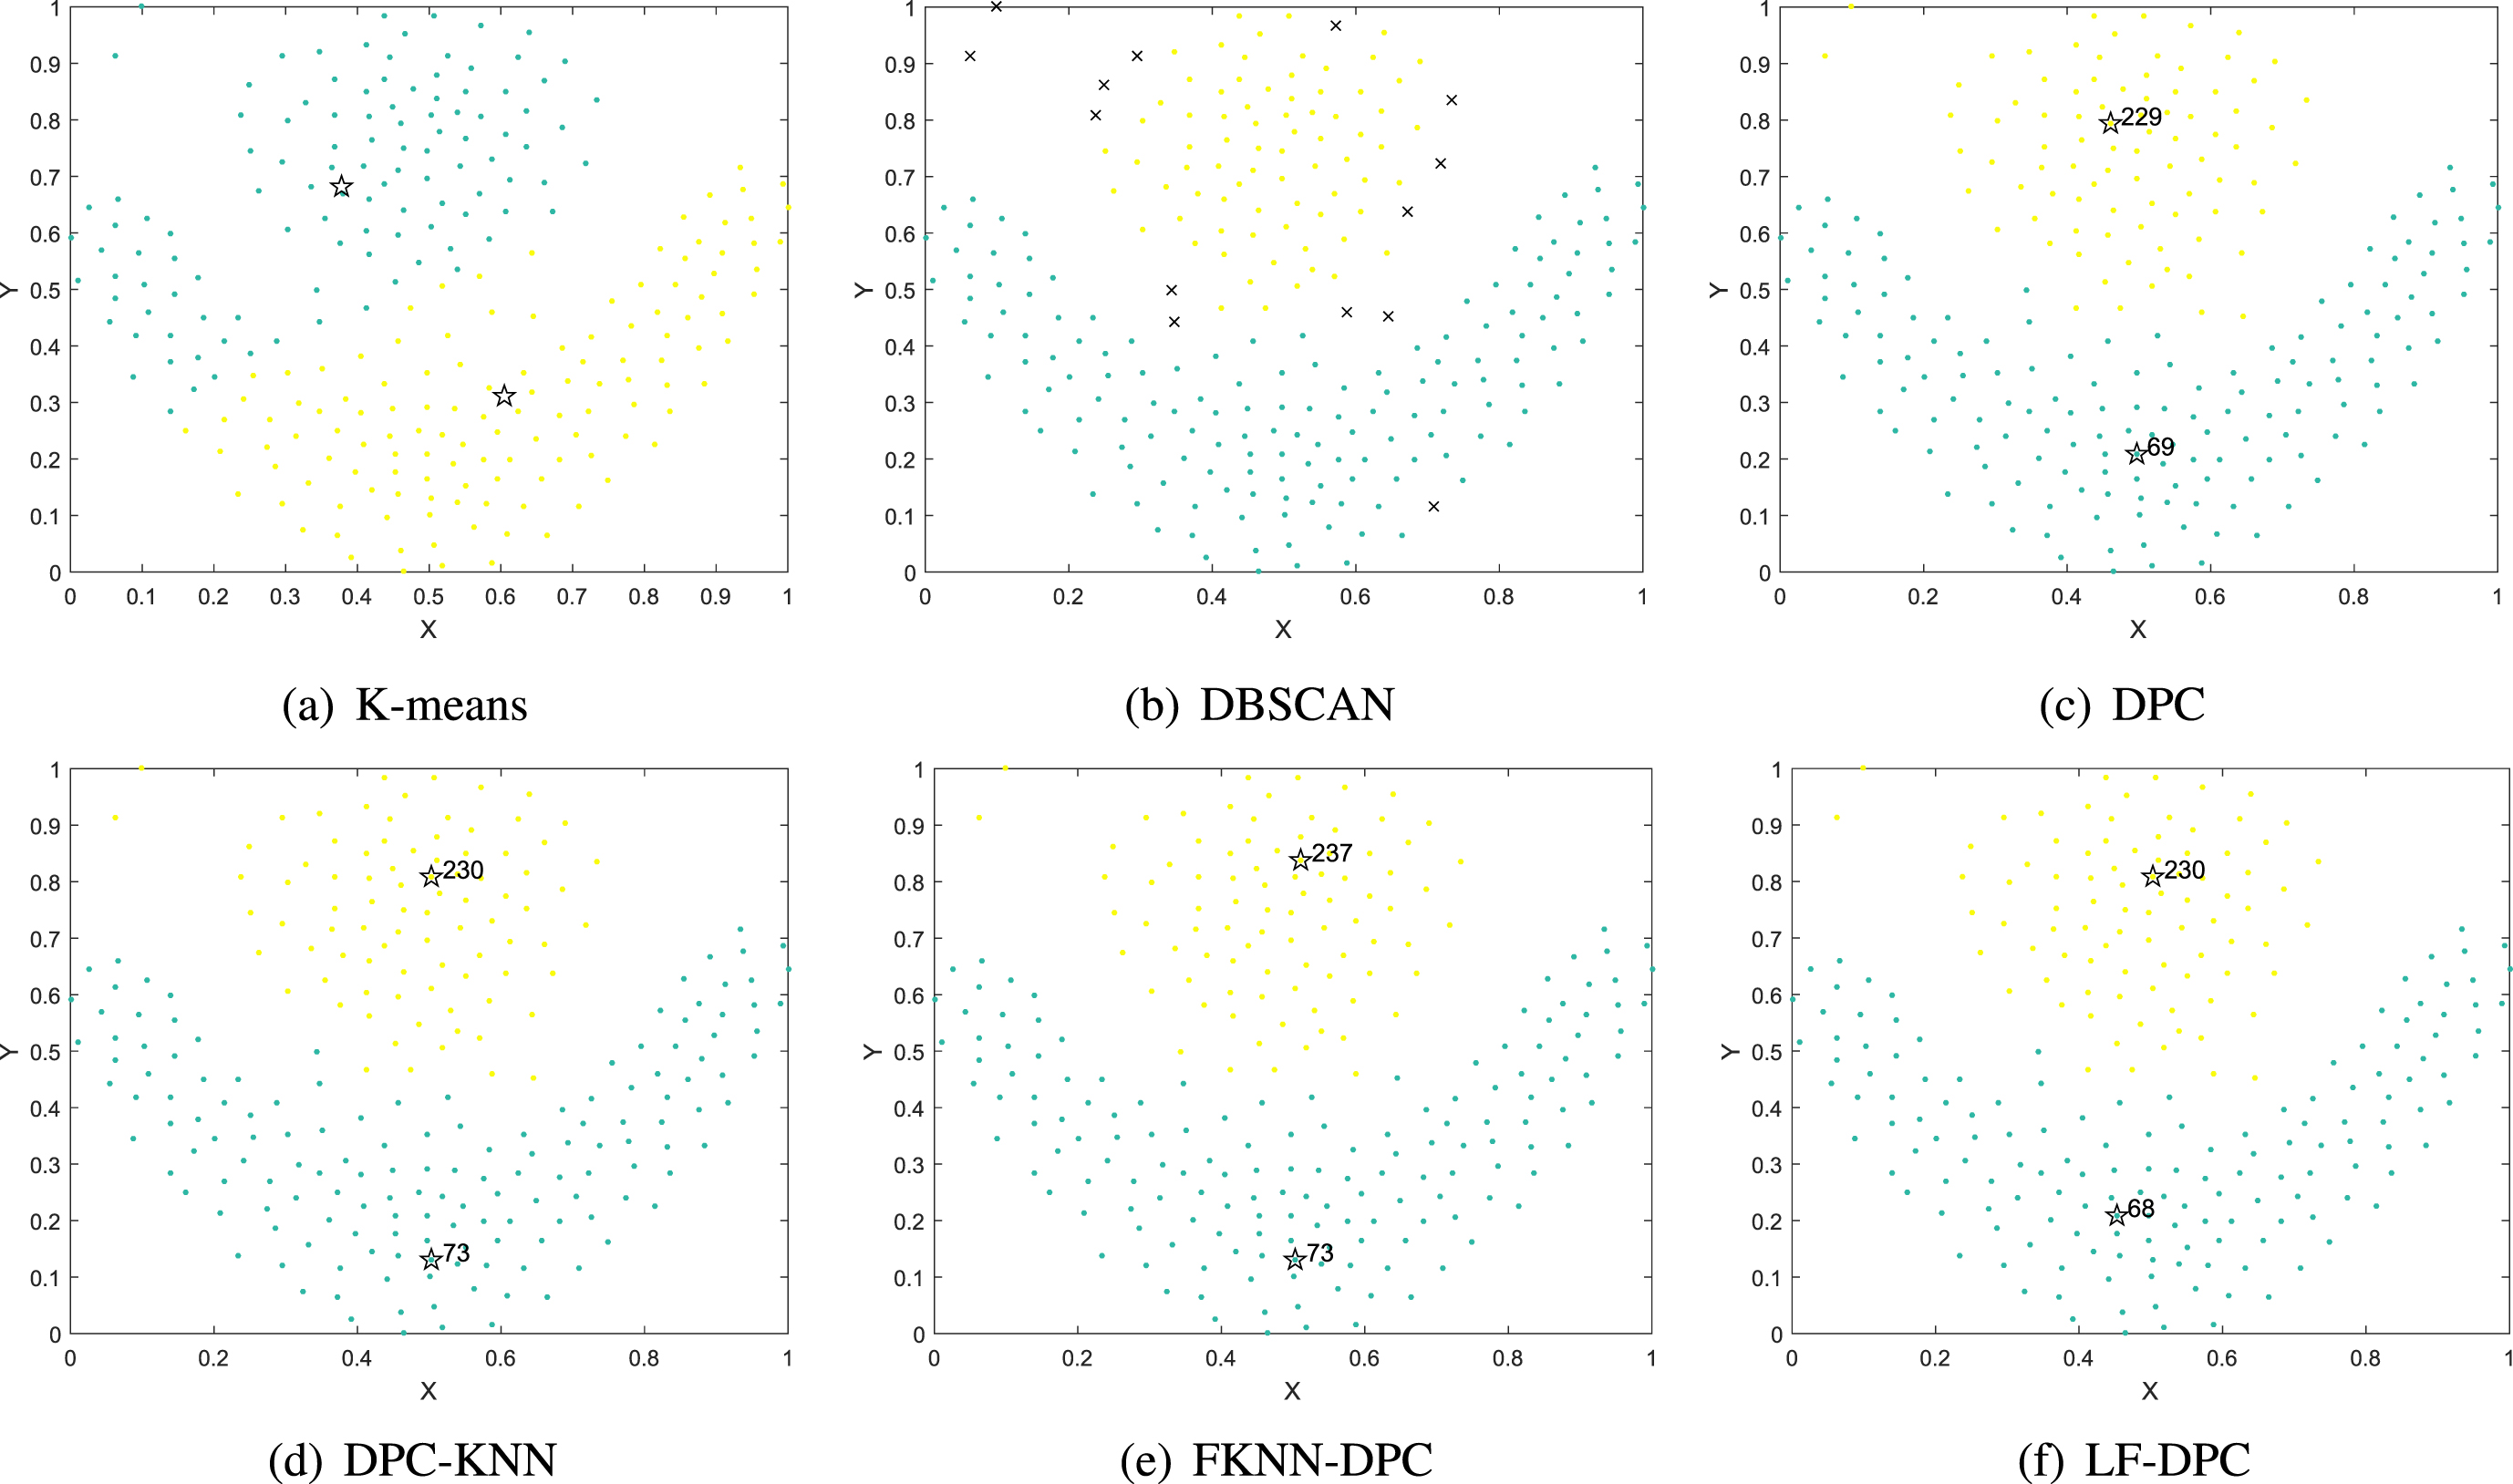
The Flame dataset is a common dataset with an uneven density distribution. According to Fig. 4, K-means, DPC, DPC-KNN, FKNN-DPC, and LF-DPC can correctly detect the cluster center. There are several allocation errors in K-means. On this dataset, DBSCAN found two clusters, but a few data points were flagged as noise. There are just two points with allocation problems in FKNN-DPC. DPC, DPC-KNN, and the proposed algorithm in this paper, on the other hand, were able to recognize the two clusters perfectly.
Figure 5 shows the execution results of the six algorithms on the D31 dataset. K-means could not correctly find some clustering centers. DBSCAN could not effectively identify a small number of clusters, and many boundary points were identified as noise. Although DPC, DPC-KNN, FKNN-DPC, and LF-DPC could all recognize 31 clusters, some points had obvious allocation errors. Compared with the other algorithms, LF-DPC had the best clustering performance.
The Aggregation dataset has seven clusters in different shapes. Figure 6 lists the clustering results of the six algorithms on this dataset. K-means could not find the cluster centers of some clusters, leading to the worst clustering effect. For DBSCAN, there were a few noise points despite effective identification of seven clusters in different shape. DPC, DPC-KNN, FKNN-DPC, and LF-DPC could also effectively cluster this dataset, but there were several point assignment errors at the boundary of the connected clusters.
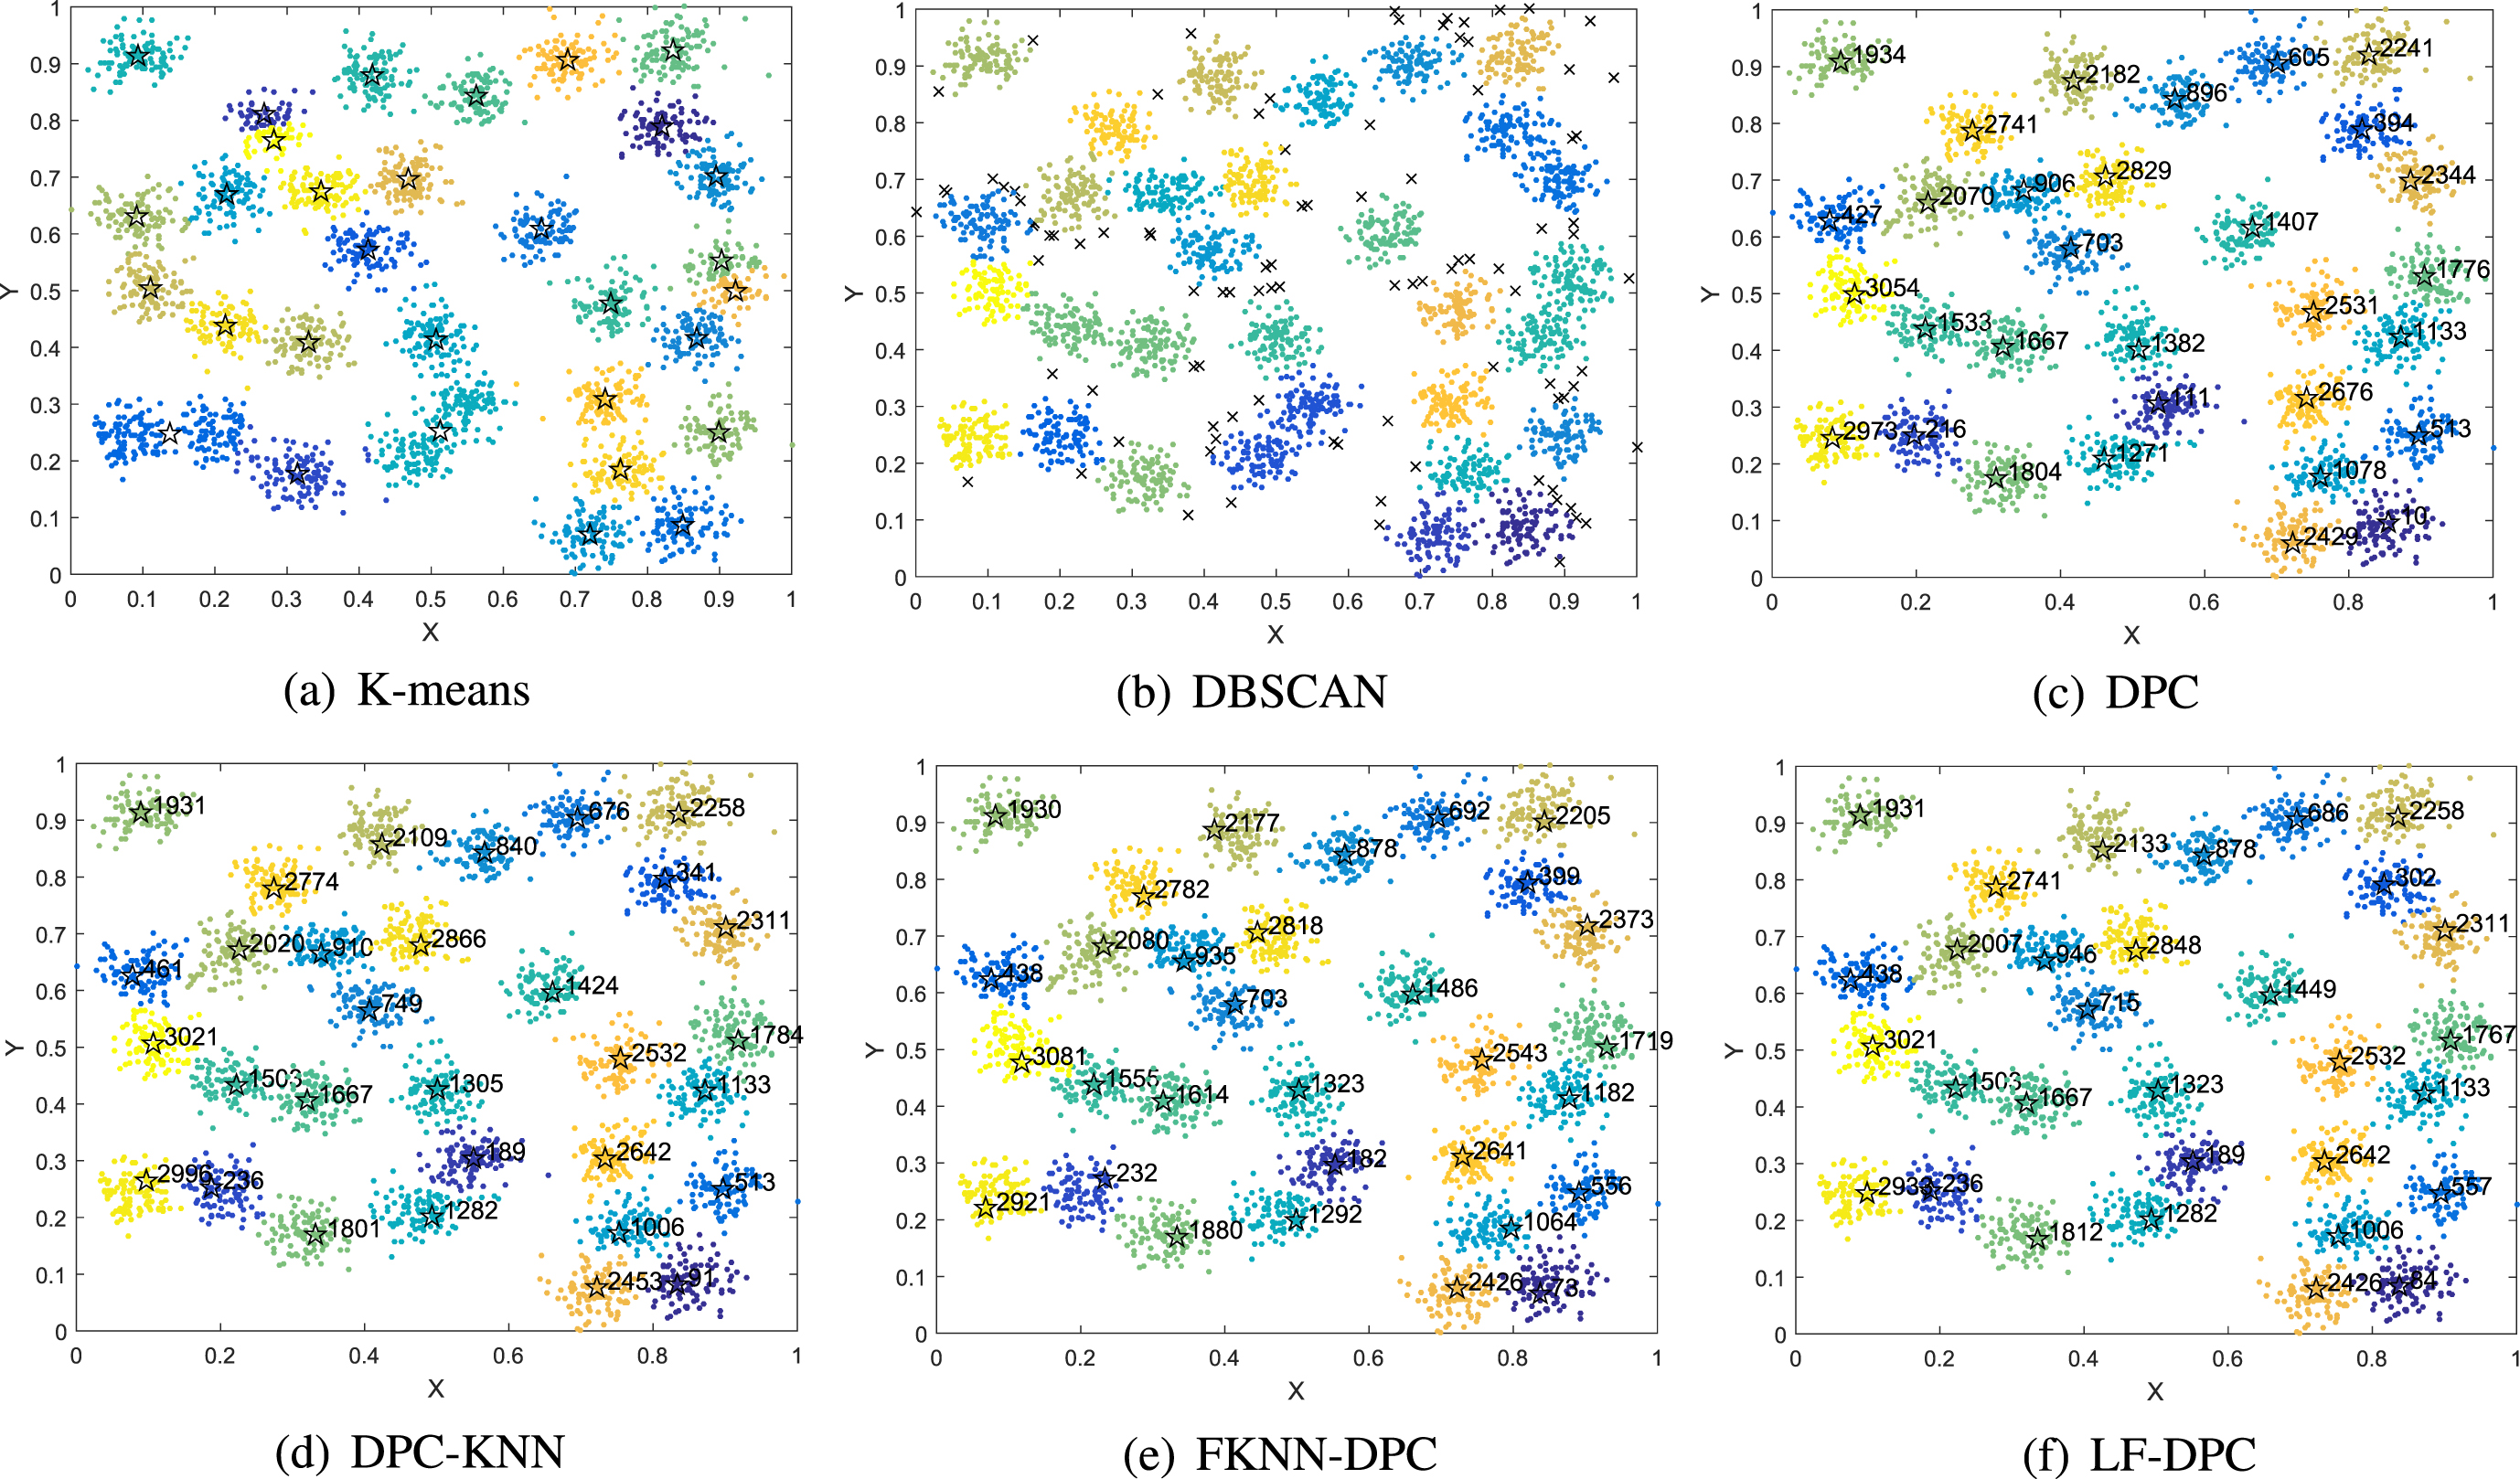
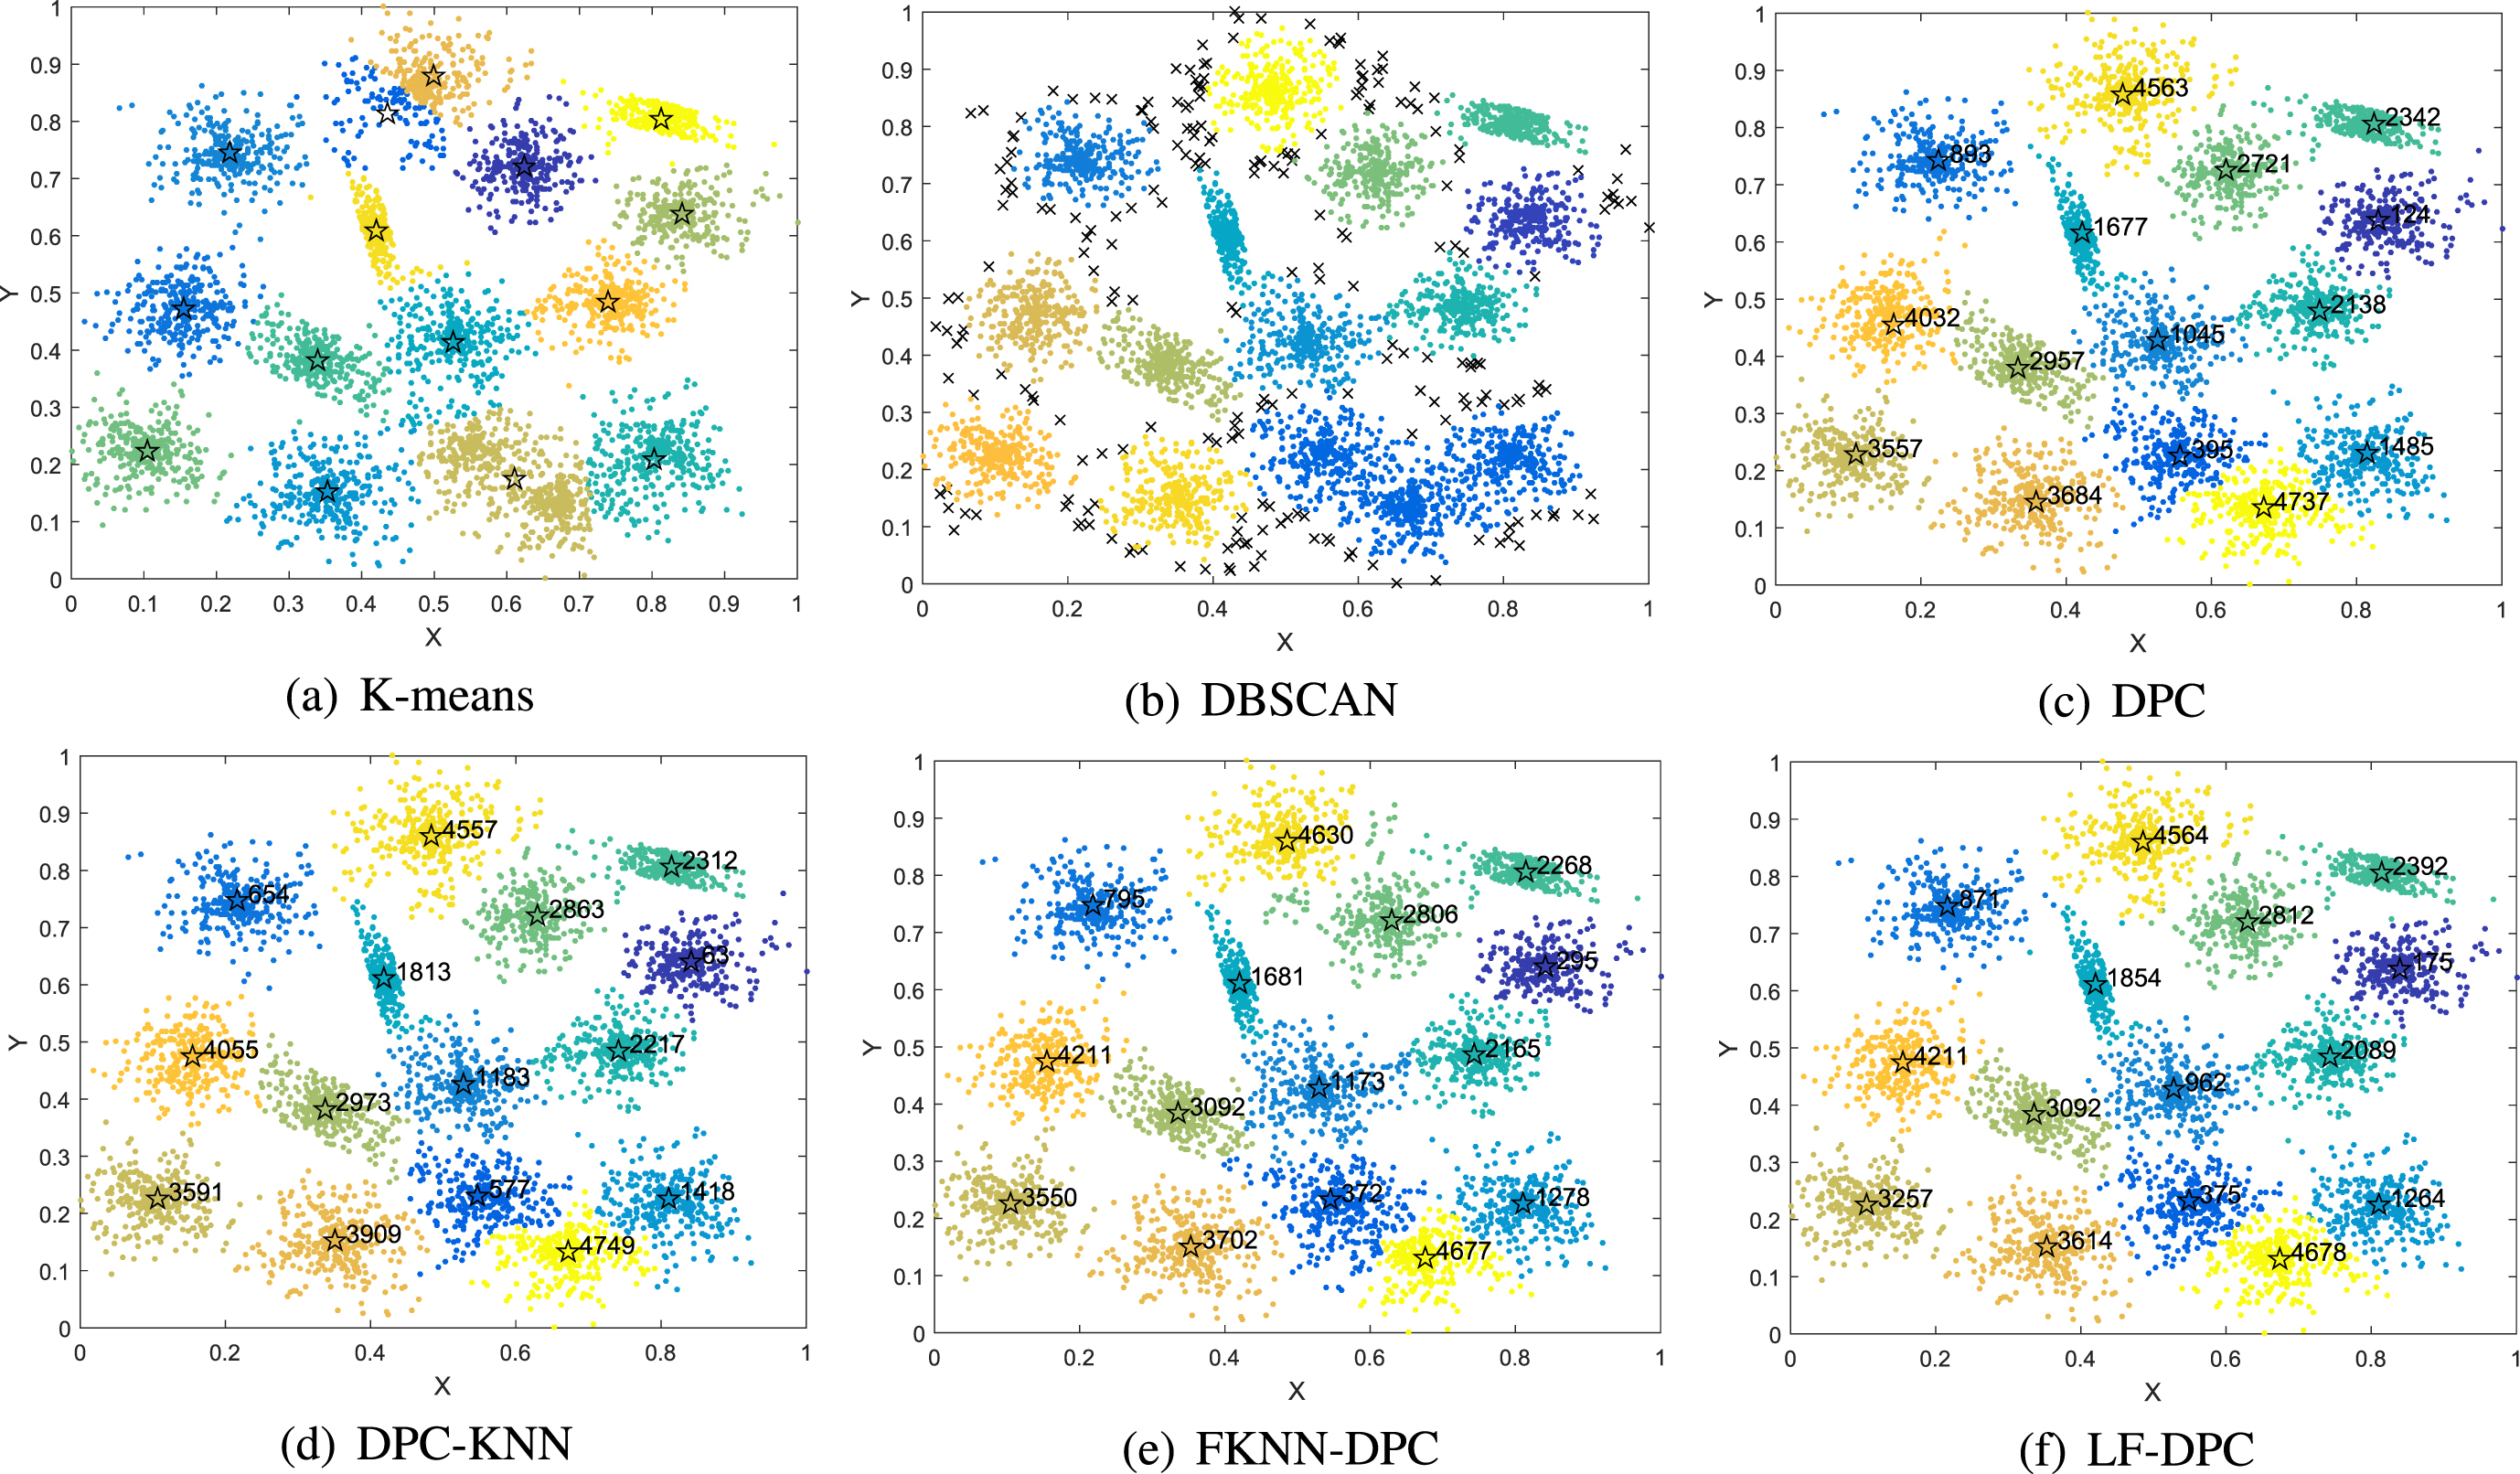
Figure 7 shows the clustering results of the six algorithms on the S2 dataset. DBSCAN recognized the boundary points of many clusters as noise, and its clustering performance was the worst. K-means could not find the cluster centers of three clusters. DPC, DPC-KNN, FKNN-DPC, and LF-DPC could effectively identify 15 clusters, among which LF-DPC had the best effect.
Comparisons were made between LF-DPC and the other five algorithms on real-world datasets.
As can be seen from Table 5, the clustering indicators ACC, ARI, and AMI of our algorithm on the Iris, Wine, and Libras datasets were better than those of the other five algorithms. On the Seeds dataset, LF-DPC is only slightly behind FKNN-DPC in ACC indicators. On the Ionosphere dataset, the clustering result of the proposed algorithm ranked second, only behind DBSCAN. In high-dimensional datasets, such as Scadi, our algorithm had the highest ACC, which was only slightly behind DPC-KNN in terms of indicators ARI and AMI. On the Wdbc dataset, the proposed algorithm was also superior to the other density clustering algorithms, for it only lagged behind K-means, and the partitioning clustering algorithms might be more suitable for this dataset. On the Segmentation dataset in ACC and AMI, LF-DPC had the best clustering result, and it was also better than the other four algorithms. DPC-KNN, FKNN-DPC, and LF-DPC had the same clustering performance on the Parkinsons dataset. On the Dermatology dataset, LF-DPC was ahead of the other algorithms in terms of indicators ACC and ARI, being only second to FKNN-DPC in terms of indicator AMI. In summary, the proposed algorithm on most datasets has achieved optimal clustering performance.
Cluster evaluation of six algorithms on real-world datasets
Cluster evaluation of six algorithms on real-world datasets
The run time of LF-DPC and the other five algorithms is shown in Table 6. It can be seen from the run time that on the small-scale datasets, LF-DPC, and FKNN-DPC were at the same level, but K-means and DBSCAN had an advantage. On the large-scale datasets, such as S2, the run time of FKNN-DPC increased significantly, which could be ascribed to the fact that the use of remaining points allocation strategy of FKNN-DPC was very time-consuming. In this paper, we also proposed an allocation strategy, but the running time was faster than FKNN-DPC on most datasets.
Run time of six algorithms on 16 datasets (time is measured in seconds)
Run time of six algorithms on 16 datasets (time is measured in seconds)
Against the deficiencies of DPC, we proposed the LF-DPC algorithm according to the following process. First, a method for calculating local fair density was proposed. This method can more accurately obtain cluster centers, and more easily form high-quality cluster results. Second, a two-stage remaining points allocation strategy was proposed, which solves the problem of chain reaction in the DPC allocation strategy. Accordingly, the clustering accuracy has significantly improved. Finally, the effectiveness of the proposed algorithm was verified on multiple datasets together with the other five algorithms. The experimental results show that LF-DPC can adapt to datasets of different types, sizes, and dimensions. However, the key parameter K value in this paper is still manually specified. When the K value is selected improperly, the performance of clustering will be affected. In the future, automatic density peaks clustering algorithms and their application scenarios will be further investigated.
Footnotes
Acknowledgment
We are very grateful for the FKNN-DPC algorithm source code provided by Professor Juanying Xie et al., FKNN-DPC [![]() ] was published in Information Sciences in 2016.
] was published in Information Sciences in 2016.
This work has been supported in part by the National Key Research and Development Program of China (No. 2018YFB1701500 and No. 2018YFB1701502).
Authors contribution
Manuscript write and experimental design: Chunhua Ren; Manuscript revise: Chunhua Ren, Linfu Sun, and Yunhui Gao; Manuscript typeset: Chunhua Ren, Yunhui Gao, and Yang Yu.