
Abstract
In response to the frequent counterfeiting of Wuchang rice in the market, an effective method to identify brand rice is proposed. Taking the near-infrared spectroscopy data of a total of 373 grains of rice from the four origins (Wuchang, Shangzhi, Yanshou, and Fangzheng) as the observations, kernel principal component analysis(KPCA) was employed to reduce the dimensionality, and Fisher discriminant analysis(FDA) and k-nearest neighbor algorithm (KNN) were used to identify brand rice respectively. The effects of the two recognition methods are very good, and that of KNN is relatively better. Howerver the shortcomings of KNN are obvious. For instance, it has only one test dimension and its test of samples is not delicate enough. In order to further improve the recognition accuracy, fuzzy k-nearest neighbor set is defined and fuzzy probability theory is employed to get a new recognition method –Two-Parameter KNN discrimination method. Compared with KNN algorithm, this method increases the examination dimension. It not only examines the proportion of the number of samples in each pattern class in the k-nearest neighbor set, but also examines the degree of similarity between the center of each pattern class and the sample to be identified. Therefore, the recognition process is more delicate and the recognition accuracy is higher. In the identification of brand rice, the discriminant accuracy of Two-Parameter KNN algorithm is significantly higher than that of FDA and that of KNN algorithm.
Keywords
Introduction
The quality of rice is mainly determined by starch, protein and various trace elements, and these indicators are largely affected by the natural environment. In other words, rice produced in different regions often has different quality characteristics. Wuchang rice is famous all over the world for its unique taste, and its price is several times that of ordinary rice. The huge profit gap has increased the motivation of some vendors to deceive consumers [1]. At the same time, in recent years, some scholars have been devoting themselves to studying methods of identifying brand rice [2–6]. In [2], Mingjuan Song et al. gave a fuzzy pattern recognition method of n-dimensional normal fuzzy sets, and used this method to identify the origin of rice from four adjacent counties at the foot of Changbai Mountain. The individual was used as identification objects with accuracy of 92%. Taking the group as the recognition object, the recognition accuracy rate is 100%. In [3], Mingjuan song et al. gave a new algorithm of FKNN. Firstly, the k-nearest neighbor set is defined as a fuzzy set, and then the class of the test samples are determined under different level sets. Finally, according to the discriminant results under each level set, comprehensively judge the category of test samples. Applying this method to the recognition of rice origins, its recognition effect is better than that of KNN algorithm and that of fuzzy KNN algorithm. In [4], Siyu Zhu adopted the idea of combining statistical pattern recognition and fuzzy pattern recognition, and gave two integrated pattern recognition algorithms: The first method is a stepwise classification method with accuracy of 98%. The second method is a recognition method that combines pattern recognition and hypothesis testing. This method is suitable for identifying groups, and the recognition accuracy rate is 100%. The shortcoming of Literature 1-3 is that they do not perform dimensionality reduction processing on the data, and the amount of calculation is very large. In [5], a pretreatment method of improved piecewise polynomial fitting + baseline removal is proposed, and then partial least squares method is used to realize the identification of rice from similar origins. This method has two shortcomings. One is that it is not easy to estimate how much information can be retained in the original data during the data preprocessing. Second, because the Raman spectroscopy data of rice is high-dimensional data and cannot be visualized, it is difficult to determine the dividing point. It is likely that the identification effect is unstable due to the different selection of dividing points. In [6], Hyperspectral images of 990 rice samples from the main rice producing areas of Meihekou City, Jilin Province and other rice producing areas such as Songyuan, Da’an and Huinan The multi-scattering correction (MSC) method was used to preprocess the spectra. Multi-layer perceptron (MLP), limit learning machine (ELM) and on-line sequence limit learning machine (OS-ELM) were used to establish the origin confirmation model based on the full-band hyperspectral data and the dimensionality reduction data by multi-dimensional scale analysis (MDS) method, respectively. The hyperspectral data of rice is non-linear, and the multi-dimensional scale analysis (MDS) method is suitable for linear data dimensionality reduction. This results in that in the three experiments, the accuracies of data classification after dimensionality reduction using MDS are all lower than that of full-band hyperspectral data classification (see Table 3 in Reference 6).
The rice samples collected in this article come from Wuchang City, Shangzhi City, Yanshou City, and Fangzheng City, which are adjacent to each other in China. The index data corresponding to the wavelength of the near-infrared spectrum of the sample is the object of our research. The data have more than 8000. Obviously, the dimensions of rice information are very large, indicating the difficulty of identification. And the closer the rice producing area is, the higher the degree of overlap between classes and classes. This means that the characters of the data we studied is very similar and the process of recognition maybe complicated, so linear dimensionality reduction methods and linear classifiers are no longer applicable. Therefore, it is necessary to find methods suitable for dimensionality reduction and pattern recognition of high-dimensional nonlinear data. At present, there are mainly two types of nonlinear dimensionality reduction methods, namely kernel-based methods and manifold-based learning methods. KPCA is one of the methods [7]. It is suitable for the dimensionality reduction of nonlinear data, and the dimensionality reduction effect is good [8–11]. Therefore, in this paper KPCA is employed to reduce the dimensionality of the near-infrared spectroscopy data of rice. FDA and KNN, which are suitable for binary classification [12, 13], are used to respectively identify brand rice. Experiments show that the recognition effect of the KNN algorithm is relatively better than that of FDA. KNN algorithm was originally proposed by Cover and Hart in 1967 [12]. Due to low error rate and insensitivity to outliers, KNN algorithm is one of the important methods for pattern classification. Its disadvantage is that the KNN algorithm has only one dimension for examination, which is not detailed enough. When sample sizes of various classes are not balanced, it is easy to misclassify. To this end, in this paper, fuzzy probability theory is employed to give a new identification method –Two-Parameter KNN identification, which will increase dimensions of inspection and improve accuracy of identification.
The paper is organized as follows: In Section 2, standardize the data, and then reduce the data dimension by KPCA. In Section 3, identify test samples based on FDA and KNN respectively. In Section 4, identify training samples based on FDA and KNN respectively. In Section 5, The Two-Parameter KNN algorithm is given and applied. In Section 6, concludes this paper.
The analysis and preprocessing of data
Data source and standardization
The samples of the rice are from four cities located at the foot of Changbai Mountain. They are Wuchang(W), Shangzhi(S), Yanshou(Y), Fangzheng(F). All the data are extracted by near infrared spectrum. These samples are divided into two groups. One is brand rice with 241 samples of rice from W. The other is ordinary rice with 34 samples of rice from S, 39 samples of rice from Y and 59 samples of rice from F. To eliminate the impacts of the dimension, all the data are standardized.
KPCA
The Principle of KPCA
KPCA is an unsupervised non-linear principal component algorithm. The basic idea is that low-dimensional raw data are mapped into high-dimensional feature space by Φ (•), where Φ (•) is a non-linear mapping function, and then PCA is employed to reduce dimension. The calculation process includes the following steps:
The first step is to find the Gaussian kernel matrix. Given a data set of n m-dimensional samples x = {x1, …, x
k
, …, x
n
}, where x
k
∈ R
m
. Denote the mapped points as Φ (x
k
). If
If K does not satisfy the centralization condition, it can be substituted by
where
The second step is to find eigenvalues λ k of K and corresponding eigenvectors ν k , k = 0, 1, …, n.
The third step is to determine the number d of principal components and select the principal components, satisfying
As a result, each training sample can be linearly expressed by d principal components. The projection of the test sample x new on the principal component vector ν k can be expressed as
Consequently, the original m-dimensional vectors are reduced to d-dimensional vectors, achieving the purpose of dimensionality reduction.
In Gaussian kernel function, parameter σ controls the local effect sphere of kernel function. The same input data will extract different principal component features under different parameters. To test the effect of projections, we experiment with σ at between 0.01 and 2, taking step of 0.01. We find that the effect of projection performs well when σ range from 0.9 to 1.1. Therefore we choose parameter σ = 1 to computer kernel matrix K with 373 rice samples from W, Y, S and F by MATLAB9.0, then employ KPCA to reduce dimensions by SPSS22.0. It turns out that the contribution of the variance of the first 3 principal components accounts for 91.84 percent of the total variance of the samples. The contribution of the variance of the first 10 principal components accounts for 99.31 percent of the total variance of the samples. The contribution of the variance of the first 25 principal components to the total variance of the sample is 99.98 percent, almost close to 1. Therefore, in the subsequent analysis, the first 25 principal components are taken to reduce the data to 25 dimensions, where the scree plot are shown in Fig. 1.
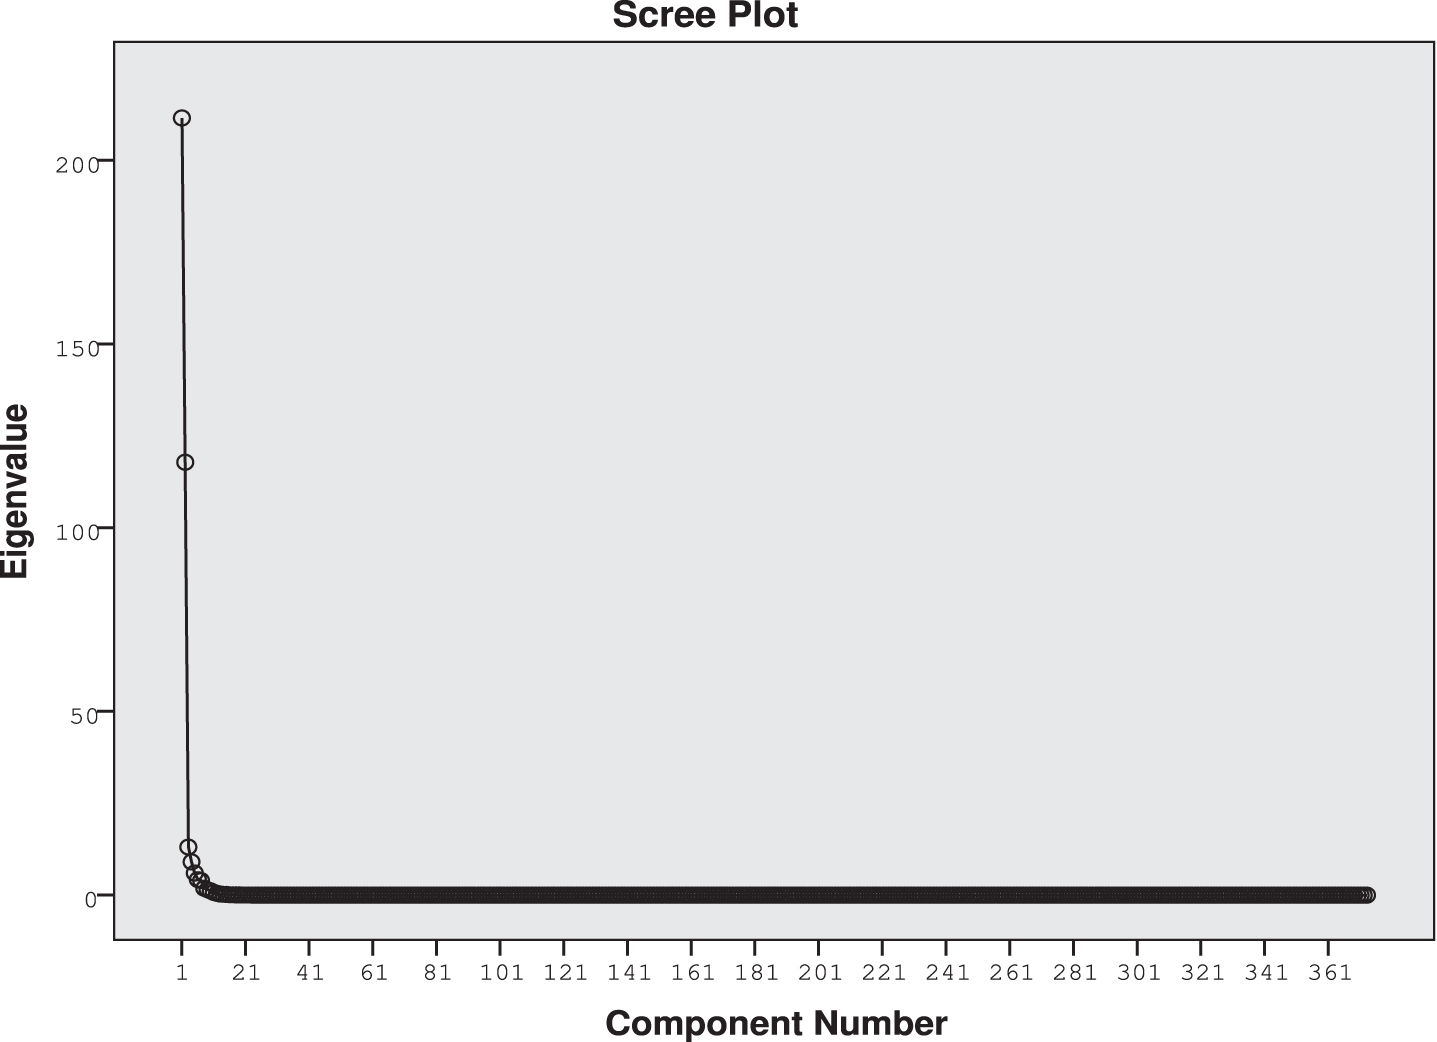
Scree plot.
Recognition of training samples of rice based on FDA
FDA has no specific requirements for the population distribution. Its basic idea is that from two populations, extract sample observations with p indicators, minimizing the variances within groups and maximizing the inter-class variance. The discriminant can be expressed as
Next we experiment with SPSS22.0 software. We set (1, 2) as the grouping variable, where 1 is brand rice and 2 is non-brand rice. The output results are shown in Fig. 2 and Table 1.

Sample distribution.
Training samples’ classification results by FDA
a. Cross validation is down only for those cases in the analysis. In cross validation, each case is classified by the functions derived from all cases other than that case.
b. 98.4% of original grouped cases correctly classified.
c. 97.3% of cross-validated grouped cases correctly classified.
It can be seen from Fig. 2 that the overlap between category 1 and category 2 is small. These two types of rice can be clearly distinguished. It can be seen from Table 1 that training samples’ recognition accuracy by FDA is 98.4%, which shows that the discrimination result is ideal.
Note: The identification results of those stepwise discriminant analysis methods like wilks’lambda, unexplained variance, Mahalanobis distance, minimum F value, and Rao’s V are consistent with that of Fisher discriminant analysis.
The core idea of the KNN algorithm is that if most of the k nearest samples in the feature space of a sample belong to a certain category, the sample also belongs to this category [13]. By SPSS22.0 software, open the data after dimensionality reduction, enter the nearest neighbor element dialog box, attaining Table 2.
Training samples’ classification results by KNN
Training samples’ classification results by KNN
From Table 2, we can see that the discriminant accuracy by KNN is 99.1%. This shows that the rates of the discriminant is very high.
Dimensionality reduction of test samples
Let X
T
={ X
T
1
, X
T
2
, ⋯ , X
T
m
} be the test set, X
S
={ X
S
1
, X
S
2
, ⋯ , X
S
n
} be the training set and M be the kernel principal component matrix of X
S
. Then the kernel relation matrix of X
T
and X
S
is
The projection matrix of X
T
on principal component is
We take new samples consisting 25 grains of rice from W (1st class) and 31 mixed grains of rice from Y, S and F (2nd class). The data after dimensionality reduction is used as the test set. The sample set obtained by combining the test set and the training set is called the full sample set. And then we employ FDA and KNN to discriminate the full sample set respectively by SPSS22.0 software. The following results can be seen in the Tables 3 and 4.
Full samples’ classification results by FDA
Full samples’ classification results by FDA
a. Cross validation is down only for those cases in the analysis. In cross validation, each case is classified by the functions derived from all cases other than that case.
b. 95.1% of original grouped cases correctly classified.
c. 92.8% of cross-validated grouped cases correctly classified.
Full samples’ classification results by KNN
From Tables 1 and 3, it can be seen that in the brand rice recognition based on FDA, 15 samples in the test set were misjudged, and the discriminant accuracy was 73.2%. It can be seen from Tables 2 and 4 that in the brand rice recognition based on the KNN, 9 samples in the test set were misjudged, with a discriminant accuracy of 83.9%, which is not ideal. Therefore, in order to further improve the discrimination accuracy, this paper will employ fuzzy probability theory to improve KNN discrimination method, and obtains a new KNN algorithm.
Two-Parameter KNN algorithm
If the neighbor X of x0 is equally likely to take value in domain and the distribution law is
It is universally acknowledged that KNN algorithm only examines the size of c
i
. Compared with KNN, the novel KNN algorithm, proposed in this paper, has one more test dimension
(1) Compared with KNN algorithm, 2P-KNN algorithm increases the examination dimension. It not only examines the proportion of the number of samples in each pattern class in the k-nearest neighbor set, but also examines the similarity between the center of each pattern class and the sample to be identified. Therefore, it reduces the probability that test samples are misjudged as a larger class when sample sizes of various classes are not balanced. Therefore, 2P-KNN algorithm has higher recognition accuracy than KNN algorithm.
(2) 2P-KNN algorithm has a wide range of applicability, suitable for all linear and non-linear data classification, and the error rate is very low.
(3) 2P-KNN mainly relies on a limited number of nearby neighbors to identify samples rather than a method of discriminating the class domain. Therefore, 2P-KNN algorithm is more suitable than other methods for sample sets with more crossovers or overlaps of class domains.
The deficiencies and improvement directions of 2P-KNN algorithm
(1)In 2P-KNN algorithm, each sample to be identified must calculate the distance from itself to all samples. Therefore, the amount of calculation is very large and the collection time is long. The K-Dimensional Tree(KD-Tree) method or Best Bin First (BBF) method can be used to reduce the search time [15, 16].
(2)The recognition result of 2P-KNN algorithm depends on the selection of the k value, and different k values may have different recognition results. The method given in [3] can be used for reference to reduce the influence of k value on the classification results.
Our future work is to modify 2P-KNN algorithm in response to its shortcomings.
The application of 2P-KNN algorithm in the recognition of rice
By using MALAB9.0 programming, take n=2, K=12, we can get the following results. (see Table 5).
Classification table by 2P-KNN algorithm
Classification table by 2P-KNN algorithm
In order to better compare the pros and cons of various algorithms, we summarize the results of Table1-5 getting Table 6. It can be seen from Table 6 that the recognition results based on 2P-KNN algorithm are very satisfactory, which means that the recognition effect of 2P-KNN is significantly better than either that of KNN or that of FDA.
Summary of recognition results
In the experiment, the recognition accuracy by KNN of the training samples is 99.1%, and that by FDA of the training samples is 98.4%, indicating that KPCA has a good dimensionality reduction effect, and the data after dimensionality reduction is suitable for linear classification. However, in the recognition of test samples, the correct recognition rate of FDA is 73.2%, and that of KNN is 83.9%, which is not ideal. Therefore, in order to further improve the discrimination accuracy, this paper employ fuzzy probability theory to improve KNN discrimination method, and obtains a new KNN algorithm, named the two-parameter KNN algorithm. In the brand rice recognition based on 2P-KNN algorithm, the recognition accuracy is significantly improved. That of training samples reaches 99.4%, and that of test samples 96.4%. The recognition effect is very good, which shows that two-parameter KNN algorithm, given in this article, has wide applicability and high recognition accuracy.