
Abstract
In the field of intelligent robot engineering, whether it is humanoid, bionic or vehicle robots, the driving forms of standing, moving and walking, and the consciousness discrimination of the environment in which they are located have always been the focus and difficulty of research. Based on such problems, Naive Bayes Classifier (NBC), Support Vector Machine(SVM), k-Nearest-Neighbor (KNN), Decision Tree (DT), Random Forest (RF) and eXtreme Gradient Boosting (XGBoost) were introduced to conduct experiments. The six individual classifiers have an obvious effect on a particular type of ground, but the overall performance is poor. Therefore, the paper proposes a “Novel Hybrid Evolutionary Learning” method (NHEL) which combines every single classifier by means of weighted voting and adopts an improved genetic algorithm (GA) to obtain the optimal weight. According to the fitness function and evolution times, this paper designs the adaptively changing crossover and mutation rate and applies the conjugate gradient (CG) to enhance GA. By making full use of the global search capabilities of GA and the fast local search ability of CG, the convergence speed is accelerated and the search precision is upgraded. The experimental results show that the performance of the proposed model is significantly better than individual machine learning and ensemble classifiers.
Introduction
Ground classification and recognition are one of the key technologies for robot environment perception. By realizing ground identification and perceiving non-geometric hazards, the robot can better complete navigation control, ensure its operation in the best state and safely reach the work destination through the various unknown ground [1]. The ground environment in which the robot is exposed to different materials directly affects the sensitivity of the robot driving device. Even if the “joints” of the robot’s feet are at the same degree of freedom, the same speed, and acceleration, the effects of various grounds are different, which also causes the robot to move normally or out of control. In this paper, through the analysis and recognition strategy research on different material surfaces, the robot can change the control signal according to the feedback of the sensor, improve the movement and navigation state of the robot, so that the robot can complete the task stably, accurately and perfectly under various environmental situations.
Most navigation technologies rely on external resources (e.g., GPS, GNSS, BeiDou Navigation System). However, whether it is the above-mentioned navigation technology (indirect eyes of robots) or various infrared, ultrasonic, and camera devices (direct eyes) assembled by intelligent robots, there are certain problems such as delays, blind spots, shadows and reflections. All these make the intelligent machine lack the ability to “directly and autonomously” perceive and cause the limitation to dynamically recognize the surrounding environment and cognition. Therefore, a new data source (robot foot sensor) can not only improve navigation accuracy but also enhance the machine cognition and learning capabilities. These data sources are not directly connected to locations, but act as agents for data fusion. The agent of the position is to measure the ground environment where the intelligent automatic robot is in different media materials.
Human beings interplay with surrounding substances and the environment, so as to further comprehend that the most essential information of interacting objects is perception and tactile impression. Similarly, for robots, it is also crucial to connect with and distinguish the unstructured and changeable circumstances. In this research field, surface tactile exploration has attracted a lot of attention [2]. In order to enable robots with this capability, a mass of scholars [3–9] have attempted to design systems that employ perception exploration to obtain relevant information about objects in the environment, and apply intelligent algorithms to analyze information to discern objects.
Traditional ground identification methods are mainly based on vision and lidar [10, 11]. However, these methods are affected by some factors such as light intensity, weather, smoke, dust, and surface covering.For the past few years, ground classification methods based on sound or vibration signals of sensors have emerged, which are characterized by simplicity, low cost, and low power consumption. The signal-based recognition methods have been widely applied in military and civilian fields, with applications focused on wheeled and legged robots [12, 13].
In recent years, with the improvement of deep learning and computer hardware performance, many deep networks (such as CNN, FCN, RNN, LSTM, GCN, and their various variants) [14–19] applied to intelligent classification, pattern recognition, and perceived interaction, and achieved certain results. Autonomous mobile robot systems are usually embedded devices. However, due to its dependence on memory and computing resources, deep learning will limit the robot’s rapid response in terms of time cost. In [20], the authors made use of the signals collected by the foot sensors of a mobile robot to differentiate interior multiple grounds. In [21], a method to discriminate outdoor ground types at different speeds with the Z-direction signals of an IMU device was proposed, but it is barely valid for indoor. In [22], a strategy for learning outdoor terrains from videos was established. The robot employs these messages to learn from various visual perception units to categorize uncharted topographies. In [23], a deep recursive neural network based on a semi-supervised learning method was proposed by using the acceleration signal of the machine, and a variety of surface textures were effectively classified. The [24] compared the classification effects of time-domain amplitude analysis, fast Fourier transform (FFT), power spectral density (PSD), and singular value decomposition (SVD), using principal component analysis (PCA) to reduce the dimensions of ground features, and then using SVM for ground recognition. The [25] took advantage of the ground classification technology of the multi-class relevance vector machine (MRVM) and the filtering algorithm based on the Bayes framework to classify the robot driving ground. Other terrains’ classification manners consist of the sonic vibration, such as the [26], which takes advantage of the pulsation feedback from the frictional contact between the robot and the terrain to identify the ground style. The [27, 28] also fused the signals collected by the sensors and the visual position information forlearning.
The research on ground recognition can not only enhance the perception and autonomous interaction capabilities of intelligent robots but gradually get rid of human dependence and enable them to work in a broader environment. In addition to realizing the integration of machines and the environment and autonomous movement and evolution, there are many realistic application scenarios: 1) Repair the position in the map, make the navigation data more reliable and realize multi-agent and collaboration [29]. 2) The intelligent prosthesis equipment based on the ground recognition method can automatically adjusts the sensitivity of joints according to the detected ground environment to help people with walking difficulties and amputees obtain a comfortable gait pattern [30–32]. 3) Planetary exploration robots (e.g., Mars or moon rover) will encounter challenging terrain and ground environment during operation. Terrain classification and recognition can help boost the autonomous abilities of mobile robots [33]. The contributions of this paper are as follows: A Novel Hybrid Evolutionary Learning (NHEL) was designed to solve the ground classification problem and a comprehensive comparison was implemented with six individual classifiers. The main parameters of the GA change adaptively with the increase of iterations, so that NHEL has enough diversity in the initial training, which helps to find the optimal solution in the later stage and has excellent convergence. Besides, NHEL also combines the advantages of GA and CG. After the GA has evolved to a certain iteration, the CG is employed to accelerate the approach to the optimal value, thereby boosting the efficiency. The hybrid of different algorithms will reduce the interpretability. However, the differences between the hybridized algorithms will increase, and it may be possible to obtain better accuracy than single. In the IMU data, there is a problem of a serious imbalance of categories. In the absence of resampling, NHEL can also successfully learn and correctly classify rare categories.
This paper is organized as follows. We describe our problem in Section 2. Section 3 introduces the data set and exploratory feature extraction in variant dimensions. Section 4 provides hybrid strategies, and the NHEL method is described in detail. Section 5 is the experiment and analysis. Section 6 presents a summary and future work.
Problem formulation
The individual learner in the homogeneous ensemble is also called “base learner”. The learners in heterogeneous (NHEL) are generated by different algorithms which are called the individual (single) learner. Whether it is a traditional ensemble or a fresh hybrid, certain combination strategies are required. There are three common ones: averaging method (e.g., simple or weighted averaging), voting method (e.g., majority voting, plurality voting, and weighted voting), and learning methods. The hybrid of different algorithms will reduce the interpret-ability and raise the complexity to a certain extent. However, the differences between diverse algorithms to be mixed will be very large, and it may be possible to achieve better and more surprising accuracy than a single algorithm while ensuring that the time cost is within an acceptable range. So based on this idea, this paper takes advantage of the characteristics of genetic algorithm heuristic search to hybridize 6 single classifiers. The output of a final hybrid learner can be expressed as:
Among them: h t (x i , y) represents a classifier learned from a set of observation samples {x i , y} through some kind of learning machines (the six learners in this paper are NBC, SVM, KNN, DT, RF and XGBoost). t = 1, …, T means that the experiment is repeated T times, and T output results of the classifiers are obtained respectively. C t represents the weighted value of each classifier during hybridizing, and the function f is used to mix the final T functions (f in this paper is a weighted voting function).
The optimal weights of the six learners are determined by the evolutionary learning algorithm, that is, the single classifiers are hybridized to obtain a hybrid classifier model through the weighted voting method. The complete description is shown in Fig. 1.
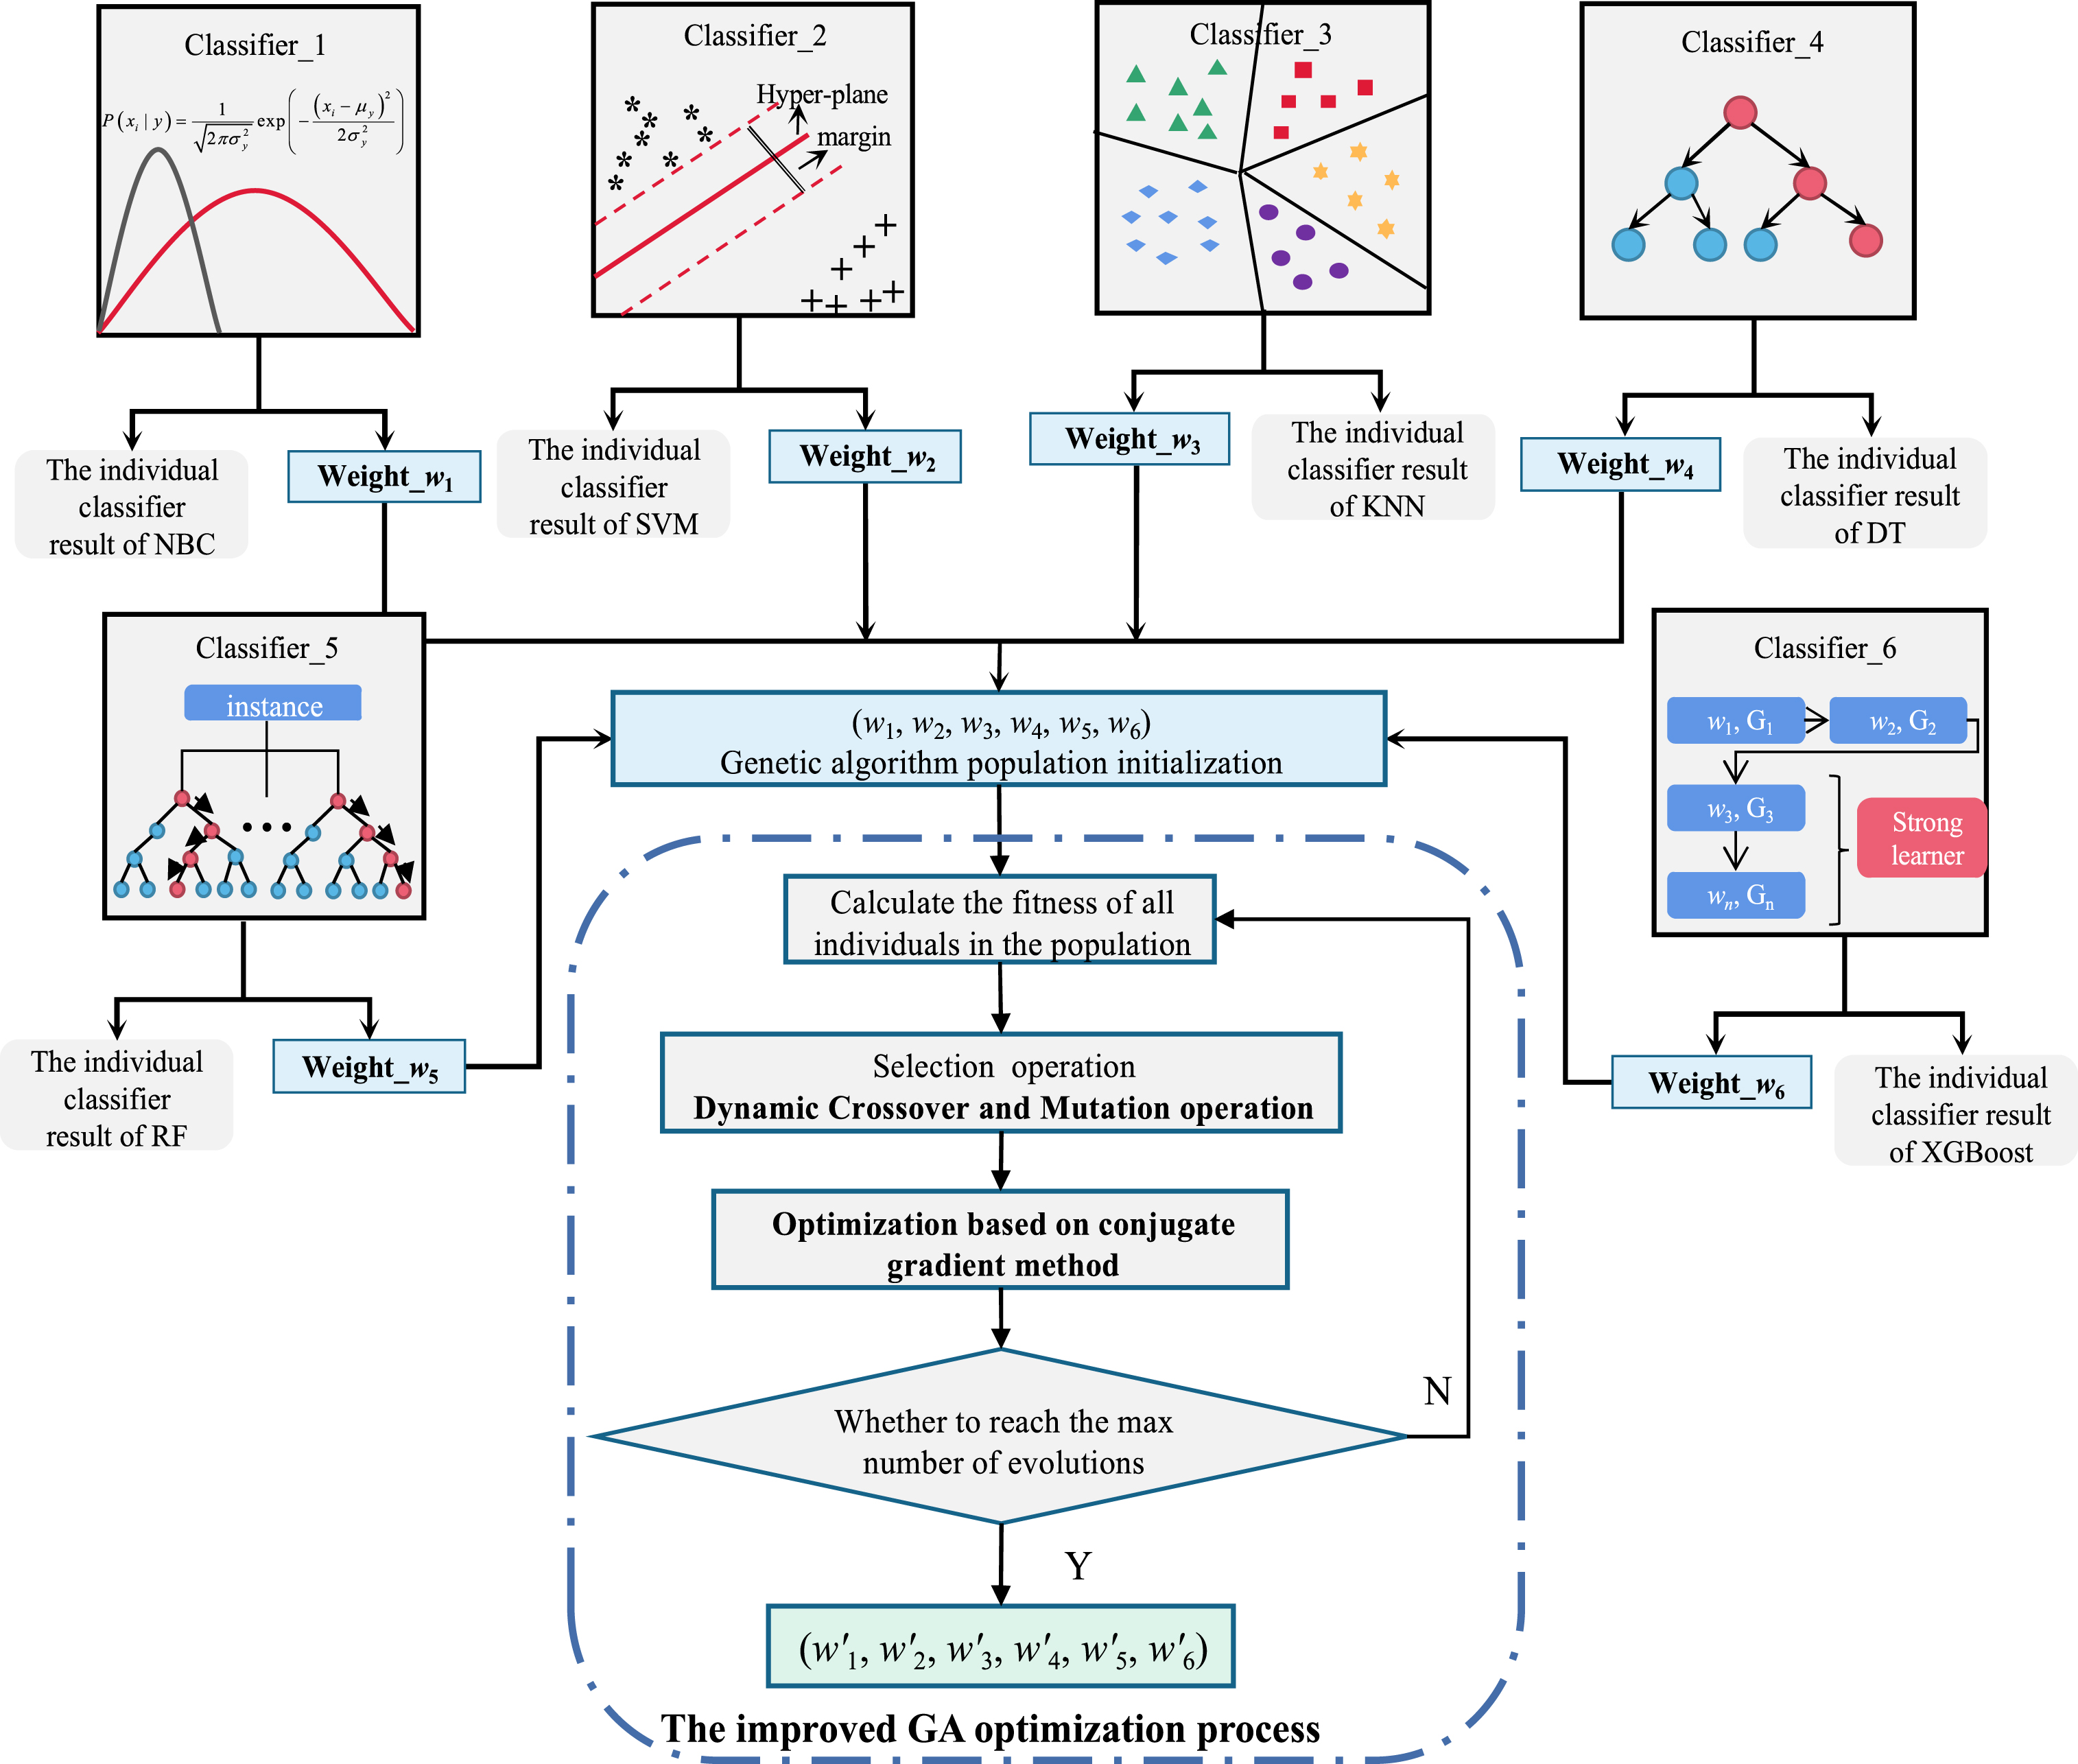
The block diagram of complete description.
This paper adopts an open-source dataset which is from Tampere University, Finland [34]. The robot time series data is collected from the Inertial Measurement Units (IMU) with XSENS MTi-300, which is an electronic device that solves orientation, navigation, and motion carrier control. The IMU data set includes accelerometer and gyroscope data, and magnetometer. Specifically, it is mainly divided into 10 sensor channels, as shown in Table 1. In particular, the data set has a total of 7,626 groups, each of which has a signal sample length of 128, and is collected on 10 channels. The number of data rows is about one million (7,626*128 = 976,128). The nine different surfaces and the corresponding 10 sensor channel signal distributions are shown in Table 2 and Fig. 2.
Robot IMU sensor data composition structure
Robot IMU sensor data composition structure
Number and proportion of the nine surface types
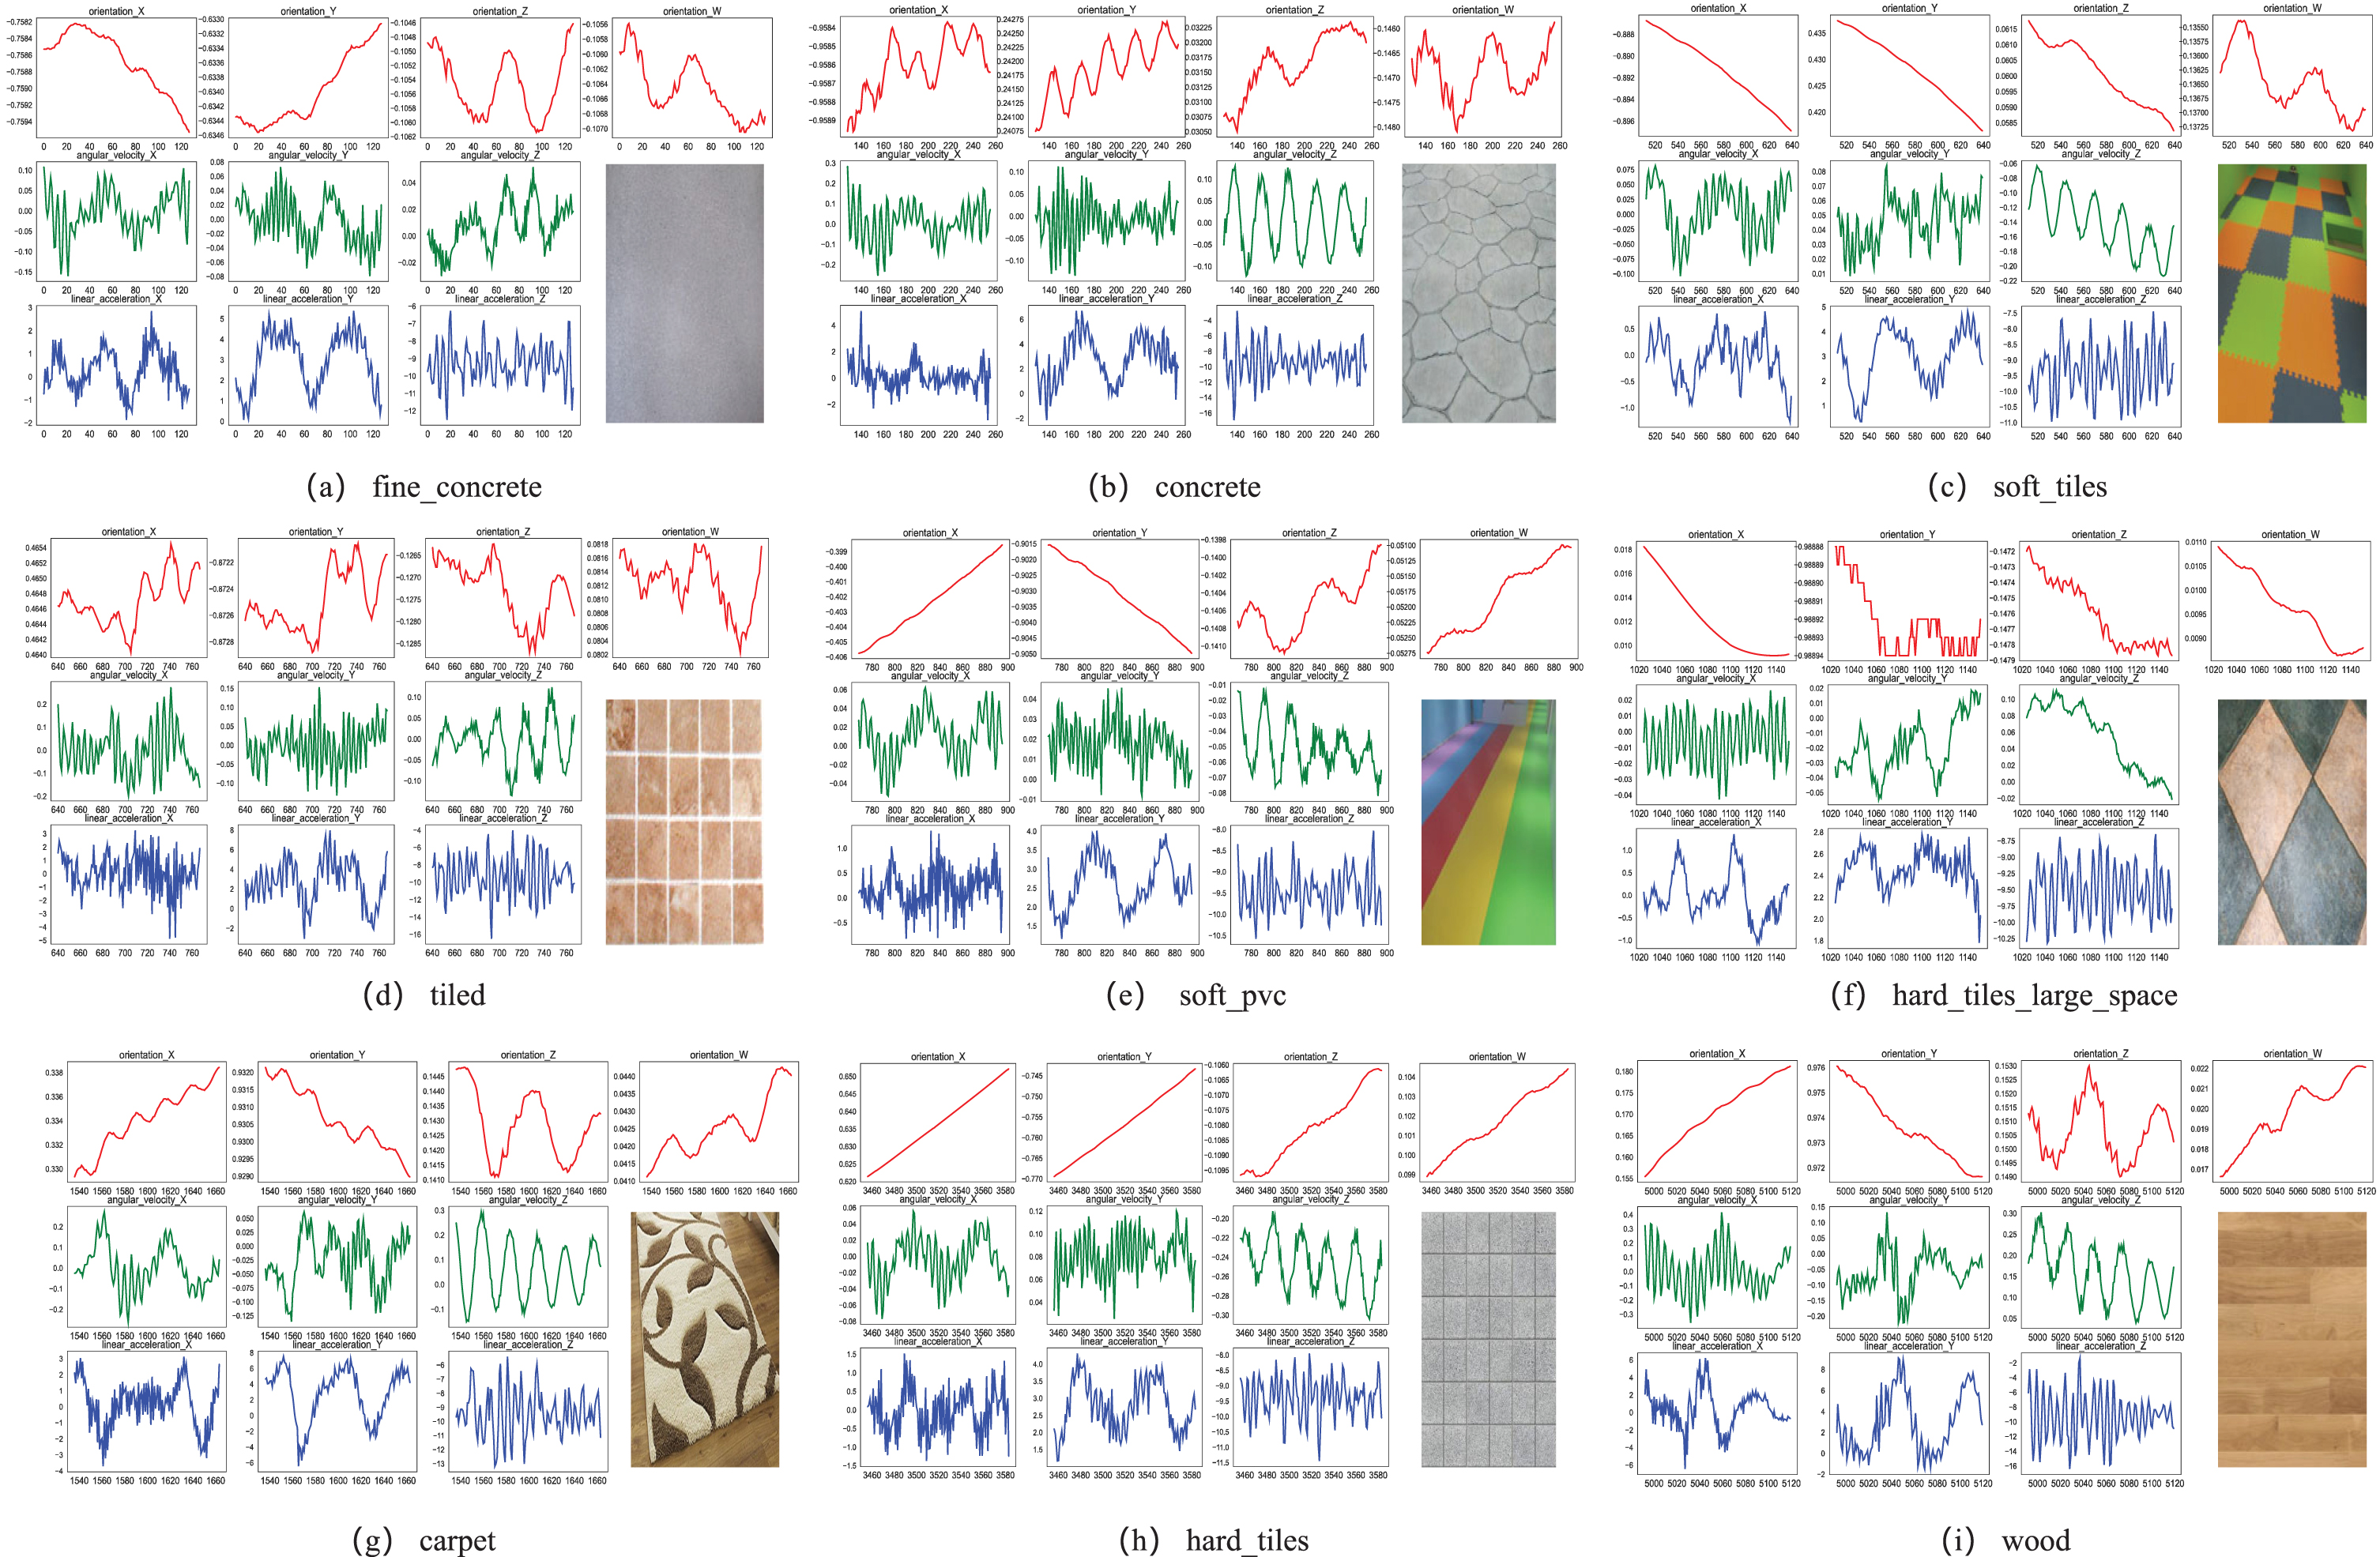
The signal distribution of ten sensor channels on nine types of surfaces. The top 4 red lines represent the orientation (x, y, z, w) is to encode the current angle as a quaternion to indicate the direction, and the middle 3 green lines are the angular velocity (x, y, z) to describe the angle and speed of movement. The bottom 3 blue lines represent linear acceleration (x, y, z) to describe the change of speed at variant times.
The Root Mean Square (RMS) of the signal is also called the effective value. As shown in Fig. 3, the RMS seems to be different across the entire group. The RMS distribution of angular velocity is scattered and the characteristics are obvious. Although the difference is not so large that it can be classified according to the RMS. However, the RMS distribution of acceleration is dense, so we will perform feature extraction in the frequency domain.
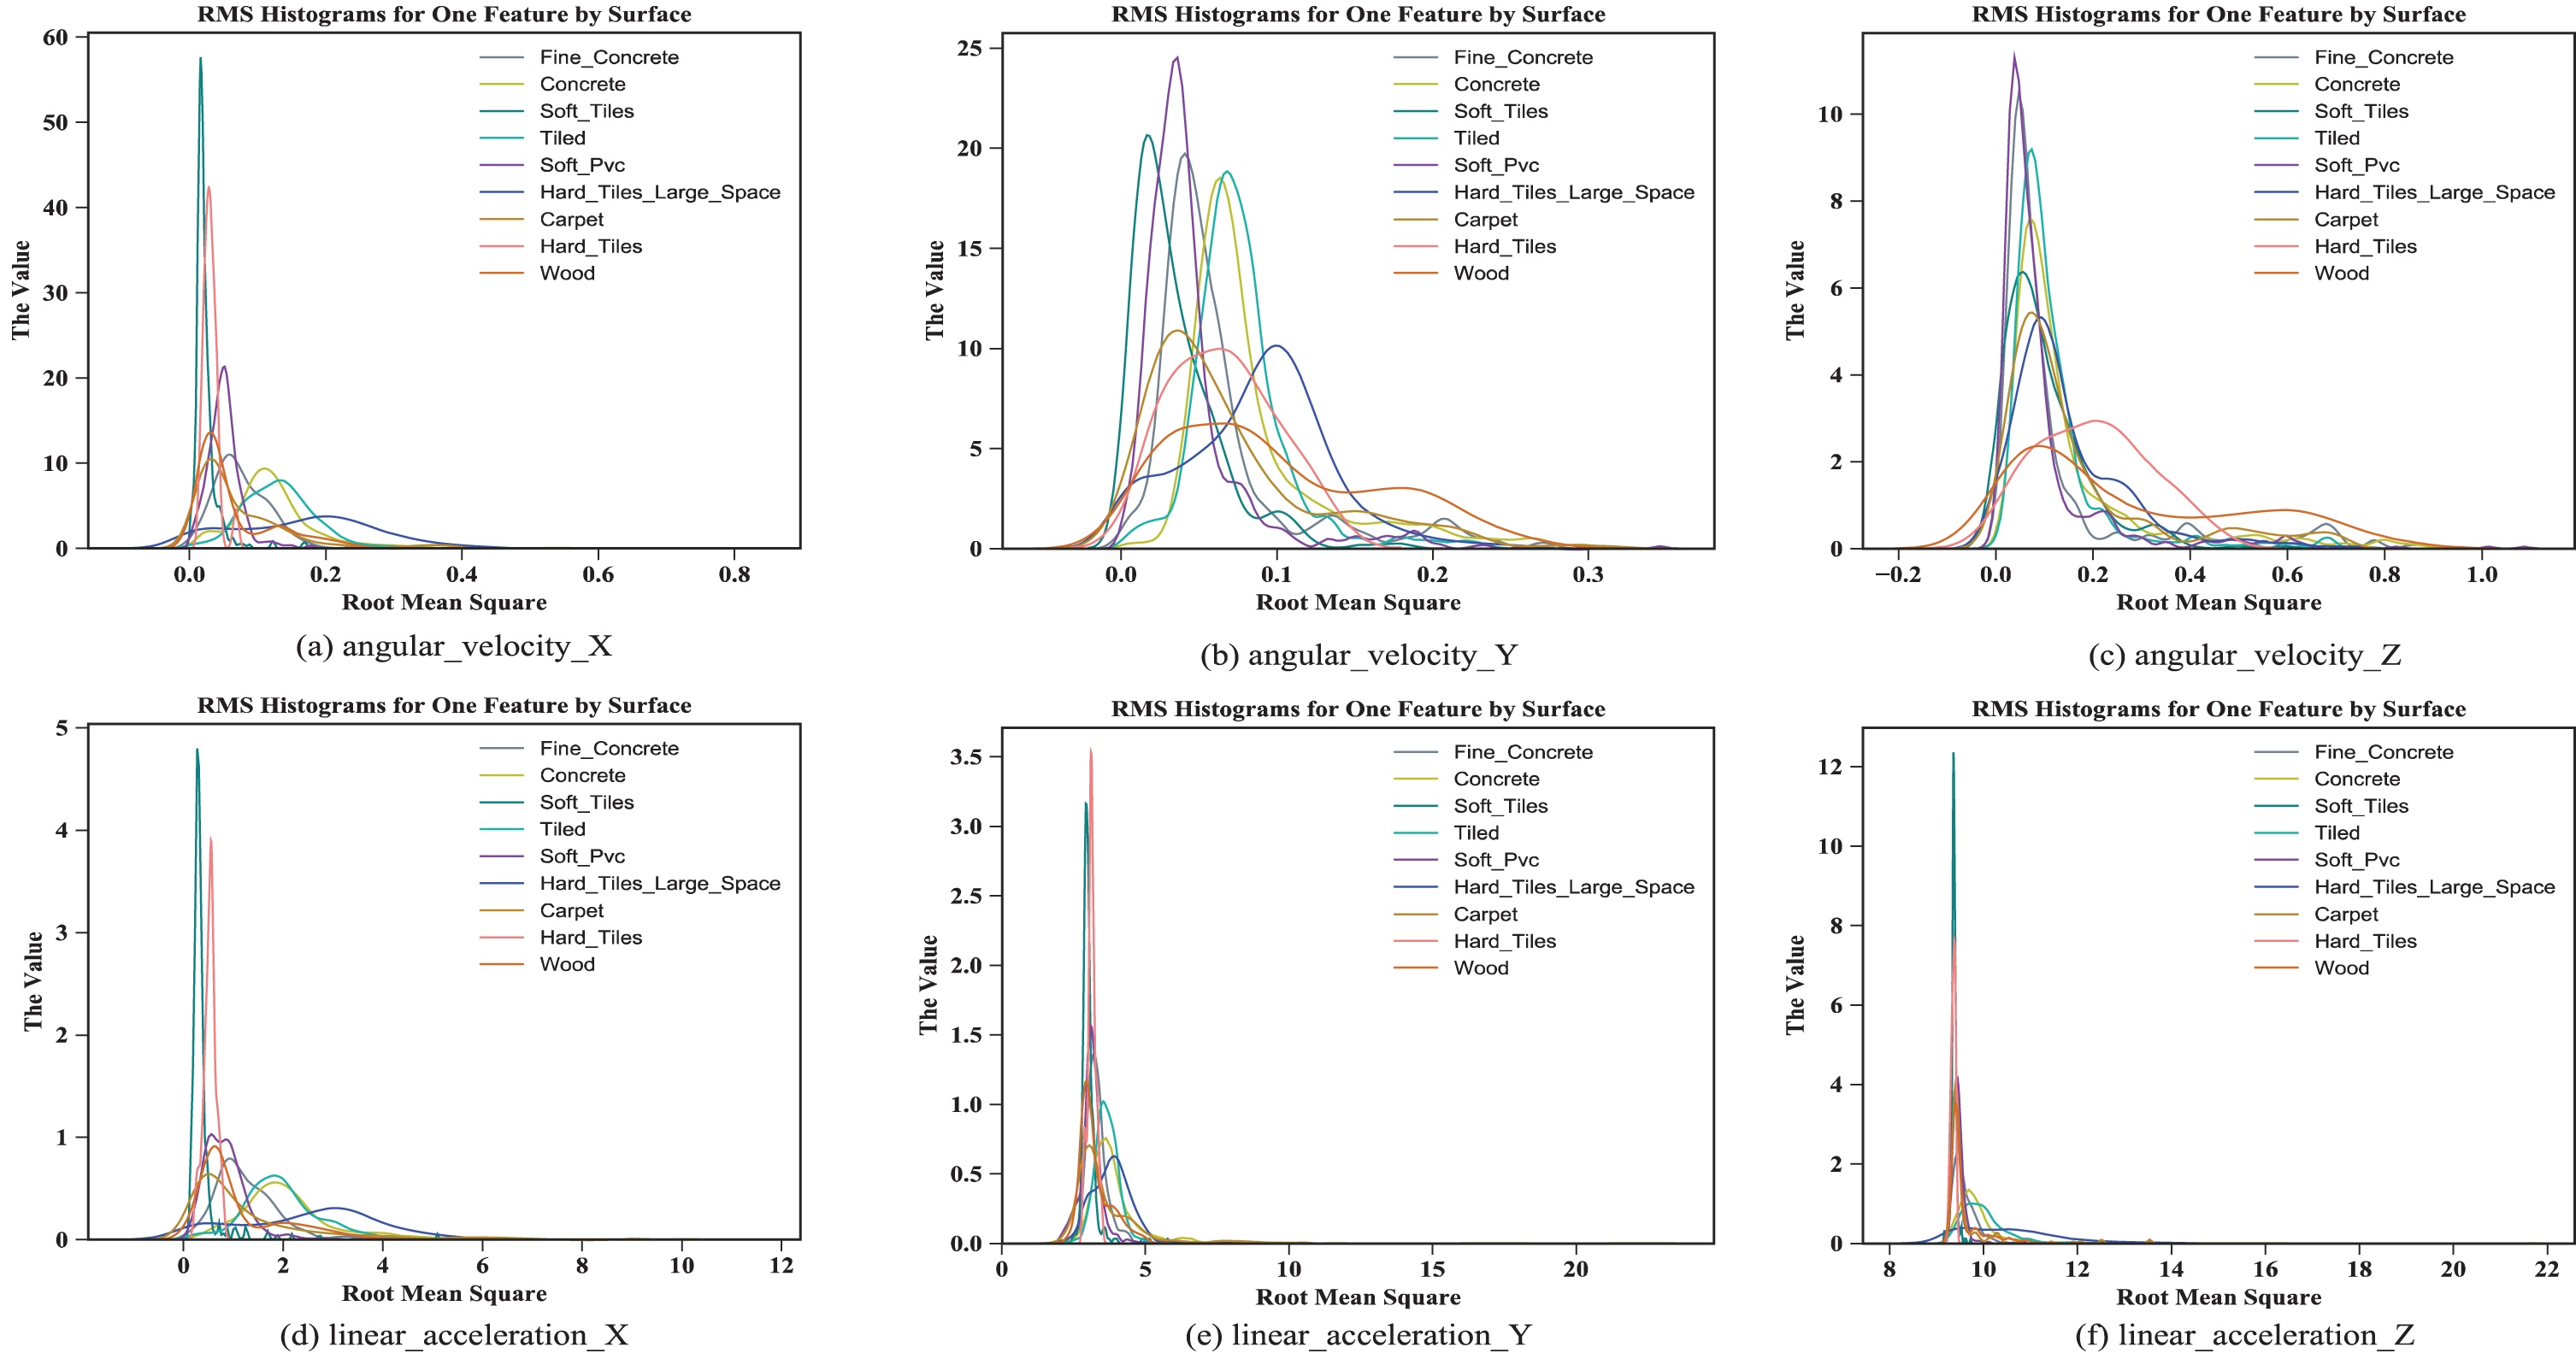
Root mean square value characteristics of angular velocity and acceleration.
For a specific signal, there are two expressions in the time domain and frequency domain. The former is the change of the signal with time, and the latter is the signal’s components at distinct frequencies. For signals that are uncertain in random processes, their frequency can be expressed by the power spectral density (PSD). Power spectrum estimation is to use a given set of sample data to estimate the PSD of a stationary random signal. It can give the energy distribution of the analyzed object with frequency, so it is widely used in engineering. The main steps of Welch method power spectrum estimation are: Divide the data segment of length N into L segments, each with M points, and adjacent segments overlap by M/2 points, so the number of segments is:
Add the same smoothing window w (n) to each segment and find the Fourier transform:
Find the average of the power spectrum of each segment:
Among them, U is the average power of w (n), and MU is the energy of M long window function w (n).
As shown in Fig. 4, the frequencies of angular velocity (x, y, z) with the PSD maximum amplitude are 10HZ, 2HZ & 15HZ, 2HZ, and the acceleration (x, y, z) when the PSD maximum are 2HZ &27HZ, 2HZ, 10HZ. The characteristic discrimination degree of acceleration in the frequency domain is obviously more distinct than that in the time domain, and the PSD amplitude of accelerations is generally larger than angular velocities. The PSD with the hard_tiles_large surface is the largest on both angular velocity (x, y) and acceleration (x, z) sensors, because the robot has a louder sound and higher energy when passing through such a hard surface.
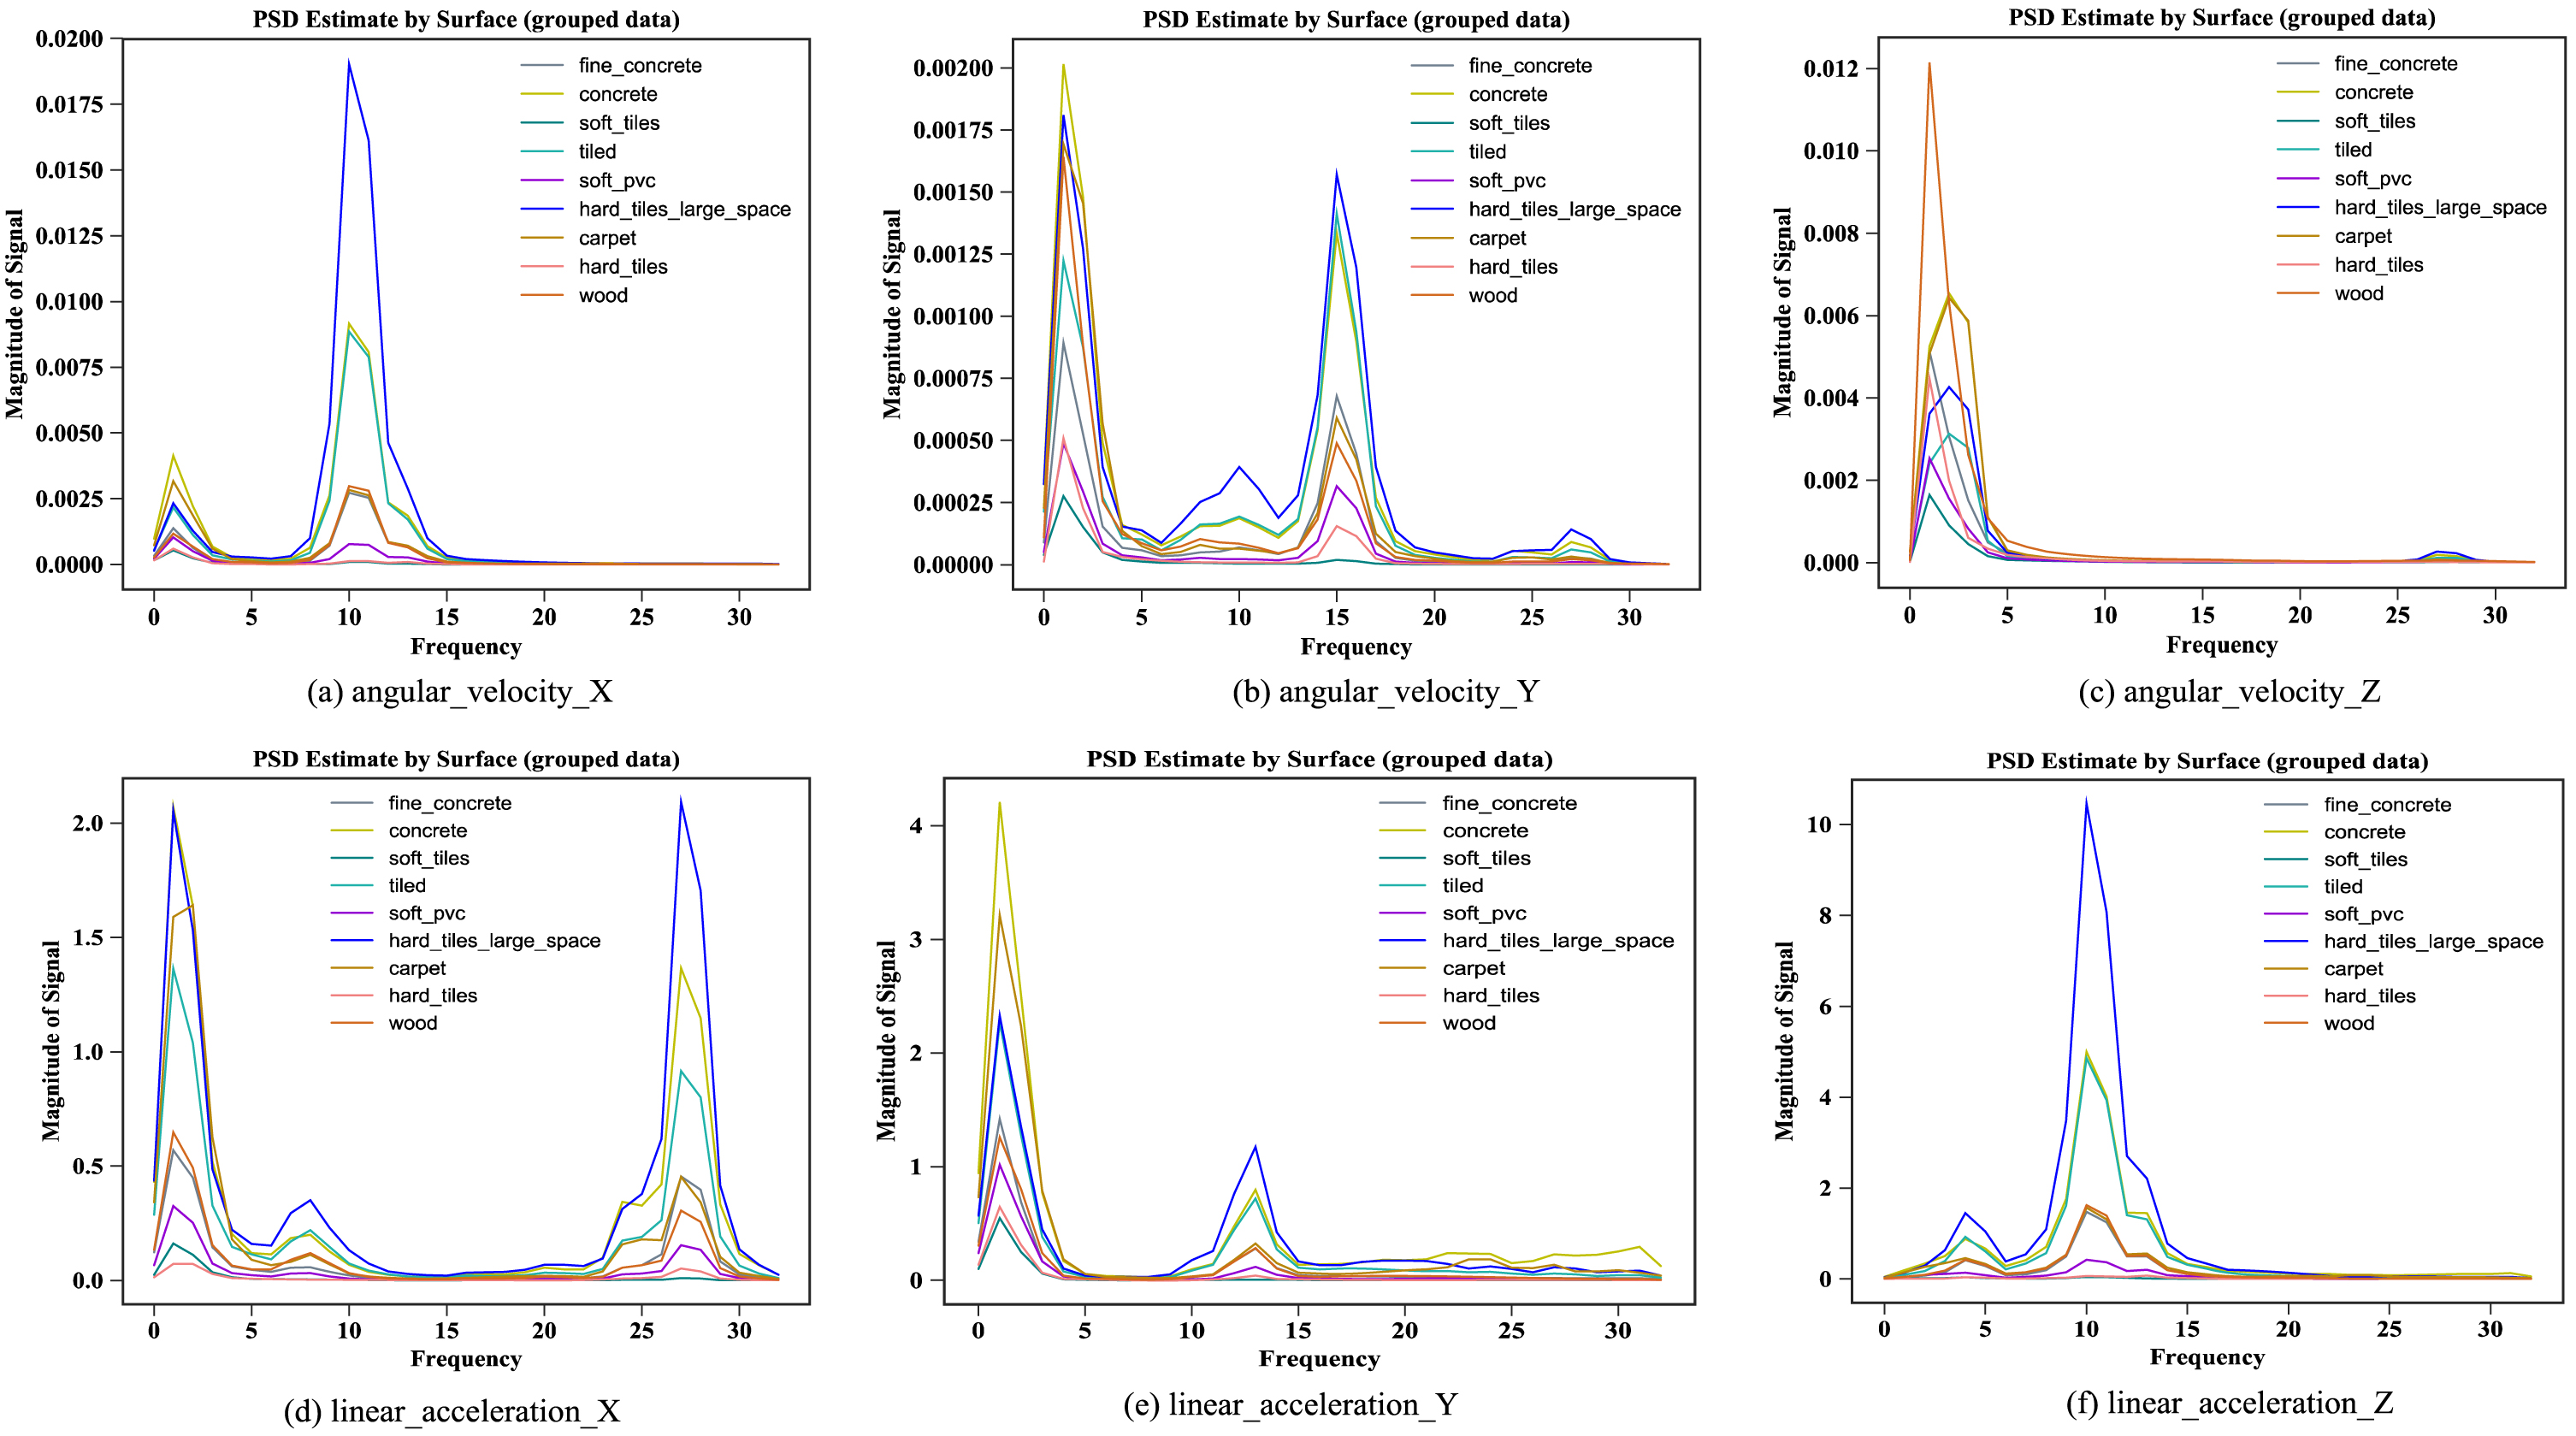
The estimate power spectral density using Welch method.
We have extracted some features (RMS & PSD) from the signal motion data, but we can also explore many other potentially meaningful features. Tsfresh (Time Series Feature Extraction on basis of Scalable Hypothesis tests) is a module of Python time-series feature mining, which automatically extracts and selects features from data [35]. By default, Tsfresh can calculate a total of 794 time-series features. There are 63 features to choose from through combination optimization. This paper selects the following 8 from the 63 features, as shown in Table 3.
The features extracted from Tsfresh
The features extracted from Tsfresh
Combine and hybrid strategies
In terms of classification algorithms, when single learning means to solve problems, it will always have its insurmountable defects such as slow convergence, weak global or local search capabilities. Ensemble learning (EL) is to upgrade the speed and accuracy of prediction by integrating the results of multiple algorithm learning in some way. Compared with a single algorithm, EL is not prone to over-adaptation. Although there are many manners to form EL, the current research on ensemble methods is mainly focused on the way of learning by changing the sample structure. For example, Boosting (e.g., AdaBoost, GBDT, XGBoost, LightGBM, and CatBoost) and Bagging (e.g., random forest) are representative algorithms by changing learning samples, which are currently both well-established. So far, in addition to the above two methods, EL also includes Bayesian Averaging, Stacking,and Blending. Most of the studies are still focused on the same algorithm to an ensemble.Because distinct algorithms have diverse learning mechanisms, it is difficult to utilize a unified standard to measure their accuracy.
Hybrid learning with genetic algorithms
Evolutionary learning adopts the genetic algorithm (GA), which is a parallel heuristic search algorithm that imitates the survival of the fittest in Darwin’s theory of biological evolution. GA generates a large number of initial solutions in the solution space and obtains the optimal unit through the cross-mutation of a large number of initial individuals. Moreover, GA has fine global search ability, but its local search capacity is weak. The gradient method is the most effective method for solving large-scale nonlinear programming problems, which has remarkable local search capabilities but poor global search. Therefore, this paper combines the advantages of the two algorithms. When the number of evolution reaches a multiple of 5, the conjugate gradient method is employed once, so that the optimal solution of the function in a defined domain can be acquired more efficiently.
The hybrid method of GA weight optimization is to adjust the weight of each weak learner with the help of the GA global search feature. The weights initially determined by the six single classifiers are introduced as the incipient input of GA for optimization and adjustment. The offspring of GA is the potential best-weight subsets of every single classifier. The flow of generating offspring by genetics is the process of searching for the best weight coefficient subset.
Specific optimization process
First of all, initializing the population which contains several individuals. If the maximum number of iterations is not reached, an iteration is entered. In the iterative process, calculate the fitness value of individuals in the population, and determine whether to enter the mating pool to form a parent-child group according to the fitness value. Then carry out crossover and mutation operations according to the probability to ensure the diversity of the population and ultimately produce the excellent offspring. The specific process is divided into the following 8 steps (from
(a)
(b)
The individual fitness steps are as follows:
Input: training set T, integer n represents n-fold cross-validation (n = 10). Output: F1 value. Divide T into the majority sample set M′ and the minority sample set S′. Divide M′ and S′ into n equal parts respectively to get Operate each N
i
, adopt N
i
as the test set, and other data sets in N as the training. Employ individual classifiers for training, test N
i
, and get the classification result of N
i
. The results of each N
i
are weighted and hybridized to obtain the classification result of the entire sample set T, and then the F1 value is calculated.
After the above calculation, the F1 value is obtained, that is, the individual fitness value.
(c)
(d)
(e)
Among them, swsize represents the number of all chromosomes, g represents the current iteration, and g max represents the max iterations. pr max and pr min are the max and min probability respectively.
(f)
Among them, f max is the max fitness in the group; f avg is the average fitness; f i is the population fitness of the individual performing the mutation; f coefficient is a constant less than or equal to 0.5.
(g) Set a0 as the initial search point of CG, set k = 1, set the number of iterations n0, and set the accuracy requirement ɛ=1×10⁻⁸. If the formula (10) is satisfied, stop the calculation (a(k) is the solution of the wireless constraint problem), otherwise, follow the (11).
Perform a one-dimensional search according to (13) and (14) to solve the problem and obtain α
k
:
Set k = k+1, go to step ②, and record the result as a(n). Calculate the fitness function of a(n), and generate an individual according to a(n). Add it to the population, and replace the individual with the smallest fitness in the population.
(h)
From the description in Fig. 5, it can be seen that the hybrid GA based on CG only needs to alternately execute GA and CG on the central individual of the population. In this way, the global search feature of GA and the local fast convergence of CG can be fully utilized, so that the algorithm can quickly converge to the global optimal solution.

An improved genetic algorithm optimization process.
The experimental environment of this paper is configured as Quad-Core Intel (R) Xeon (R) E-2224 G CPU @3.50 GHz and 16.0 GB RAM. The experiment was performed under Python3.8 and TensorFlow1.14 with Scikit-learn framework to train six single classification models. This paper uses iterative random 10-fold cross-validation to average the results of each time (training set: test = 7 : 3).
Evaluation metric
The accuracy and error rate are the two most commonly introduced evaluation indicators. Since both of them are equally vital for each category, it is not suitable for analyzing the unbalanced data. In IMU data, it is more meaningful to correctly classify rare classes than to most classes. At this time, the precision rate P and the recall rate R are more suitable than the accuracy and error rate, but both of them are usually contradictory. In order to comprehensively consider P and R, their harmonic mean F1 measurement is proposed.
ROC curve, the full name is “Receiver Operating Characteristics”, which sorts the samples according to the prediction results of the classifier and selects different cut-off points (i.e., discrimination threshold) one by one to predict the samples as positive examples in this order. ROC can be obtained by calculating TPR and FPR of the current classifier each time, and then plotting them on the vertical and horizontal axes respectively. The AUC (Area Under ROC Curve) can be adopted as an accuracy evaluation index which measures the performance of the classifier in predicting sample sorting.
The first classifier is the Naive Bayes and the probability of features is assumed to be Gaussian. It can be seen that the effect of NBC is not satisfactory. When the surface type is carpet, P, R and F1 are all 0%. Among the 9 surface types, soft_tiles has the best result, and P, R and F1 are respectively 59%, 86% and 70%. Furthermore, when the type is hard_tiles, R reaches 100%.
The second classifier is SVM. The selection of the kernel function of SVM is particularly vital. According to the scope of application of different kernels, this paper selects 3 of the 5 commonly used kernel functions (linear, RBF, and Sigmoid kernels) for testing. In the learning phase, the IMU signals are extracted and normalized, and SVM is trained using the feature matrix composed of feature vectors. During the training process, the SVM parameters (c,g) are determined by particle swarm optimization (PSO) and 10-fold cross-validation. So as to get an optimized SVM that can be performed for robot contacting ground classification. Among them, g is the kernel parameter that represents the width of the function. The classification performance of SVM largely depends on the choice of c and g. The classification result of SVM is obviously more outstanding than that of the NBC model. When the surface type is carpet, P reaches 100%. Among the 9 surface types, the soft_tiles effect is still the best. The P, R, and F1 are respectively 73%, 92%, and 81%, indicating a certain enhancement.
The third classifier is K-nearest-neighbor learning. KNN finds k nearest neighbor points of the sample points to be tested from the sample set with existing label categories, and determines the category of the sample points based on similarity. KNN is classified by measuring the distance between sample points. When the surface type is hard_tiles, the P reaches 100%, which is significantly superior to SVM.
The fourth classifier is the decision tree. The DT employs CART algorithm, which generates a tree by introducing maximum information gain at each node (i.e., Gini index to divide attributes) and threshold values. The soft_tiles works best among the nine surface types, with the P, R and F1 reaching 80%, 82% and 81%, respectively. Finally, the mean value of the three evaluation indexes of the DT is 50%, and the classification effect is more balanced.
The fifth classifier is the random forest which takes advantage of ensemble ideas to boost the performance of DT. The RF in this paper utilizes both training sample and input attribute perturbation ways (i.e., mixed perturbation) to ensure that the individual learner is outstanding enough to enhance diversity, that is, to elevate generalization ability and robustness. The main hyper-parameters for RF is n_estimators, which is the number of trees in the forest. Generally, the larger quantity, the better effect, but the calculation time will also increase. In addition, when the number of trees exceeds a critical value, the effect will not be significantly raised.
The sixth classifier is XGBoost. The final classification performance and RF are approximately the same, but the generalization capability for each class is different. The optimal parameters of each individual classifier are shown in Table 4.
The optimal parameters of each model
The optimal parameters of each model
Until now, due to the small number of samples of the hard_tiles type, only the KNN has a certain effect on this. The other 5 methods are all performed very poorly for this type. In addition, the six classifiers have stronger generalization capabilities for the soft_tiles type, and the classification accuracy is excellent. The average value of each classifier evaluation measurement is shown in Table 5. Note: The avg/total mentioned in the last row of Table 5 is a prevalence-weighted macro-average across classes. This is because there is a serious imbalance in the data, which turns the problem into unbalanced classification. This paper introduces evaluation indicators that consider sample distribution. The ROC with AUC values for 6 individual classifiers are shown in Fig. 6.
The results of six individual classifiers
The results of six individual classifiers
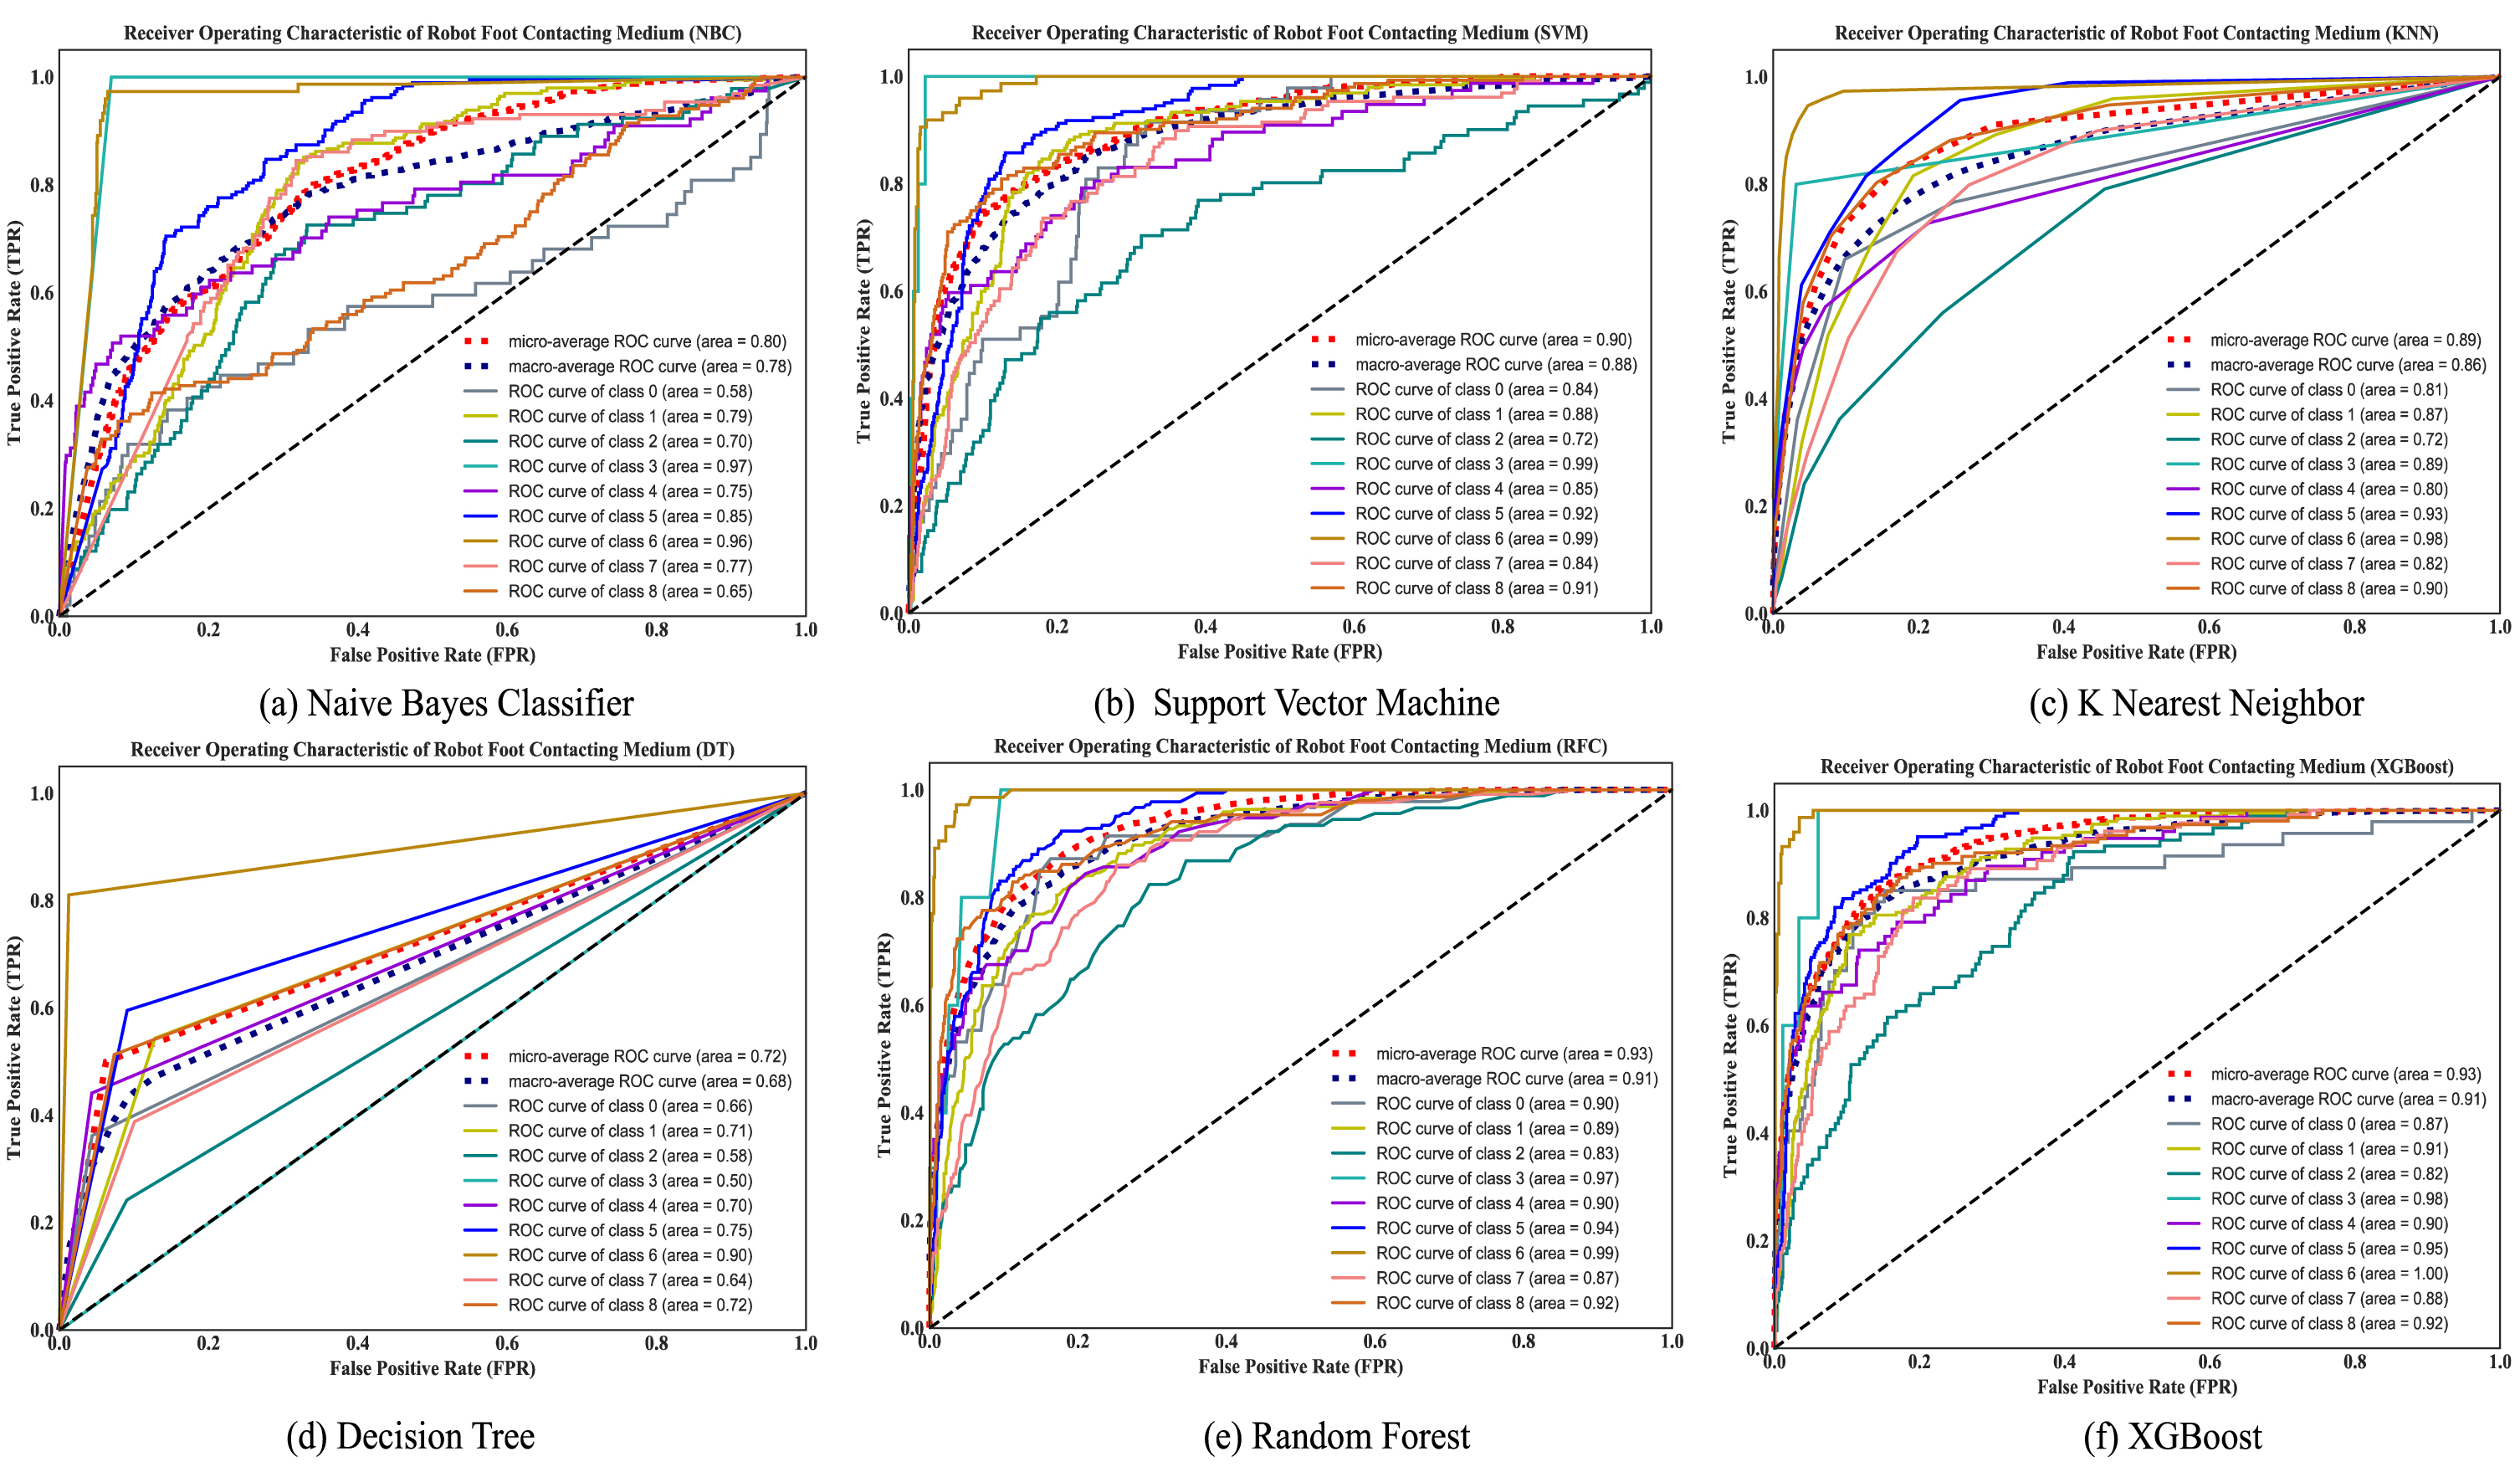
The ROC curves with AUC values for six individual classifiers.
GA is a global search algorithm, which adopts the selection mechanism of natural survival of the fittest, and can always find the global optimal in most cases. The NHEL model optimizes the weights of six individual classifiers by employing GA, and applies the weighted voting method to output the hybrid classifiers. At present, in most genetic operators, the crossover and mutation rates during population evolution are constant and remain unchanged in the iterative process, which will affect the convergence of evolution at the later stage and lead to the increase of NHEL training time. In order to accelerate the search of chromosomes in the process of evolution and promote the GA to find the optimal solution as soon as possible, this paper determines the crossover and mutation probability according to the different stages of community evolution, and introduces the conjugate gradient method to enhance the search mode, so as to accelerate the global optimum.
The weights of individual classifiers and the classification results of NHEL model are shown in Tables 6 and 7, respectively. Among the six classifiers, RF has the best performance, with P, R and F1 reaching 64%, 64% and 62% respectively. Finally, through the weighted voting method, the single classifiers are hybridized to obtain NHEL model, and its performance is dramatically elevated. The P, R and F1 all have remarkable improvement compared with 6 individual classifiers. The generalization ability and robustness of the NHEL model to the 9 surface environments is also boosted significantly.
The optimized weights of each classifier
The optimized weights of each classifier
The NHEL classifier result
In addition, the IMU has a severe imbalance of the categories, and NHEL can correctly classify the minority/rare categories (i.e., hard_tiles) without using over-sampling treatment for a few samples (e.g., classic SMOTE) or under-sampling for most classes (e.g., classic RUS). The 10-fold-cross validation with P, R, and F1 values of the NHEL and specific confusion matrix are shown in Fig. 7.

The 10-fold-cross validation and confusion matrix.
Under the background of the booming development of big data and the intelligent robot industry, the existing navigation technology has a certain delay in identifying the driving form and environment of the robot. For this reason, it is very crucial to enhance the autonomous tactile perception and recognition of robots. In this paper, through the IMU data, effective feature extraction is carried out in multi-dimension, including RMS, PSD and Tsfresh time-series feature mining. Moreover, the parameters of the six individual classifiers (NBC, SVM, KNN, DT, RF, XGBoost) were adjusted and trained. The GA optimized by the conjugate gradient is applied to optimize weights. The amount of storage required in the number of optimization iterations is small, has step convergence, high stability, and does not require any external parameters.
NHEL achieves satisfactory results in robot ground recognition. The P, R, and F1 reach 91%, 87%, and 86% respectively, which boosted by 25% on average compared with the optimal single classifier. The proposed method has some limitations for the real realization of data fusion and evolution between the machine and the environment. In the future, we will conduct in-depth research to enhance the interpretability of the NHEL classifier and find a more systematic hybrid method.
Footnotes
Acknowledgments
This work was supported in part by the National Key Research and Development Program of China under Grant 2018YFB2100800.