
Abstract
Patch-based deep convolutional neural network (DCNN) has been proved to have advanced performance in no-reference image quality assessment (NR-IQA). However, these methods generally take global quality score as the quality score of each patch mainly since local quality score is not provided. Unfortunately, the perceived quality of image patch is difficult to maintain a high degree of consistency. Thus, the use of the same global quality score in different patches of the same image may hinder training of DCNNs. In this paper, we propose a universal and nearly cost-free model called Gaussian Random Jitter (GRJ). According to the uncertainty of the perceived quality, GRJ divided the training images into high-confidence distorted images and low-confidence distorted images, and reasonably assigned different local quality scores to each patch through specific gaussian functions with the global quality score as the mean value and the undetermined hyperparameter as the standard deviation. We took one of the most advanced patch-based DCNNs models as backbone and tested the improved performance over three widely used image quality databases. We show that our model can further improve the performance of patch-based models and even help them comparable with those of state-of-the-art NR-IQA algorithms.
Keywords
Introduction
Nowadays, most digital images are captured using camera equipment in real scenes. In the process from capture to storage, such as compression, transmission and other stages may introduce unpredictable noise, resulting in different degrees of image distortion. Therefore, Image Quality Assessment (IQA), which is used to quantify image quality, plays an increasingly crucial role in monitoring, maintaining and enhancing image quality. Since human beings are the terminal receivers in most digital image applications, the most reliable approach to evaluate the quality of an image is subjective assessment [21]. However, subjective image quality assessment is too time-consuming and expensive to be applied in most real-world applications. For example, the differential mean opinion score (DMOS), as a subjective image quality measure, requires evaluations of a large number of human observers.
On the contrary, objective image quality assessment aims to design algorithms that can predict perceived image quality accurately and quickly. Perceived image quality, usually represented by the difference between the distorted image and the corresponding reference image, is a very abstract but intrinsic feature of the image. According to the availability of reference image, the objective IQA methods are divided into three categories: full-reference IQA (FR-IQA), reduced-reference IQA (RR-IQA), and no-reference IQA (NR-IQA). Since the reference image is fully accessible in FR-IQA, state-of-the-art FR-IQA methods, such as IFC [16] and FSIM [26], have achieved a level highly consistent with human’s evaluation of image quality. Compared with FR-IQA, RR-IQA can only utilize partial features extracted from the reference image, while NR-IQA is completely unknown for the reference image. Although NRIQA is probably the most difficult problem in IQA, it has been closely concerned by researchers in the context of the fact that reference images are not available in most practical applications.
Most of the conventional NRIQA algorithms are generally divided into three categories: (1) Distortion-specific, (2) Natural scene statistics (NSS), and (3) Training-based [8]. The distortion-specific based no-reference IQA algorithms focus on specific distortion types, such as JPEG2000 [15], JPEG [22]. Such NRIQA algorithms employ unique priori information about known distortion, which makes it difficult to generalize to unknown distortions. The NSS-based NRIQA approaches rely on the assumption that natural images have statistical regularity which is changed when distortions exist. This type of NRIQA algorithm designs a reliable statistical model to describe the characteristics of natural images, and then predicts image quality by measuring variations in NSS [3, 25]. For example, Mittal et al. [10] proposed BRISQUE, which extracted features of NSS in the spatial domain. Moorthy et al. [11] proposed BIQI that promotes extracting NSS features from the wavelet domain. The performance of these NRIQA methods is still lower than that of the advanced FRIQA methods, most likely due to the unavailability of the reference image and the lower correlation between extracted features and perceived quality [6].
In recent years, with the rapid development of deep learning, more and more researchers have applied deep convolutional neural networks (DCNNs) and other models to NRIQA, making tremendous progress in train-based NRIQA methods [4–6, 18]. Rather than using original images as inputs, a patch-based learning approach, where the input image is divided into multiple patches, is more applicable for deep learning [5]. However, these approaches generally take global quality score as the quality score of each patch mainly since local quality score is not provided.
Inspired by visual attention of the human visual system [13], one of the important reasons why human observers evaluate the same image differently is that they focus on different areas of this image. As shown in Fig. 1, for the same distorted image, especially the moderately distorted image, it is impossible to maintain a high degree of consistency in the perceived quality of different regions. Hence, the global subjective quality score can not adequately represent the quality of each patch. In addition, it is time-consuming to obtain a reliable subjective score for each patch. Therefore, it is of great significance to seek a universal and efficient approach that makes each patch correspond to a reasonable pseudo-subjective quality score and further improve the performance of the patch-based model.
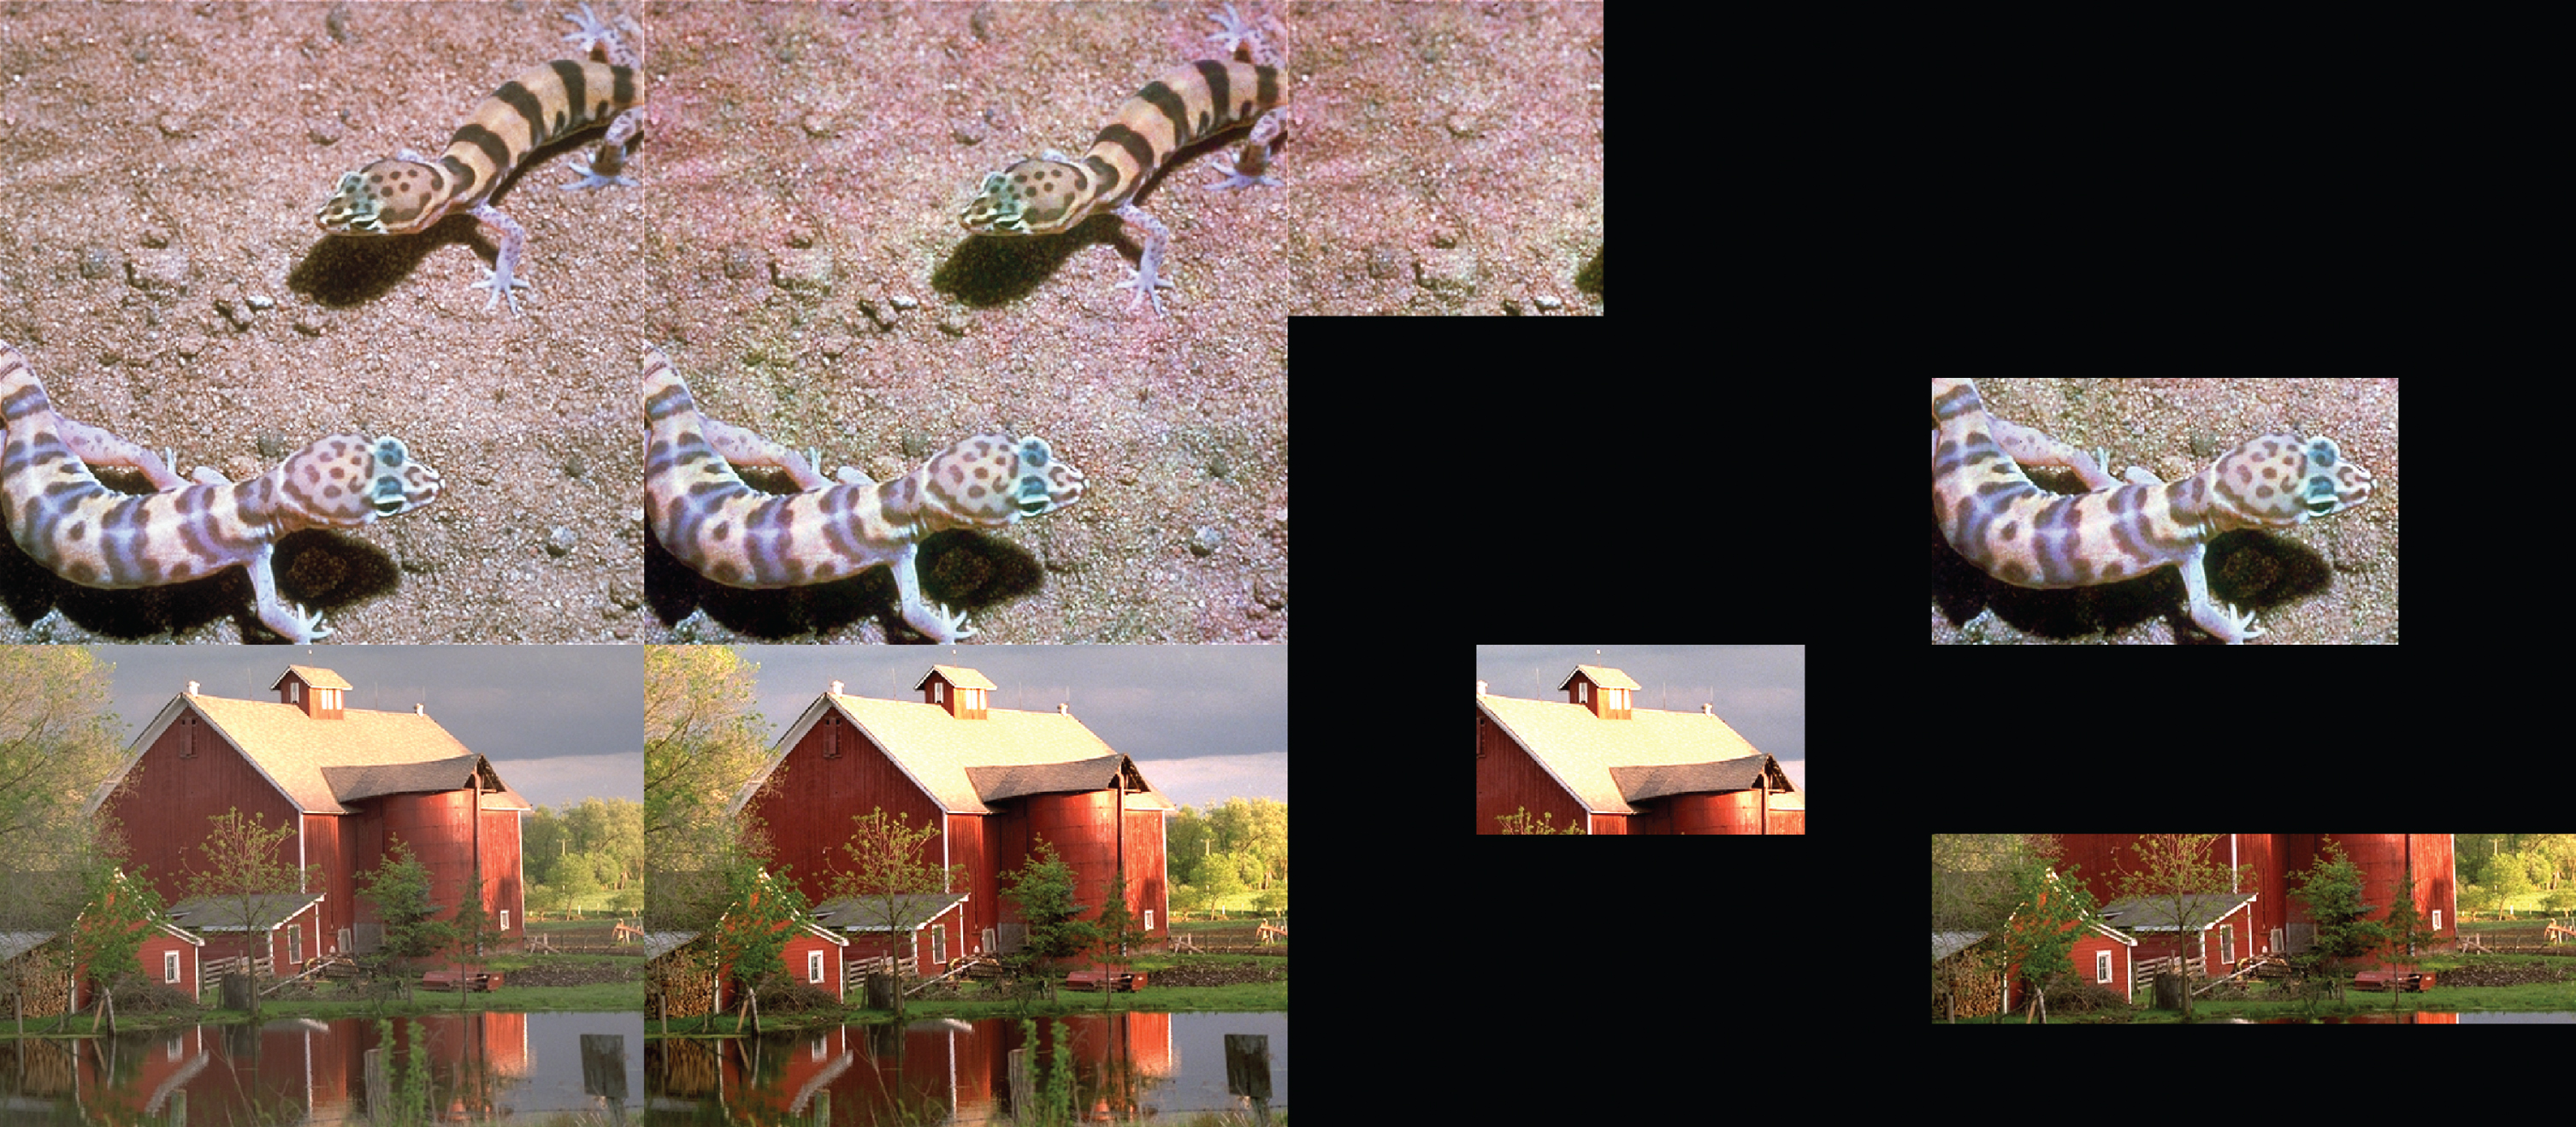
An illustration of our motivation. The two reference images in the first column belong to the CSIQ and TID2013 database, respectively. The second column is moderately distorted images of the corresponding reference image. The third and fourth columns show portion of the corresponding distorted image, with the rest shown in black. The perceived quality of the third column is significantly worse than the fourth column. Hence, for the same distorted image, it is impossible to maintain high degree of consistency in the perceived quality of different regions.
Inspired by the fusion of Gaussian map and coordinate map for better generalization ability in human pose estimation task [19], it is of significance to explore whether adding gaussian map to subjective score label can also further improve the generalization ability of models in no-reference quality assessment. At the same time, as shown in Fig. 3, different human observers tend to give similar assessments for severely distorted images (c) and slightly distorted image (a), while there are significant differences in their evaluations for moderately distorted images (b). This means that it is important to use a different gaussian function for the subjective quality score of each distorted image to avoid introducing unnecessary noise.
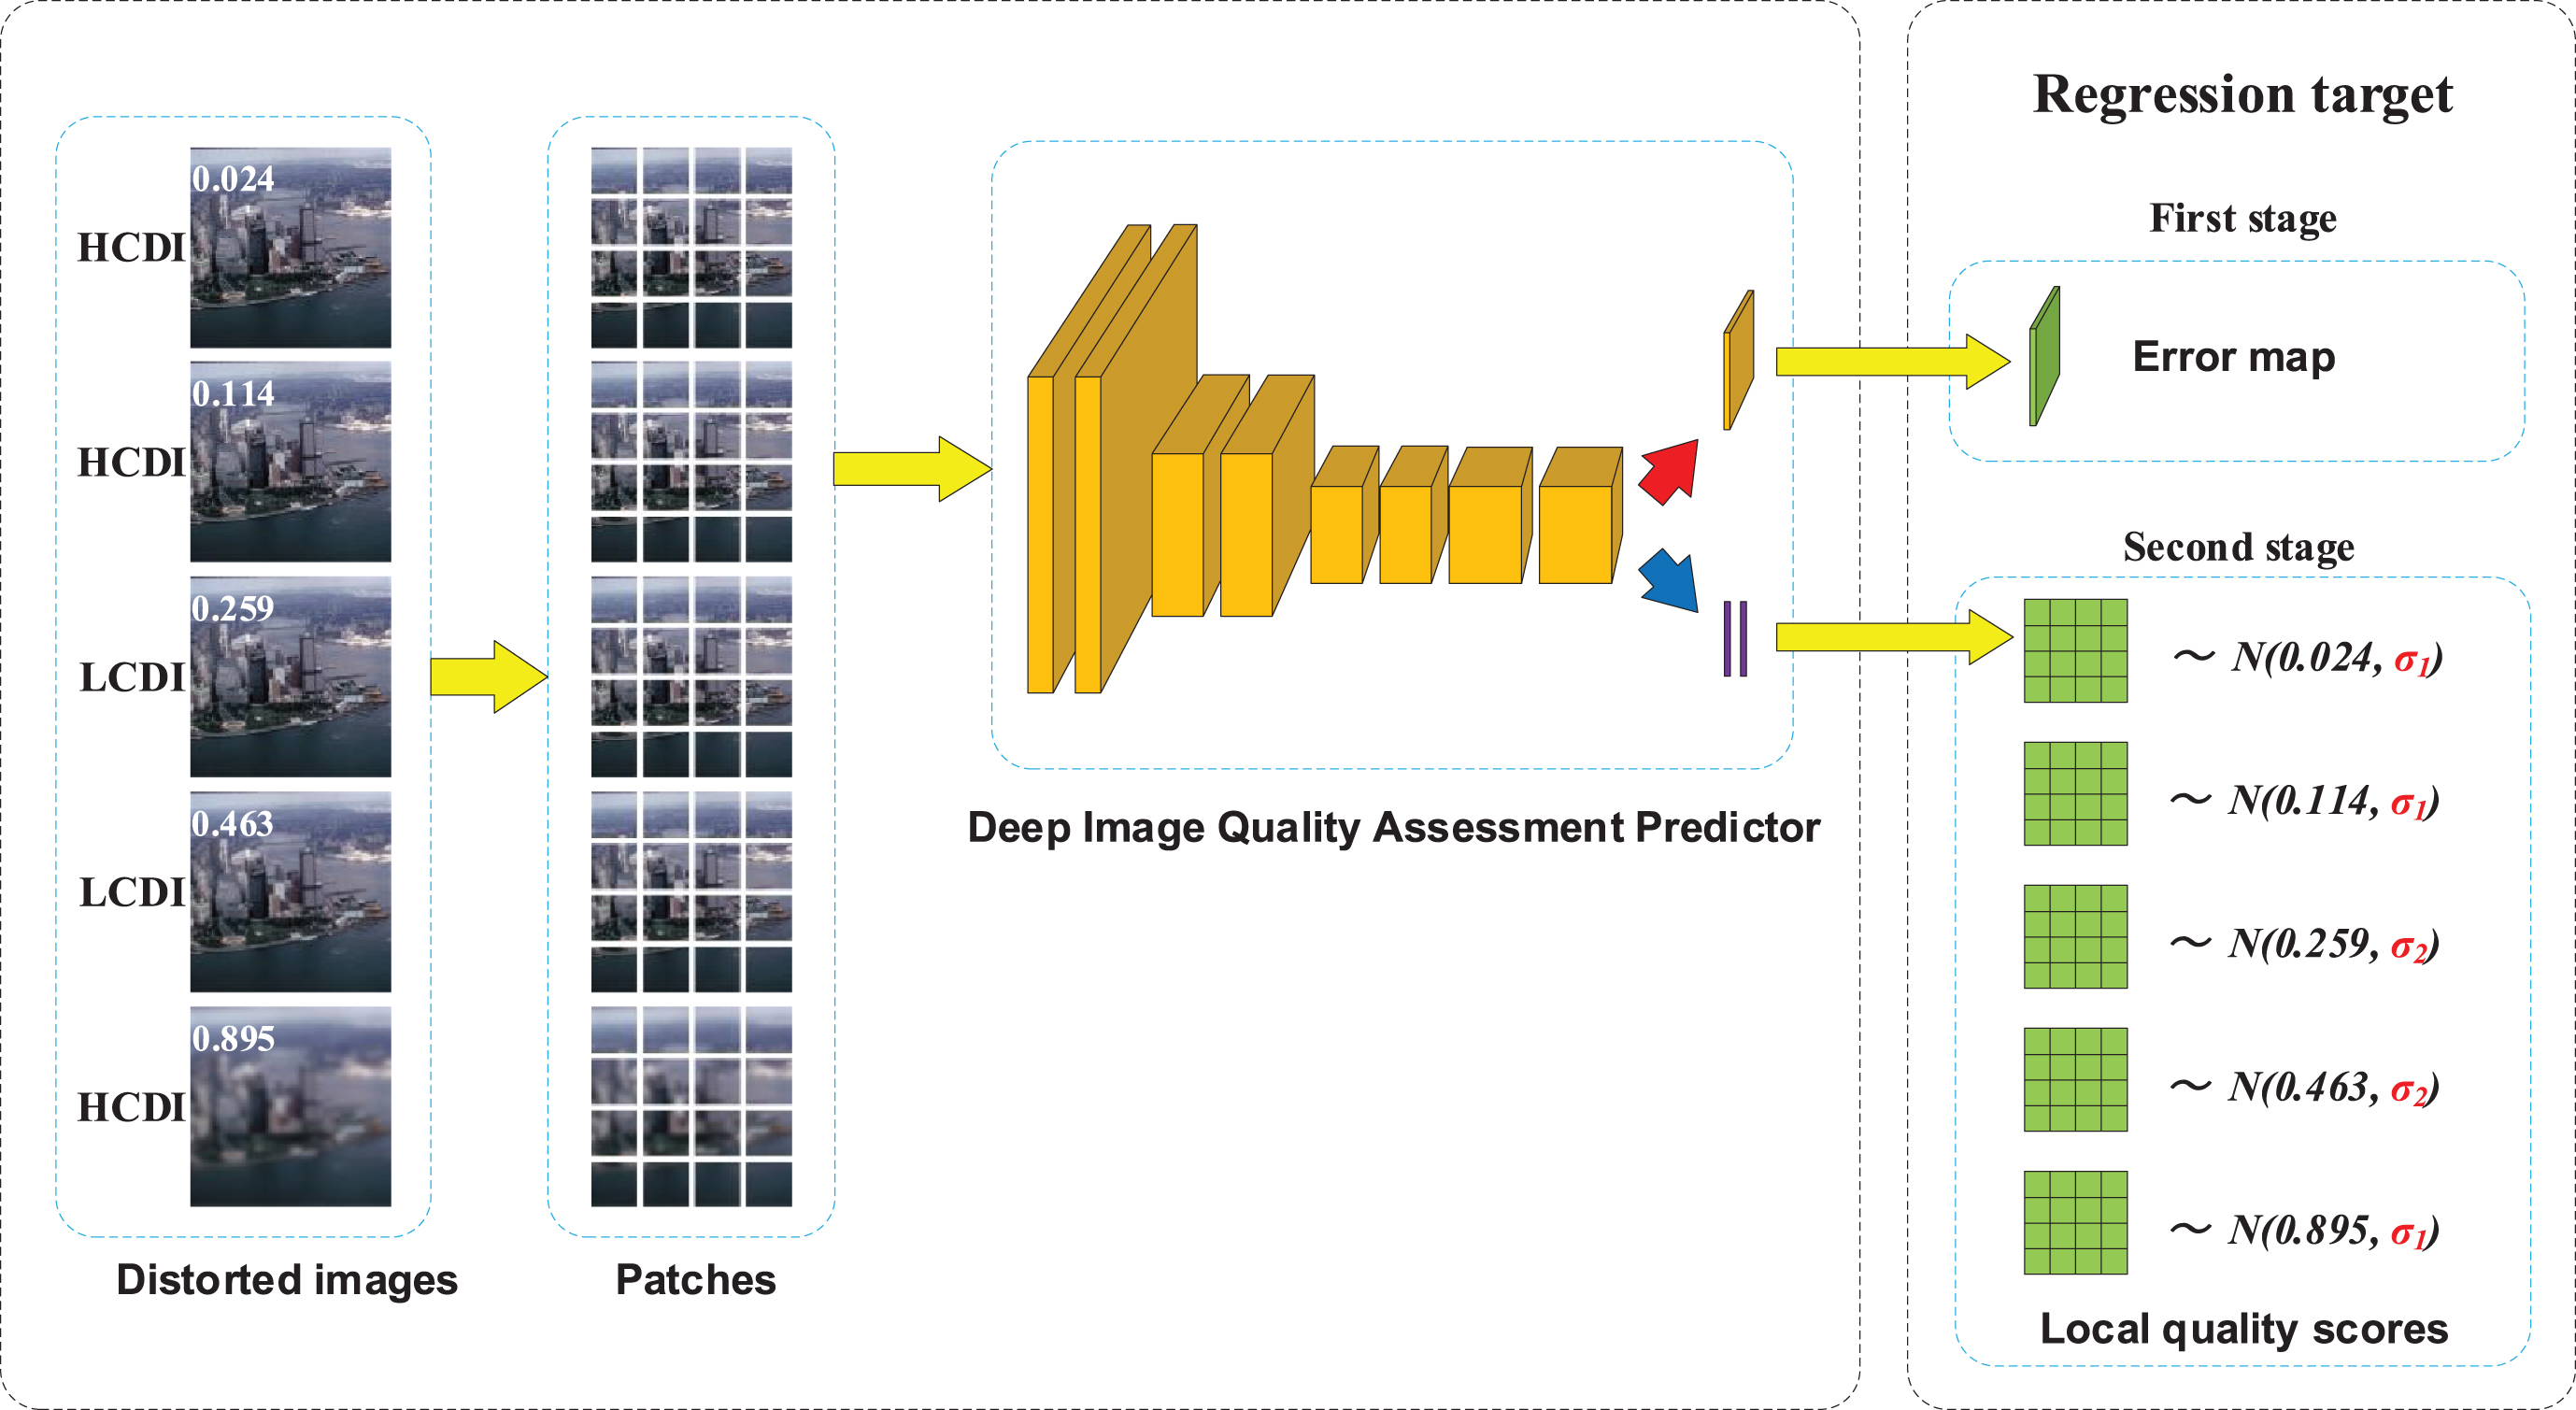
The overall framework of our gauss-guided patch-based deep convolutional neural networks for no-reference image quality assessment. We use Deep Image Quality Assessment Predictor (DIQA [6]), one of the most advanced patch-based DCNNs models, as the backbone for the improvements. Golden blocks indicate the convolutional layers, and Purple blocks indicate fully connected layers. The red (blue) arrows indicate the flows of the first (second) stage. The segmented patches of the same distorted image are used as the input of the model, and finally regress to the local quality scores obeying a specific Gaussian distribution. HCDI means high-confidence distorted image. LCDI means low-confidence distorted image.

Another illustration of our motivation. (a)-(c) GB distorted images in the CSIQ database at the distortion levels of 1, 3, and 5. The standard deviation of subjective quality score is 0.080, 0.219 and 0.044, respectively. Range of quality score: [0,1]. The evaluation difference of observers on image (b) is significantly greater than that of image (a) and image (c). Hence, For images of the same category but different levels of distortion, There are significant differences in the standard deviation of the observer’s score.
Based on the above observations, we propose a simple and efficient model called Gaussian Random Jitter (GRJ). Different from using global quality scores derectly, GRJ makes full use of the visual attention of the human visual system (HVS). In the training process, according to the uncertainty of the perceived quality, GRJ divides the distorted image into the high-confidence distorted image and the low-confidence distorted image, and reasonably assigns different local quality scores to each patch through specified gaussian functions with the global quality score as the mean value and the undetermined hyperparameter as the standard deviation.
As shown in Fig. 2, our research based on one of the most advanced patch-based models call DIQA [6]. In the popular LIVE, TID2013 and CISQ image quality databases, the performance of the proposed method is tested and compared with the DIQA. We show that GRJ can further improve the performance of the patch-based model and aslo improve the generalization ability nearly cost-free. Since the performance of the data-driven approaches is largely dependent on the data used for training, we analyze the generalization ability of the proposed model in cross-database experiments.
Our contributions can be summarized as follows. GRJ nearly cost-freely achieves further improvement of generalization ability in patch-based NRIQA model. GRJ effectively solves the key problem that patch-based NRIQA model lacks local groundtruth quality score in a simple and efficient way.
The remainder of this paper is organized as follows. In Section 2, we provide an overview of the advanced technologies associated with the work described in this paper. Section 3 detailedly describes the previous FRIQA-based local image quality estimation and the GRJ model we proposed. In Section 4 the proposed approach is evaluated and compared to original DIQA model. We conclude the paper and make an outlook to future work in Section 5.
In recent years, deep learning has been widely applied in many fields [2, 20], which makes joint optimization of feature extraction and quality regression possible. One of the universal methods to apply deep learning to NRIQA is patch-based training, which divides the global image into several local images as the input of the model and obtains multiple local quality score labels through global quality score (MOS/DMOS) for supervision training.
As shown in Table 1, the approaches to obtain local image quality pseudo-label of each image are roughly divided into two categories. The first method is to use equal global quality score for all patches in an image [4] [6] [18]. As mentioned in Section 1, the global subjective quality score cannot adequately represent the quality of each patch, since it is difficult to maintain a high degree of consistency in local perceived quality. The second method is to assign different local quality scores to each patch through a specific algorithm. For example, Kim et al. [5] used complex FR-IQA-based metric to evaluate multiple patches of the same distorted image, and took this score as the local quality score of each patch. However, as shown in Table 1 and Fig. 6, it greatly increases the computational complexity.
Comparison of approaches to obtain local image quality pseudo-label among different NR-IQA algorithms. EGQS means Equal Global Guality Score. AC means Algorithm Complexity
Comparison of approaches to obtain local image quality pseudo-label among different NR-IQA algorithms. EGQS means Equal Global Guality Score. AC means Algorithm Complexity
In contrast to past work, we note that observers vary widely in their assessment of moderately distorted images, while other levels of distortion tend to be consistent. At the same time, inspired by the visual attention of the human visual system, we also notice that an important reason why observers assess the same distorted image differently is that they focus on different areas of the image. More coincidentally, as shown in Fig. 1, the perceived quality of different regions is difficult to maintain a high degree of consistency, especially in moderately distorted images. In addition, in human pose estimation task, the two-dimensional Gaussian map and groundtruth coordinate map are combined to form heatmap, which significantly improved the generalization ability of the model. Based on these observations, we propose a simple and universal model called GRJ. GRJ makes full use of the visual attention of the human visual system, reasonably distributes the local quality scores to multiple patches of the same distorted image. We show that GRJ further improves the model generalization ability at almost no cost.
Our goal is to propose a simple and general method to estimate the local quality score of the image. Instead of using global quality score or complex FRIQA metric [5], we consider the regional characteristics of distorted image and allocate different pseudo-subjective quality scores to each patch of image reasonably.
FRIQA-based local image quality estimation
Recently, full-reference Image Quality Assessment (FRIQA) has been able to obtain a quality score that is highly correlated with the perceived quality of the distorted image. Therefore, it is feasible to use FRIQA metric to estimate the local quality score of images. Kim et al [5] generated local quality maps using FR-IQA metrics such as structural similarity index (SSIM) [27], gradient magnitude similarity deviation (GMSD) [23], feature similarity index (FSIM)[26], and visual saliency-based index (VSI) [24]. When the local quality maps were derived, the local score was obtained by taking the average of the local quality map for each patch over the N · N window:
where M metric is a local quality map derived from FR-IQA metric (SSIM, GMSD, FSIM, VSI).
Obviously, the use of complex FRIQA metrics reduce the computational efficiency of the entire model. More importantly, with the improvement of image resolution and the increase of training data, the computational efficiency will decline more significantly. Compared with the above work, we propose a simple and effective method to estimate the local quality score with full consideration of the human visual system.
Inspired by the visual attention of the human visual system, one of the important reasons why observers evaluate the same image differently is that they focus on the local areas of the image rather than the whole image.
As shown in Fig. 3, the perceived quality of the severely distorted image (c) and the slightly distorted image (a) tends to be consistent. This means that even if different observers focus on different areas of the image, it will not have much effect on the final score. Therefore, the overall quality of the image is relatively certain. In other words, MOS/DMOS can reflect the local quality of different regions properly.
On the contrary, there is significant difference in the quality scores of the moderately distorted images (b) among different observers, indicating the overall quality of the image is high uncertain. Therefore, the observers’ attention to different areas of the image had a great influence on the quality score. In other words, MOS/DMOS can not reflect the local quality of different regions properly.
Hence, according to the uncertainty of the overall quality, the distorted image can be divided into high confident distorted image and low confident distorted image. Obviously, high confident distorted image corresponds to severely distorted images and slightly distorted image. Meanwhile, low confident distorted image corresponds to moderately distorted images.
If the range of MOS or DMOS for each database is defined as R
d
, then the distorted images can be divided into the high confident distorted image (HCDI) and the low confident distorted image (LCDI) in a reasonable quantitative way. This can take the following form:
Furthermore, considering the important role of the gaussian function in human pose estimation task, we creatively regarded the scores of different observers on the same distorted image as a gaussian distribution with a certain mean value. Obviously, the mean of gaussian distribution is the MOS (DMOS) of distorted image. At the same time, it can be seen from Fig. 3 that the standard deviation of the gaussian distribution corresponding to the score of the high confident distorted image is smaller, while that of the low confident distorted image is larger.
Based on the above analysis, we define two hyper-parameters named σ1 and σ2, which correspond to the average standard deviation of high and low confident distorted image, respectively.
Therefore, the differences between the scores of different observers can be mapped to the scores of different patches, which are subject to a gaussian distribution with the corresponding MOS (DMOS) as the mean and σ1 or σ2 as the standard deviation. The gaussian distribution can take the following form:
In addition, the 3 sigma rule of gaussian distribution can accurately control the jitter range of quality score, which avoids introducing noise due to excessive jitter. Note that the noise refers to some areas of a distorted image where the quality scores are seriously deviated from the mean opinion score.
In a word, for the same distorted image, the standard deviation (σ1 or σ2) is first determined by its MOS (DMOS), then a gaussian distribution is determined. The gaussian distribution can reasonably change the subjective score of multiple patches corresponding to the distorted image, improving the generalization ability of the patch-based model.
Databases
The following datasets are used to evaluate the performance of GRJ. The basic information of the three databases is tabulated in Table 2 and the examples are shown in Fig. 4. CSIQ [7]: A total of 866 distorted images with six different distortions: JP2k compression (JP2K), JPEG compression (JPEG), White Gaussian (WN), Gaussian blur (BLUR), Global contrast decrements and pink Gaussian noise (PGN) derived from 30 reference images. Each image is associated with a Differential Mean Opinion Scores (DMOS) in the range [0,1]. Lower DMOS indicates higher quality. TID2013 [14]: 3000 distorted images with 24 different distortions derived from 25 reference images. In the cross-validation experiment, we only considered four distortion types that are shared by both LIVE and CSIQ datasets, i.e. JP2k, JPEG, BLUR, and WN. Each image is associated with a Mean Opinion Score (MOS) in the range [0,9]. In contrast to DMOS, lower MOS indicates lower quality. LIVE IQA database [17]: 779 distorted images with five different distortions: JP2k compression (JP2K), JPEG compression (JPEG), Gaussian blur (BLUR), White Gaussian (WN) and Fast Fading (FF) derived from 29 reference images. Each image is labeled with a Differential Mean Opinion Scores (DMOS) in the range [0,100].
Comparison of IQA database in terms of numbers of reference (REF.) images, distorted (DIST.) images, distortion types, type of subjective scores and range of subjective scores
Comparison of IQA database in terms of numbers of reference (REF.) images, distorted (DIST.) images, distortion types, type of subjective scores and range of subjective scores

Examples of three datasets (CSIQ [7], LIVE [17] and TID2013 [14]). (a), (e), (i) Reference images in three datasets. (b)-(d) Gaussian blur distorted images in the CSIQ data set at the DMOS of 0.024, 0.259 and 0.895 (smaller DMOS value corresponds to better quality). (f)-(h) Gaussian blur distorted images in the LIVE data set at the DMOS of 21.680, 33.289 and 60.106. (j)-(l) Gaussian blur distorted images in the TID2013 data set at the MOS of 6.108, 4.542 and 3.027 (larger MOS value corresponds to better quality).
In the following ablation experiment, 80% of the data set was used for training and the remaining 20% was used for testing. There is no overlap among these two parts. In the cross-validation experiment, all subjective scores of the three IQA Databases were rescaled to [0, 100]. At the same time, the DMOS and MOS are reversely matched.
To evaluate the performance of the GRJ model, we conducted experiments on one of the most advanced open source models: DIQA, and used two standard measurements, i.e., Spearman’s rank-order correlation coefficient (SROCC) and Pearson’s linear correlation coefficient (PLCC) [1]. First, the PLCC can be derived by
To investigate the contribution of GRJ, we fixed all variable hyperparameters in the original DIQA. In other words, each ablation experiment ensured that only the standard deviations of our model changed. When the training set and testing set are randomly divided, each ablation experiment must be repeatedly trained and tested to ensure the repeatability of the experiment, which leads to a large training time of DIQA based on deep neural network. Therefore, considering the size of the IQA database, it is reasonable that training and testing were conducted on CSIQ, LIVE IQA and TID2013 database.
Effect of the standard deviations
The experimental results with and without the standard deviations of proposed model on the LIVE database, CSIQ database and TID2013 database are shown in Table 3. Using hyper-parameters of our model, SROCC and PLCC significantly improved in three databases, especially the CSIQ database and TID2013 database. Meanwhile, Fig. 5 shows the evolution of SROCC and PLCC in order of epoch during training and testing of different methods on CSIQ dataset. With the growth of epoch, it is obvious from the four sub-graphs of Fig. 5 that the performances of both DIQA and our model is gradually improved and eventually converged.
SRCC and PLCC comparison for two models on the LIVE IQA, TID2013 and CSIQ database
SRCC and PLCC comparison for two models on the LIVE IQA, TID2013 and CSIQ database
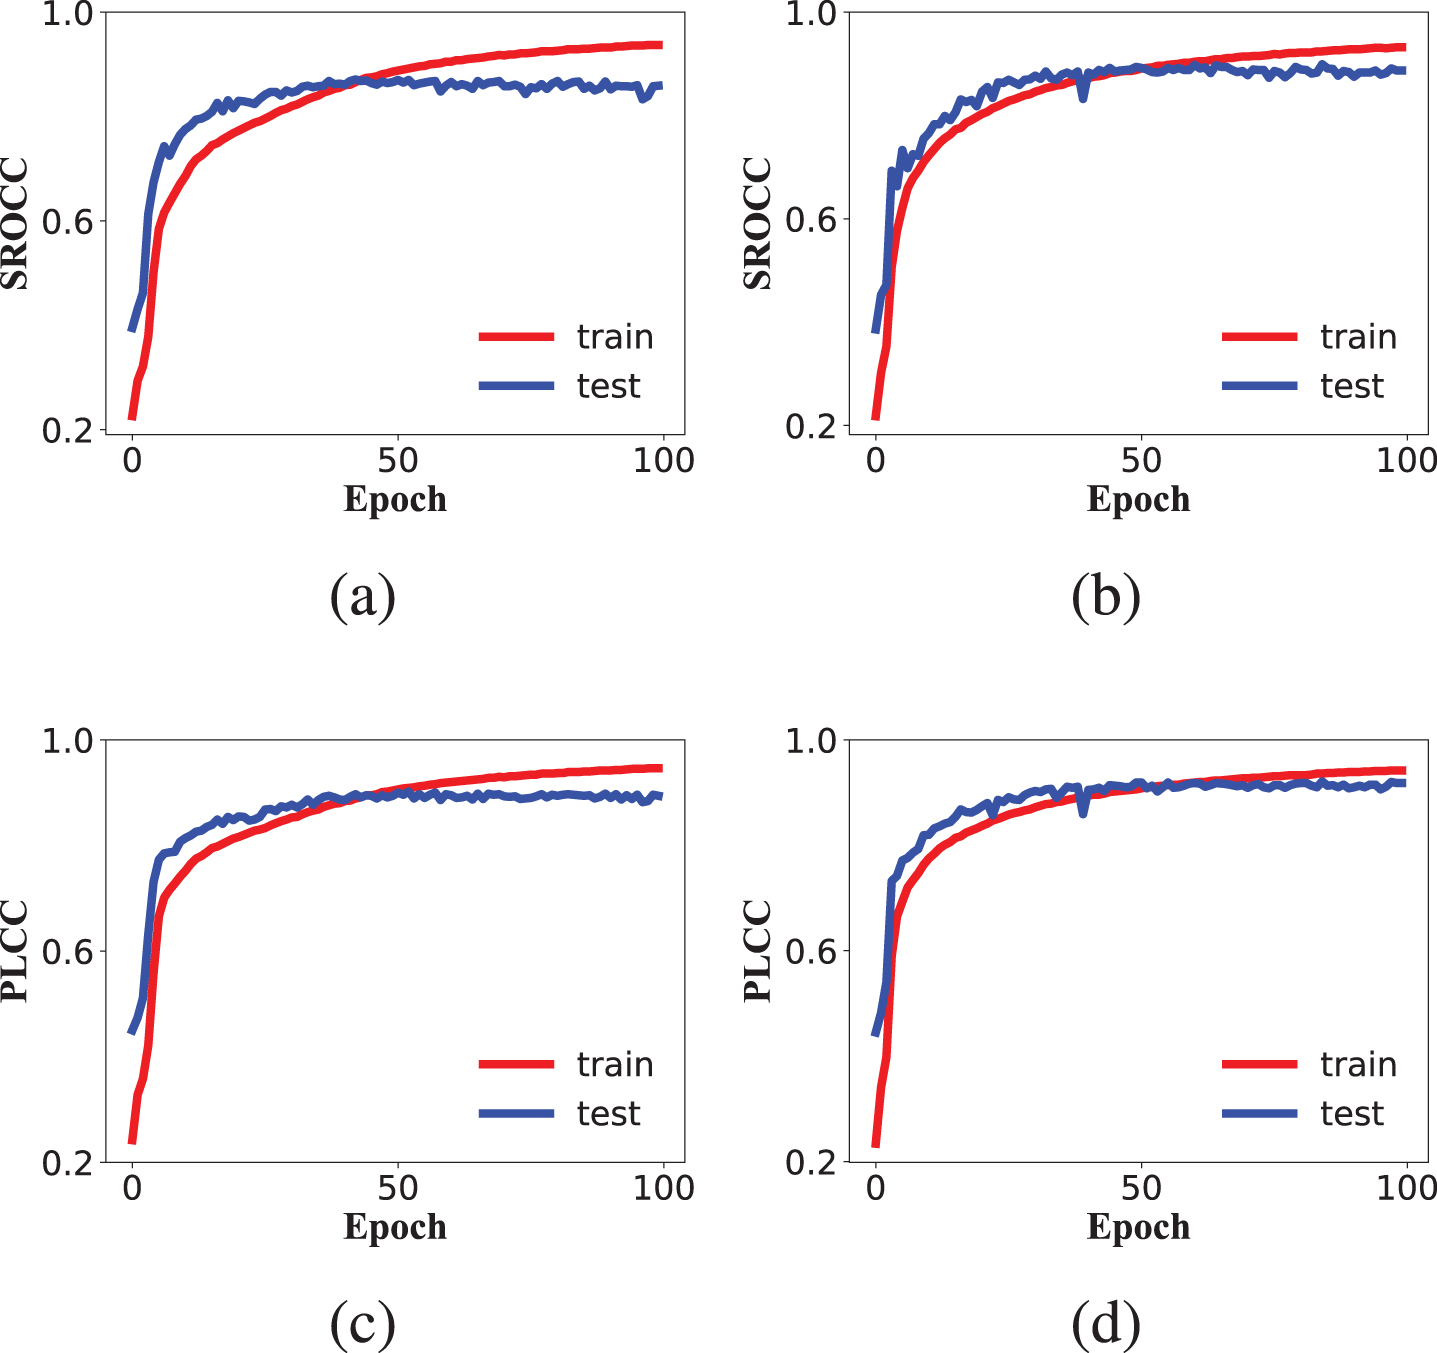
The evolution of SROCC and PLCC in order of epoch during training and testing of different methods on CSIQ dataset. (a) and (c) represent evolution of SROCC and PLCC in order of epoch during training and testing of model DIQA on CSIQ dataset, respectively. (b) and (d) represent evolution of SROCC and PLCC in order of epoch during training and testing of model DIQA+GRJ (σ1 = 0.02 and σ2 = 0.04) on CSIQ dataset, respectively.
We conducted experiments on CSIQ datasets to explore the sensitivity of the same standard deviation on different training sets. Table 4 compares the performance of models with different training sets but the same standard deviation. In most cases, when a standard deviation combination is valid in one training set, it is also valid in other training sets. Unfortunately, there are still a few cases where the same combination of standard deviations can produce exactly the opposite effect in different training sets. Therefore, standard deviation combinations are sensitive to different training sets.
SRCC and PLCC comparison for two models on the different training sets of CSIQ database
SRCC and PLCC comparison for two models on the different training sets of CSIQ database
In addition, for the same training set, the increase of standard deviation combination makes the improvement degree of the model in this paper smaller, even lower than the original DIQA model.Considering the limitation of the image quality score range, the above phenomenon is probably caused by the overlarge hyperparameters introducing more noise and concealing the improvement given by the label diversity to the original model.
Therefore, when we try to select appropriate hyperparameters to further improve the performance of the model, we should choose a relatively small standard deviation combination as a starting point according to the limitations of the scoring range. If the hyperparameters work, it is worth trying to slowly increase or decrease the hyperparameters to get a better solution.
In order to verify GRJ not only improves the performance of DIQA in the same data set, but also improves the generalization ability among cross-data sets, the model was trained from one database, and then evaluated on other databases. Only the four overlapping distortion types (GB, JPEG, JPEG2000 and white noise) were used in LIVE, CSIQ and TID2013 databases. σ1 = 3 and σ2 = 6 are applied to all cross-data generalization performance tests for GRJ. The results of the cross-dataset test are shown in Table 5. In most of cases, with the help of GRJ, the generalization performance of DIQA can be improved to different degrees in cross data sets. It can be concluded that the GRJ performs well in terms of cross dataset set, and its performance does not depend on the database.
SROCC and PLCC comparison of the cross dataset test
SROCC and PLCC comparison of the cross dataset test
In the experiment of computational complexity, GRJ is compared with the classic algorithm SSIM in FRIQA. The experimental result drawn by the log-log coordinate chart are shown in Fig. 6. The time spent by both SSIM and GRJ have an approximate linear relationship with the sample size. In addition, for the same sample size, SSIM consumed several orders of magnitude more time than GRJ. What’s more, even if the sample size goes up by several orders of magnitude, GRJ remains nearly zero-cost to implement pseudo-label estimates of local quality. It is worth mentioning that assigning a global quality score to each patch is a special case of GRJ (σ1 = 0 and σ2 = 0), so they have consistent computational complexity. In other words, compared with the direct use of global quality score, GRJ utilizes the visual attention of the human visual system at the same computational complexity, further improving the performance of the model.
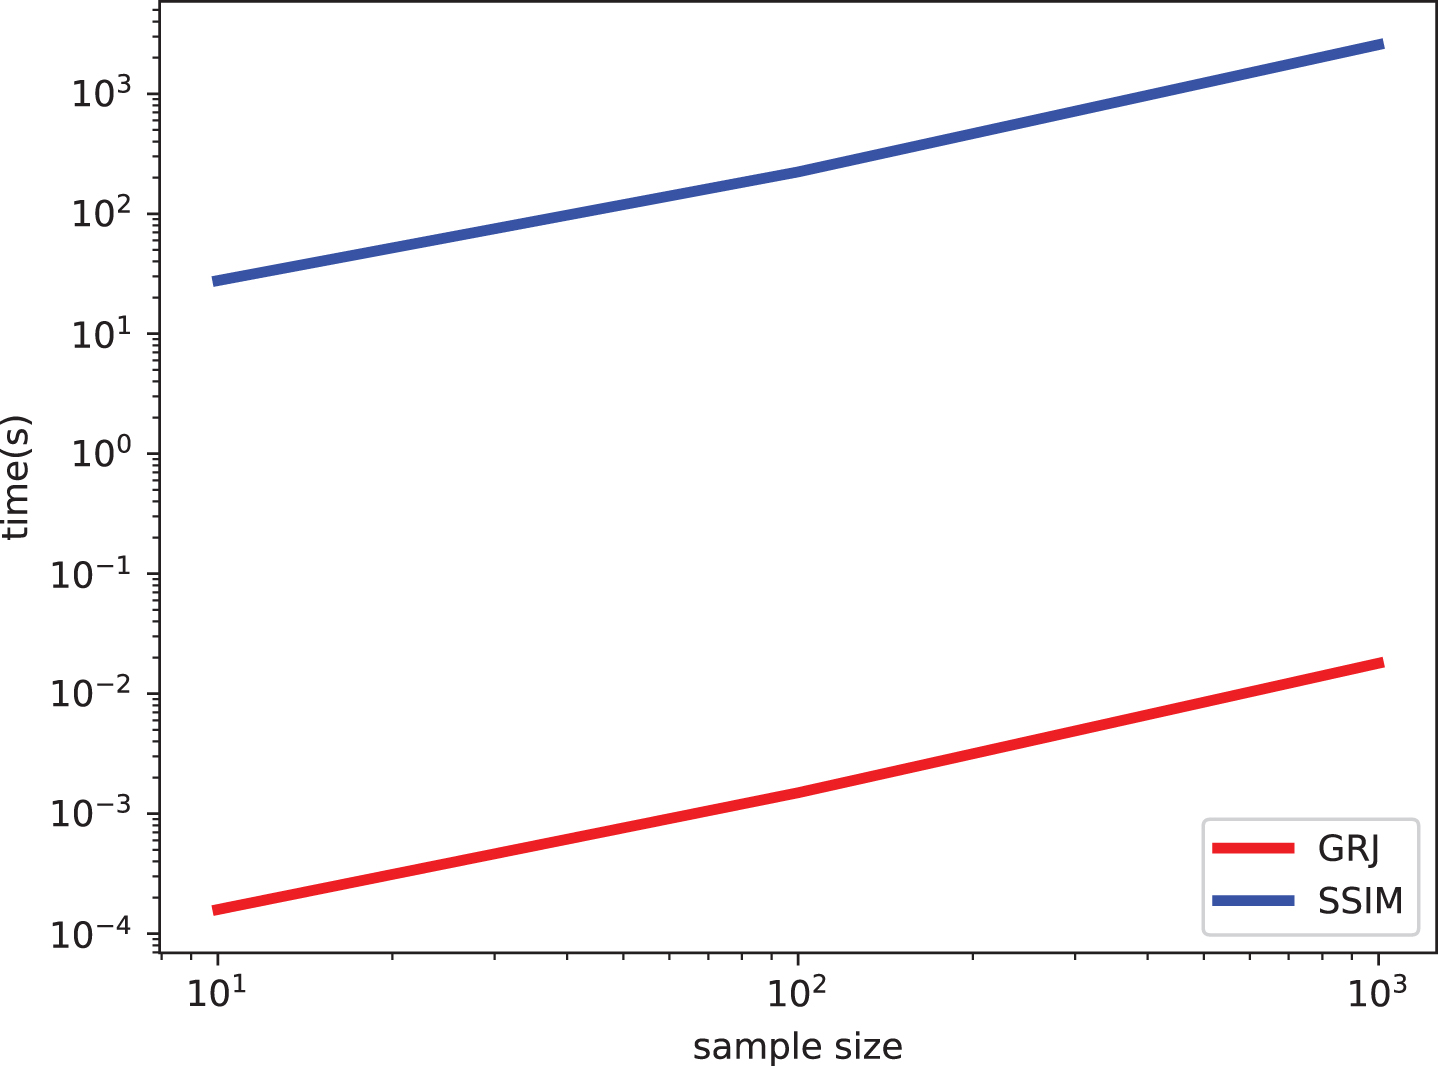
Comparison of computational complexity between SSIM and GRJ.
After continuous experiments, we find that not all standard deviation combinations are conducive to the further improvement of model performance. In other words, the decisive factor affecting the experimental results is the choice of standard deviation. As described in Section 4.3.2, the negative impact of noise introduced by overlarge standard deviation combination may be greater than the improvement of model performance caused by label diversification. Therefore, when researchers attempt to apply the proposed model to other fields, it is important to strike a balance between the diversity of the labels and the intensity of the introduced noise to obtain the appropriate standard deviation combination.
Conclusion
We provide a general and effective solution to the problem of unknown local image quality in patch and deep learning based NRIQA methods. Since the degree of distortion in different areas of the same image cannot be highly consistent, the differences in the observers’ evaluation scores for the same image are strongly related to the different areas of the image they are paying attention to. In GRJ, MOS/DMOS is first used as the mean value, and then different standard deviations are assigned according to the distortion degree of the image, so as to determine the unique gaussian distribution corresponding to each distorted image. Gaussian distribution assigns different but reasonable quality scores to different regions of the image, which successfully simulates the phenomenon that the evaluation of different observers is greatly different due to the different degree of local distortion. At the same time, the gaussian 3-sigma rule ensures the controllability of the jitter range and effectively avoids introducing label noise due to excessive jitter. Finally, we prove that the GRJ model can further improve the performance of the existing patch-based and deep learning-based model (DIQA). Our cross-dataset tests show that GRJ performance is independent of database selection. In the future, we will explore a new approach to better apply the characteristics of the human vision system to the NRIQA approach.
Footnotes
Acknowledgment
The work is supported by National Key R&D Program of China (2018YFC0309400), National Natural Science Foundation of China (61871188), Guangzhou city science and technology research projects (201902020008).